Automatic conversion method for multi-dimensional visualization model of data

A model and data technology, applied in the field of automatic conversion of multi-dimensional visualization models, can solve the problems of high development cost, long development cycle, high skill requirements, etc., and achieve the effect of convenient operation and compact structure

Active Publication Date: 2019-12-20
海南诺亦腾海洋科技研究院有限公司
View PDF3 Cites 4 Cited by
  • Summary
  • Abstract
  • Description
  • Claims
  • Application Information

AI Technical Summary

Problems solved by technology

[0002] In the existing technology, the process of using data information to build a visual model usually requires manual input of a large number of parameters and manual creation of a large number of models, resulting in high development costs and long development cycles. In addition, professional 3D technology is required for 3D modeling Only personne

Method used


Image

  • Automatic conversion method for multi-dimensional visualization model of data
  • Automatic conversion method for multi-dimensional visualization model of data
  • Automatic conversion method for multi-dimensional visualization model of data

Examples


Embodiment Construction

[0045] The specific embodiments of the present invention will be described below with reference to the accompanying drawings.

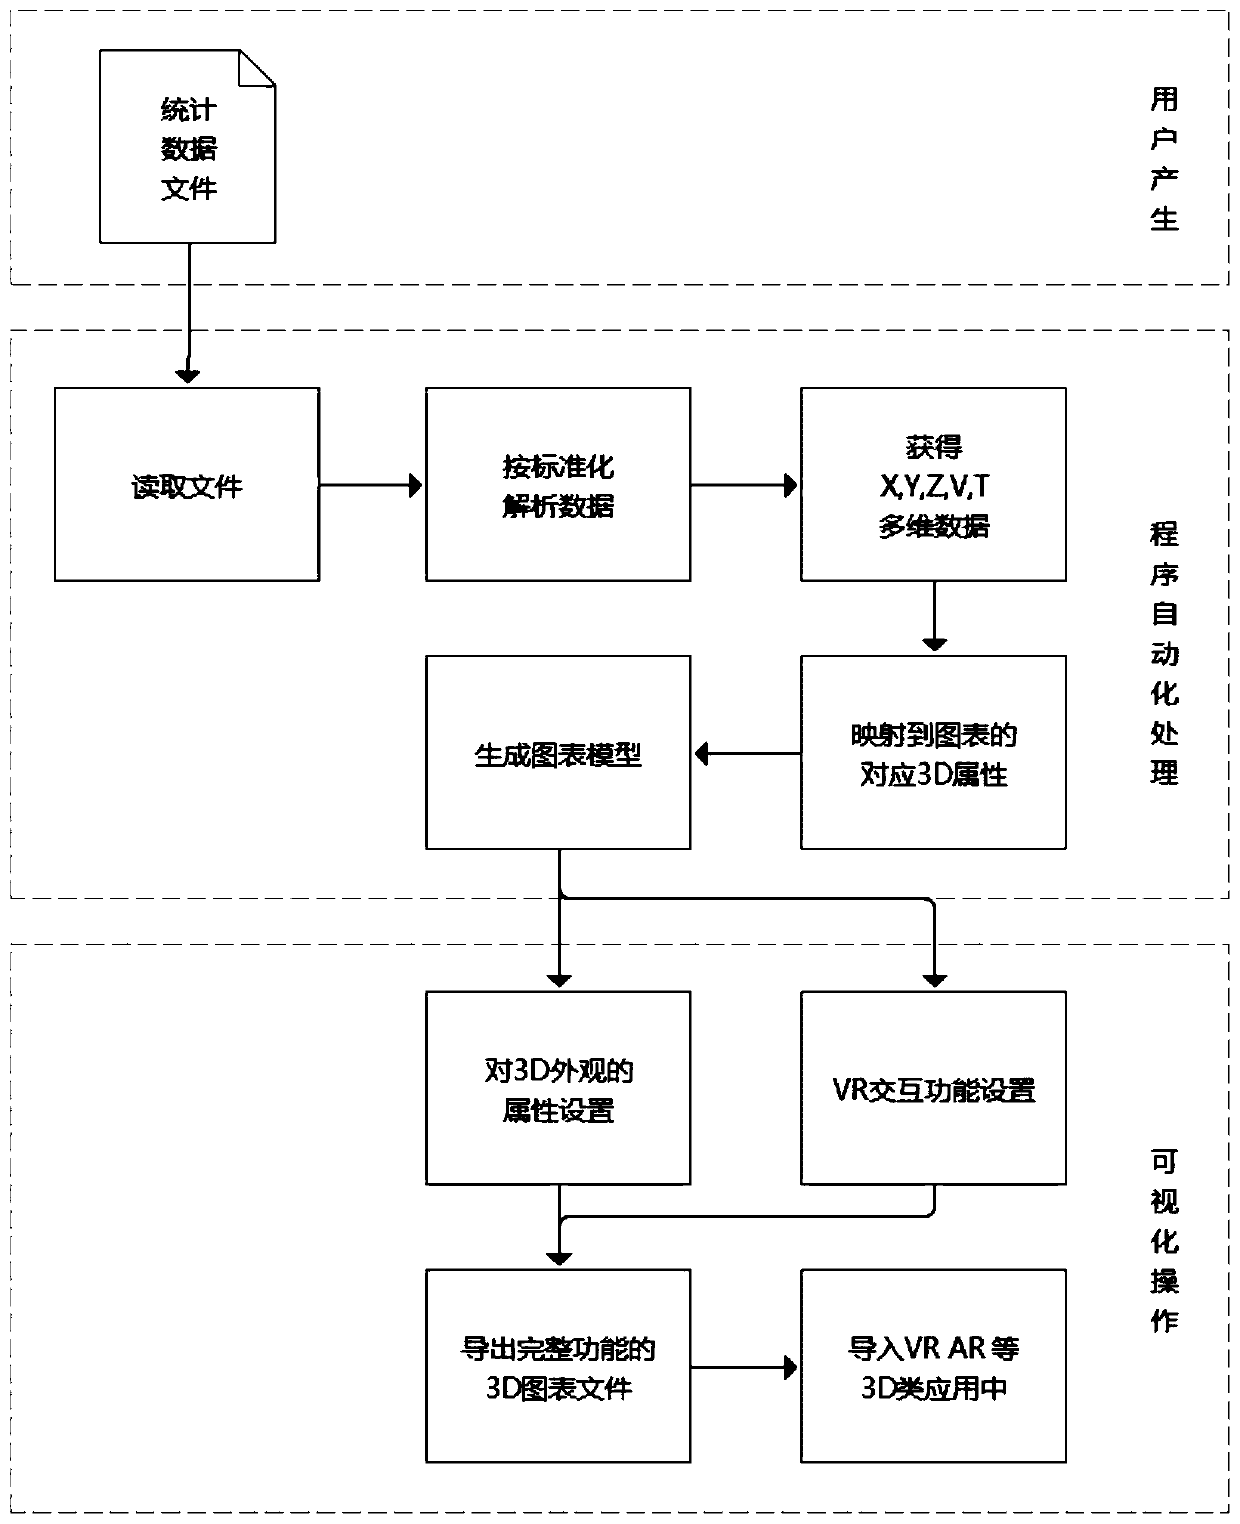
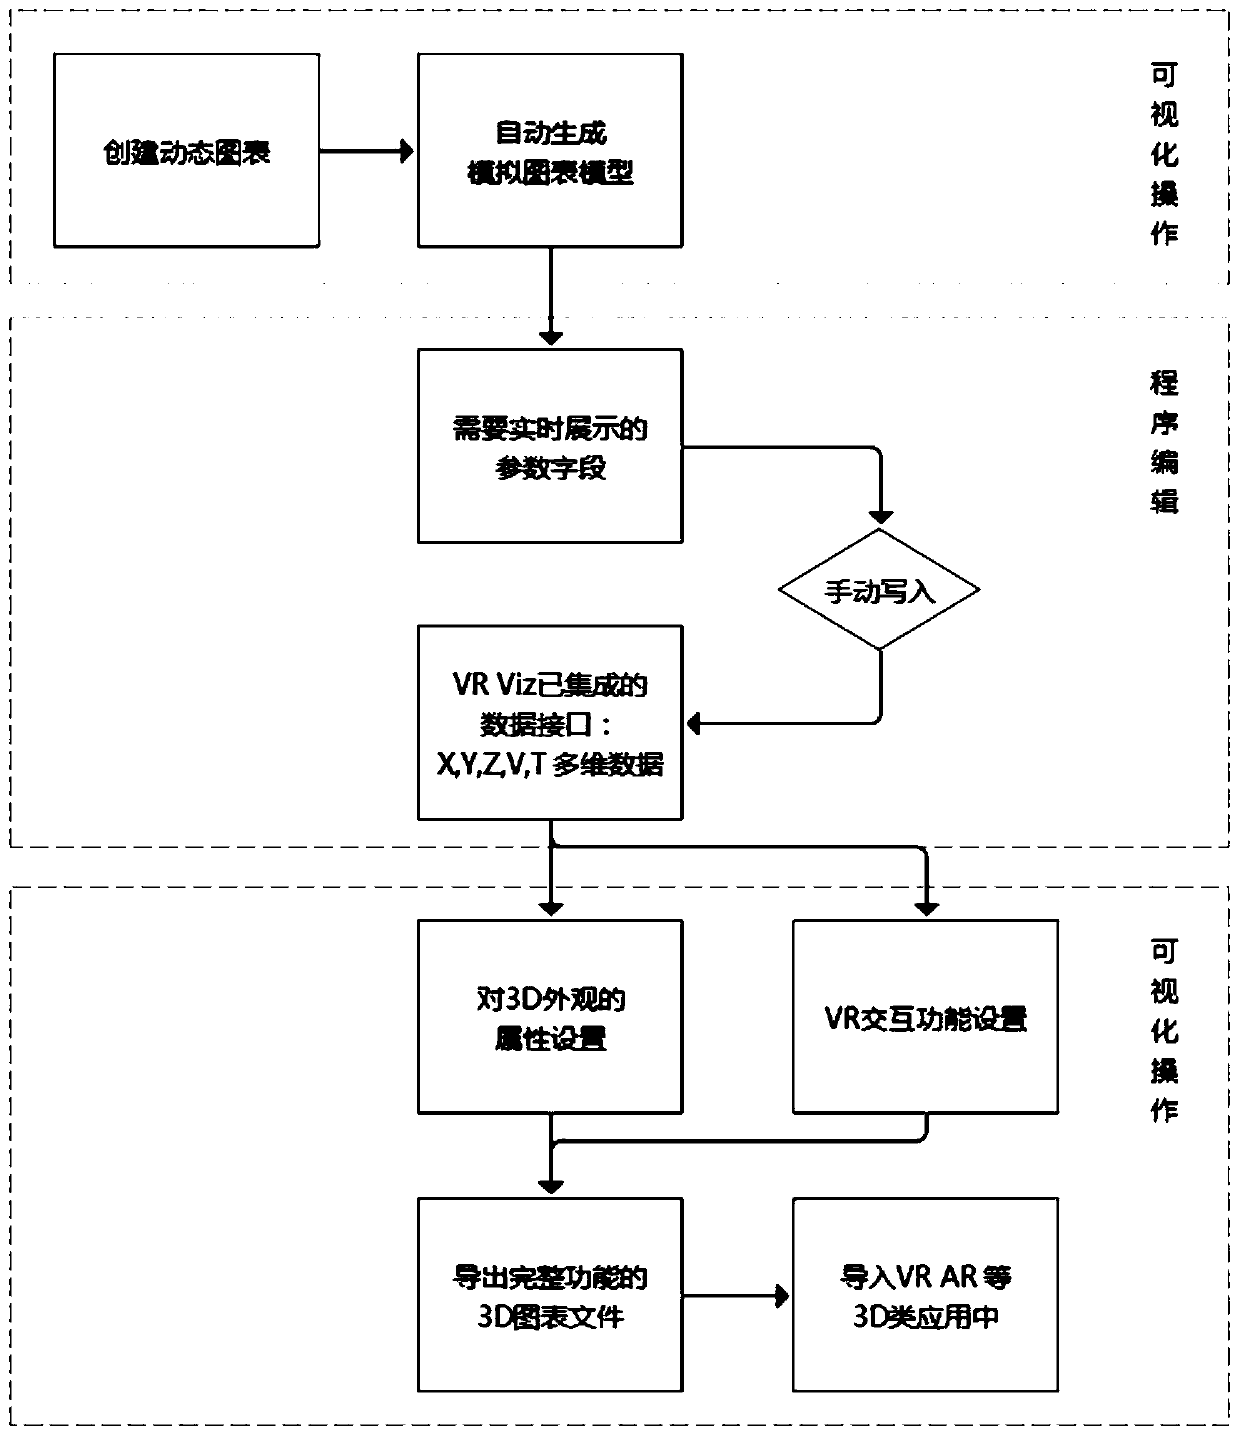
[0046] like figure 1 and figure 2 As shown in the figure, the automatic conversion method of the multi-dimensional visualization model of data in this embodiment includes static generation and dynamic generation. The static generation is to generate a multi-dimensional chart from an external table data file; the dynamic generation is to dynamically obtain the real-time data of the scene content and provide a numerical interface. , enter the value source field to realize the dynamic generation and real-time refresh of the chart in the content;

[0047] The static generation process is:

[0048] Import the static table data file generated by the user, perform standardized analysis on the static table data generated by the user, and obtain multi-dimensional data columns;

[0049] Map the multidimensional data column to the corresponding 3D model para...


PUM


Abstract

The invention relates to an automatic conversion method of a multi-dimensional visualization model of data, which comprises static generation and dynamic generation. The static generation process is as follows: importing a static table data file generated by a user, obtaining a multi-dimensional data column through standardized parsing, mapping the multi-dimensional data column to a correspondingthree-dimensional model parameter, and automatically generating a corresponding three-dimensional chart model. The dynamic generation process comprises the following steps: automatically generating athree-dimensional dynamic chart model by a program, writing parameter fields needing to be displayed in the dynamic chart model in real time into a data interface to obtain corresponding multi-dimensional data columns, performing appearance attribute and VR interaction function setting on the three-dimensional dynamic chart model, exporting a three-dimensional chart file with a complete function,and importing the three-dimensional chart file into a 3D interactive application. The method is used for multi-dimensional display of data, has a convenient 3D interaction function, and can be used for content of immersive experience, such as virtual reality, augmented reality and other technologies.

Description

technical field [0001] The invention relates to the technical field of virtual reality multi-dimensional data visualization, in particular to an automatic transformation method of a multi-dimensional visualization model of data. Background technique [0002] In the prior art, the process of using data information to establish a visual model usually requires manual input of a large number of parameters and manual creation of a large number of models, resulting in the problems of high development cost and long development cycle, and professional 3D technology is required for 3D modeling. Only personnel can realize the production of 3D charts, which requires higher skills; in addition, if the established model realizes the interactive function, the developer needs to develop each content separately, and the interaction cannot be quickly realized; If you modify it, you need to go back to the development software to modify it. SUMMARY OF THE INVENTION [0003] In view of the s...

Claims


Application Information

Patent Timeline
IPC IPC(8): G06T19/00G06T19/20G06F3/01
CPCG06T19/006G06T19/20G06F3/011
Inventor 郭瑽田承林李体雷
Owner 海南诺亦腾海洋科技研究院有限公司
Why Eureka
Try Eureka