Grid land hot area display method

A grid and hot zone technology, applied in the field of grid-based regional land hot zone assessment and display, can solve problems such as lack of timeliness, delayed market response, and inability to meet the requirements of labor

Pending Publication Date: 2020-01-03
上海克而瑞信息技术有限公司
View PDF0 Cites 0 Cited by
  • Summary
  • Abstract
  • Description
  • Claims
  • Application Information

AI Technical Summary

Problems solved by technology

Compared with the continuous growth of data volume, the operation cycle has been continuously improved, and manual execution is overtime, it is difficult to realize the collection and statistics of such a large amount of data
[0005] Two: information lags, affecting decision-making
[0006] Manually respond to land market fluctuations, premiums, failed auctions, etc., and there is a time period for cause investigation, and real-time feedback cannot be achieved
For the surrounding market, new houses, second-hand houses, and even surrounding supporting planning, it takes a longer period of time to collect, and there is a lag in market response
[0007] Three: static data, lack of timeliness
[0008] Manually executed reports have research value in the short to medium term, but long-term static data will lose their reference value, and the report cannot be continuously updated
[0009] Four: Rough particles, biased conclusions
If the granularity of data is required to break through the boundaries of sectors and general administrative divisions, and to be more detailed, manual labor can no longer meet the requirements
[0011] Five: Marginal plots, lack of data
If the granularity of data is required to break through the boundaries of sectors and general administrative divisions, and to be more detailed, manual labor can no longer meet the requirements
[0013] Six: The algorithm is simple and has no growth potential
[0014] The manual report is a static value, long-term use, need to do data query work again
And the algorithm is generally a traditional algorithm, which cannot actively respond to the ever-changing market environment

Method used


Image

  • Grid land hot area display method
  • Grid land hot area display method
  • Grid land hot area display method

Examples


Embodiment Construction

[0050] The following are specific examples of the present invention to further describe the technical solutions of the present invention, but the present invention is not limited to these examples.

[0051] The display method of the grid land thermal area includes:

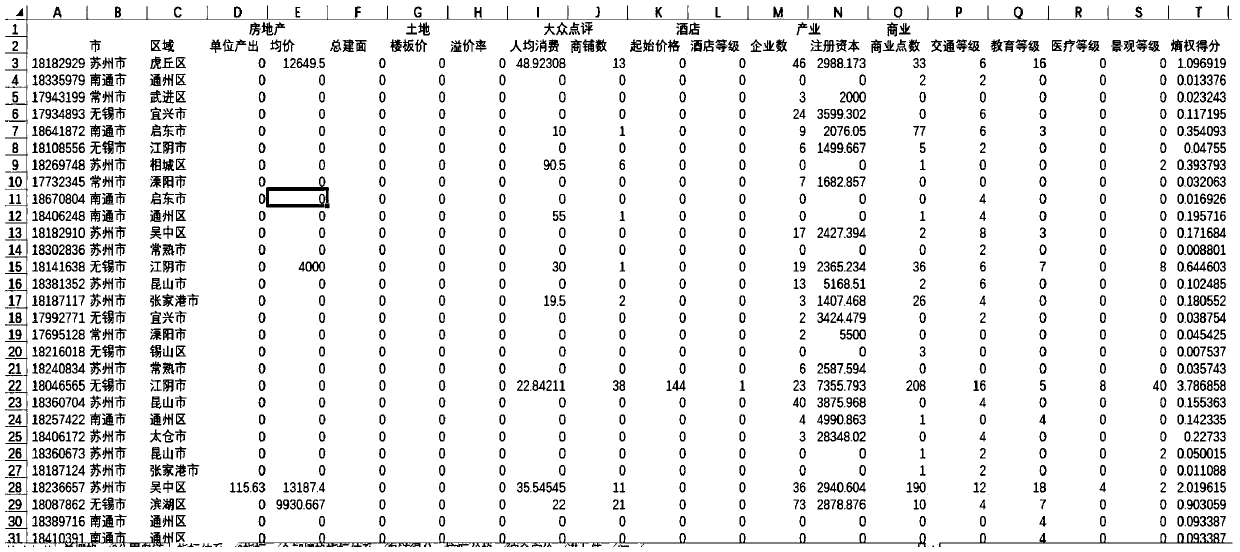
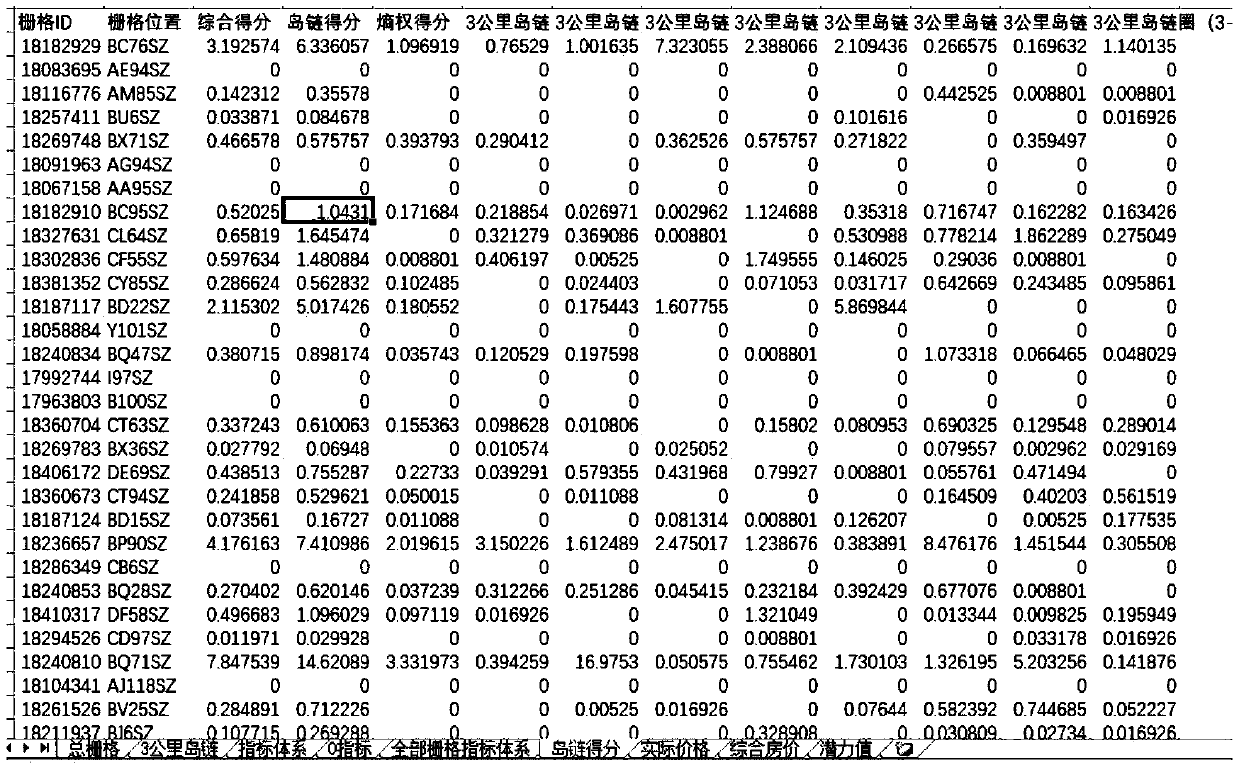
[0052]Step S1: Establish an index system, including real estate-related data, industry data, consumption data, and supporting facility data; real estate-related data includes two dimensions of real estate and land, real estate includes two data of unit output and average price, and land includes general construction Three data of surface, floor price and premium rate; industrial data includes the number of enterprises and registered capital; consumption data uses per capita consumption and number of shops in Dianping, as well as hotel prices and hotel grades as data sources; supporting facilities data includes commercial points, Data such as traffic level, education level, medical level and landscape level;

[00...


PUM


Abstract

The invention relates to a grid land hot area display method, belongs to the technical field of big data application, and solves the problem of imperfect land hot area algorithm in the prior art. Thegrid land hot area display method includes: establishing a perfect index system in advance; carrying out de-duplication on each index; assigning the weight of each index by adopting an entropy weightmethod; calculating a grid entropy weight score; further calculating the island chain score through the entropy weight score; obtaining a comprehensive score by using the entropy weight score and theisland chain score; using the obtained comprehensive score rank to divide the plot into a high-energy-level hot zone, a medium-energy-level hot zone and a low-energy-level hot zone; dividing the plotinto a low-potential area, a high-potential area and a risk area by calculating the potential value of each grid, forming nine definition labels through intersection and displaying the nine definitionon the map in different colors. A user can conveniently check the score of each grid, and the position of each hot area on the map can be visually and clearly known.

Description

technical field [0001] The invention belongs to the technical field of big data applications, and relates to a land value evaluation method, in particular to a method for evaluating and displaying land hot spots in gridded regions. Background technique [0002] In the development process of the real estate market, there are a lot of preliminary land evaluation work. Land price evaluation is one of the important contents of land market management. Conventional land price evaluation methods mainly include feature selection, feature quantification, feature extraction, subject modeling, land price evaluation, etc. step. Among them, there are the following shortcomings in the process of land price feature quantification: [0003] 1: Massive data, artificial bottleneck [0004] With the more detailed and in-depth research on cities, plates, and land in the early stage, the demand for data is also increasing. Compared with the increasing data volume, the operation cycle is const...

Claims


Application Information

Patent Timeline
IPC IPC(8): G06Q10/06G06Q50/16
CPCG06Q10/06393G06Q50/16
Inventor 王新科刘烨朱洪涛
Owner 上海克而瑞信息技术有限公司
Why Eureka
Try Eureka