One-sided Sparse Nested Array Design Method for One-dimensional Array Direction Finding
A design method and technology of nested arrays, which are applied in directions such as direction finder, direction finder using electromagnetic waves, direction finder using radio waves, etc., to facilitate theoretical design and practical engineering applications, reduce operating costs, and improve The effect of the number of probes
- Summary
- Abstract
- Description
- Claims
- Application Information
AI Technical Summary
Problems solved by technology
Method used
Image
Examples
example 1
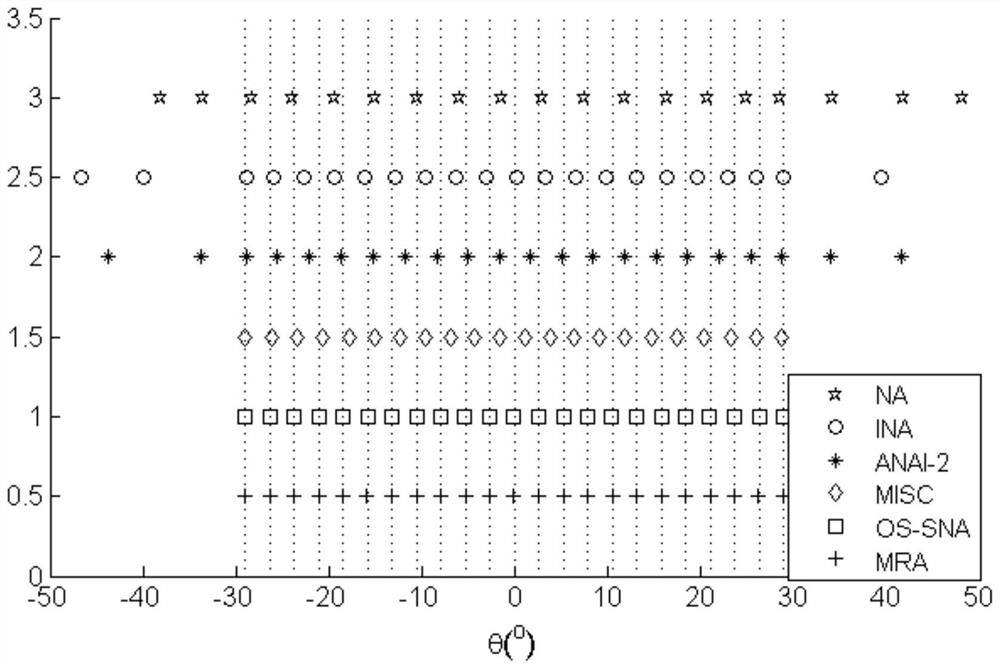
[0048] Simulation example 1: Set the total number of array elements N=13 unchanged, basic nested array (Nested Array, NA), augmented nested array (Augmented Nested Array, ANAI2), improved nested array (Improved Nested Array, INA) , maximum interval limit nested array (Maximum Inter-element Spacing Constraint, MISC) and unilateral sparse nested array (One-side Sparse Nested Array, OS-SNA) of the present invention middle large interval uniform line array element interval Take it as N 1 +1=12, the number of array elements is taken as N 2 =1. This example uses the theoretical optimal array MRA as a reference. According to the analytical expressions of the above nested arrays, their normalized array element positions (omitting the spacing unit d) can be obtained as
[0049]
[0050] Assume that there are 23 uncorrelated information sources incident on the above sparse array in space, and the incident angles are evenly distributed between -30° and 30°. The signal-to-noise rat...
example 2
[0051] Simulation example 2: Set the total number of array elements to 14, N 1 =11,N 2 =2. The normalized array element positions of the six sparse structures are
[0052]
[0053] Assume that 11 uncorrelated signals are incident on the above six sparse structures, and the incident angles are uniformly distributed between -60° and 60°. Implement 200 Monte Carlo experiments, and estimate the root-mean-square error (Root-mean-square Error, RMSE) with the incident signal signal-to-noise ratio (Signal to noise ratio, SNR) when the number of snapshots is 2000. The curves are plotted in Fig. 4(a). The curve of RMSE changing with the number of snapshots is plotted in Fig. 4(b), and the signal-to-noise ratio is set to 10dB at this time. It can be seen from the figure that the OS-SNA proposed by the present invention has the closest estimation error to MRA, and is lower than the RMSE results of the other four structures. This is because for the above six sparse structures, the ...
PUM
 Abstract
Description
Claims
Application Information
 - R&D
- Intellectual Property
- Life Sciences
- Materials
- Tech Scout
- Unparalleled Data Quality
- Higher Quality Content
- 60% Fewer Hallucinations
Browse by: Latest US Patents, China's latest patents, Technical Efficacy Thesaurus, Application Domain, Technology Topic, Popular Technical Reports.
© 2025 PatSnap. All rights reserved.Legal|Privacy policy|Modern Slavery Act Transparency Statement|Sitemap|About US| Contact US: help@patsnap.com


