

Interactive data analysis method and device, electronic equipment and computer readable storage medium
A technology of interactive data and analysis methods, applied in the fields of interactive data analysis methods, electronic equipment, computer-readable storage media, and devices, and can solve problems such as low data statistics efficiency, poor user experience, and lack of interactivity in graphs, etc. Achieve the effect of improving data analysis efficiency and improving user experience
- Summary
- Abstract
- Description
- Claims
- Application Information
AI Technical Summary
Problems solved by technology
Method used
Image

Examples
Embodiment 1
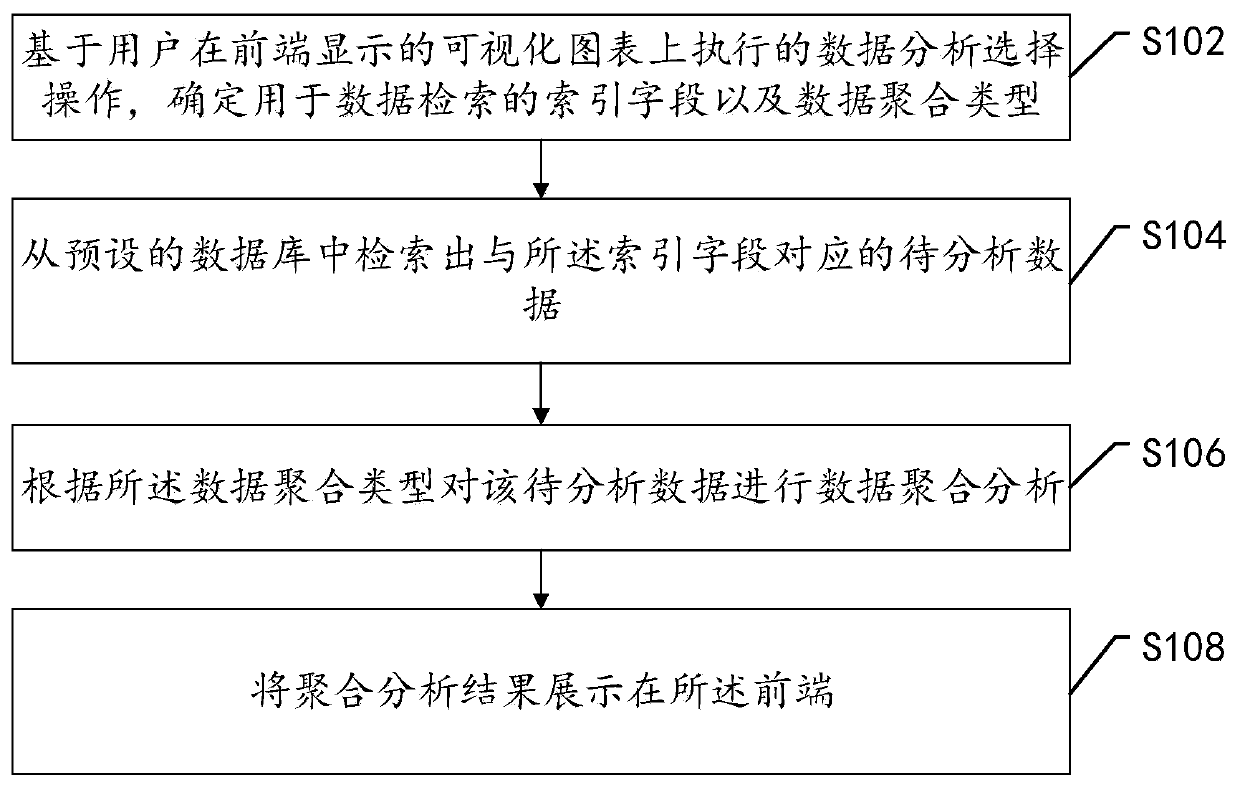
[0029] Such as figure 1 As shown, it is a schematic flowchart of the interactive data analysis method provided in Embodiment 1 of the present application. The interactive data analysis method can be performed by, but not limited to, electronic devices. The interactive data analysis method can include the following steps:
[0030] Step 102, based on the data analysis selection operation performed by the user on the visualization chart displayed on the front end, determine the index field and data aggregation type used for data retrieval.
[0031] In the first embodiment, the front end refers to a user interface for displaying data information such as charts and for users to perform operations such as data analysis and selection operations. The front end can be integrated on the electronic device, or it can be independent of the electronic device, but can The terminal that performs data interaction with the electronic device is not limited in the first embodiment.
[0032] As a...
Embodiment 2
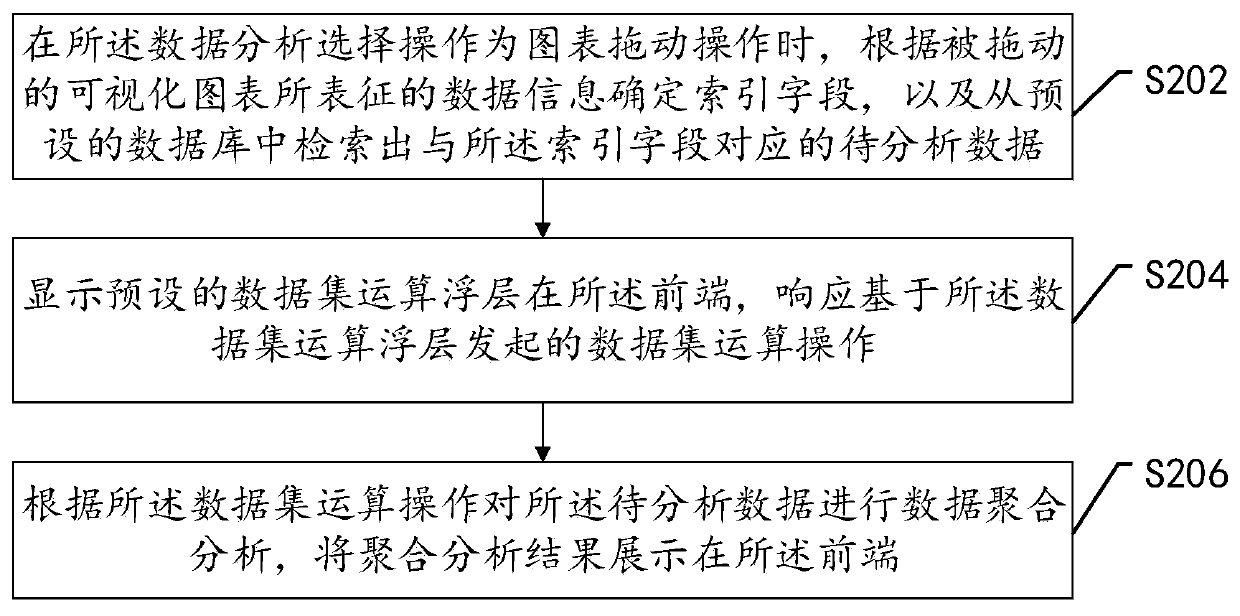
[0063] Compared with the interactive data analysis method given in Example 1, the interactive data analysis method given in Example 2 of the present application adds a chart dragging operation initiated based on a visual chart to perform combination, merger, difference, Complementary data analysis operations. The interactive data analysis method can include such as image 3 The steps shown are as follows.
[0064] Step 202, when the data analysis selection operation is a chart dragging operation, determine the index field according to the data information represented by the dragged visual chart, and retrieve the data to be analyzed corresponding to the index field from a preset database.
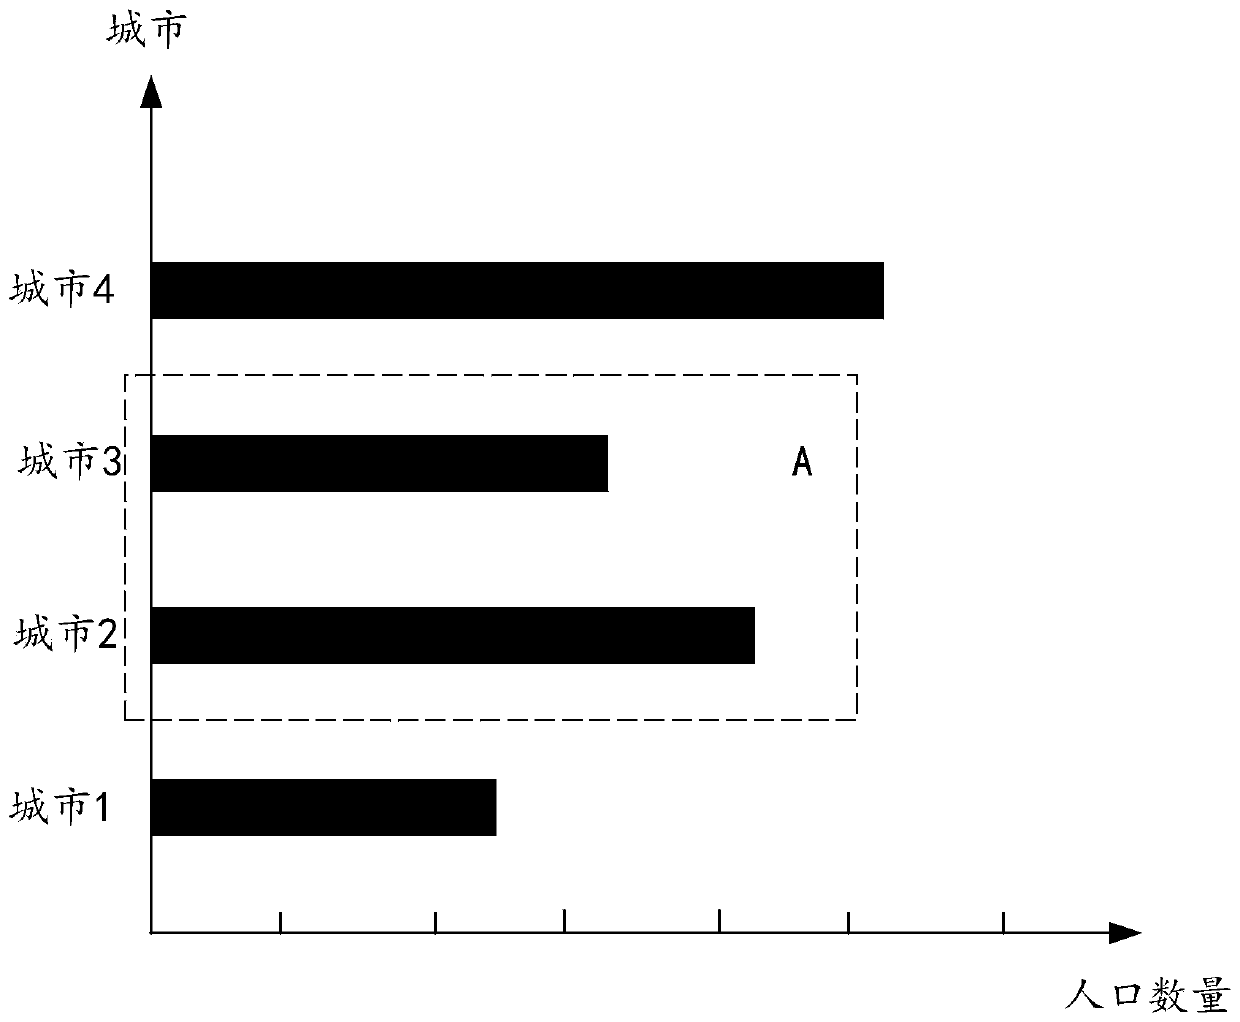
[0065] In the second embodiment, the chart dragging operation may be a drag operation performed on one or more individual charts, or a drag operation performed on a part of the chart area on the visualized chart. This is not limited.
[0066] For example, assuming that the visual charts d...
Embodiment 3
[0090] Figure 4 A schematic structural diagram of the interactive data analysis device 10 provided in the third embodiment. Please refer to Figure 4 , in a software implementation, the interactive data analysis device 10 may include an information determination module 110 , a data retrieval module 120 , an aggregation analysis module 130 , and a result display module 140 . in:
[0091] An information determination module 110, configured to determine an index field for data retrieval and a data aggregation type based on the data analysis selection operation performed by the user on the visualization chart displayed on the front end;
[0092] A data retrieval module 120, configured to retrieve the data to be analyzed corresponding to the index field from a preset database;
[0093] An aggregation analysis module 130, configured to perform data aggregation analysis on the data to be analyzed according to the data aggregation type;
[0094] The result display module 140 is c...
PUM
 Abstract
Description
Claims
Application Information