Gridding visualization method for scanning laser radar detection data

A technology for scanning lasers and detecting data, which is applied in measuring devices, climate sustainability, and radio wave measurement systems, etc. It can solve the problems of poor accuracy and data processing efficiency, low drawing efficiency, and rarely consider the accuracy of data interpolation, etc. question

Active Publication Date: 2020-03-17
XIAN UNIV OF TECH
View PDF2 Cites 5 Cited by
  • Summary
  • Abstract
  • Description
  • Claims
  • Application Information

AI Technical Summary

Problems solved by technology

The traditional lidar data visualization method is mainly aimed at the detection data of the vertical detection method. For the scanning detection data, the data interpolation is only performed in the vertical direction, and the accuracy of the data interpolation caused by the detection angle is rarely considered. In addition, the scanning laser radar In the process of data visualization, most methods directly use data processing software to generate images, and the drawing efficiency is low; and the current method is acceptable in the case of small data size, but the speed of processing and visualization is acceptable when the data volume is large. In the case of , its accuracy and data processing efficiency are not good

Method used


Image

  • Gridding visualization method for scanning laser radar detection data
  • Gridding visualization method for scanning laser radar detection data
  • Gridding visualization method for scanning laser radar detection data

Examples


Embodiment Construction

[0079] The present invention will be described in detail below in conjunction with the accompanying drawings and specific embodiments.

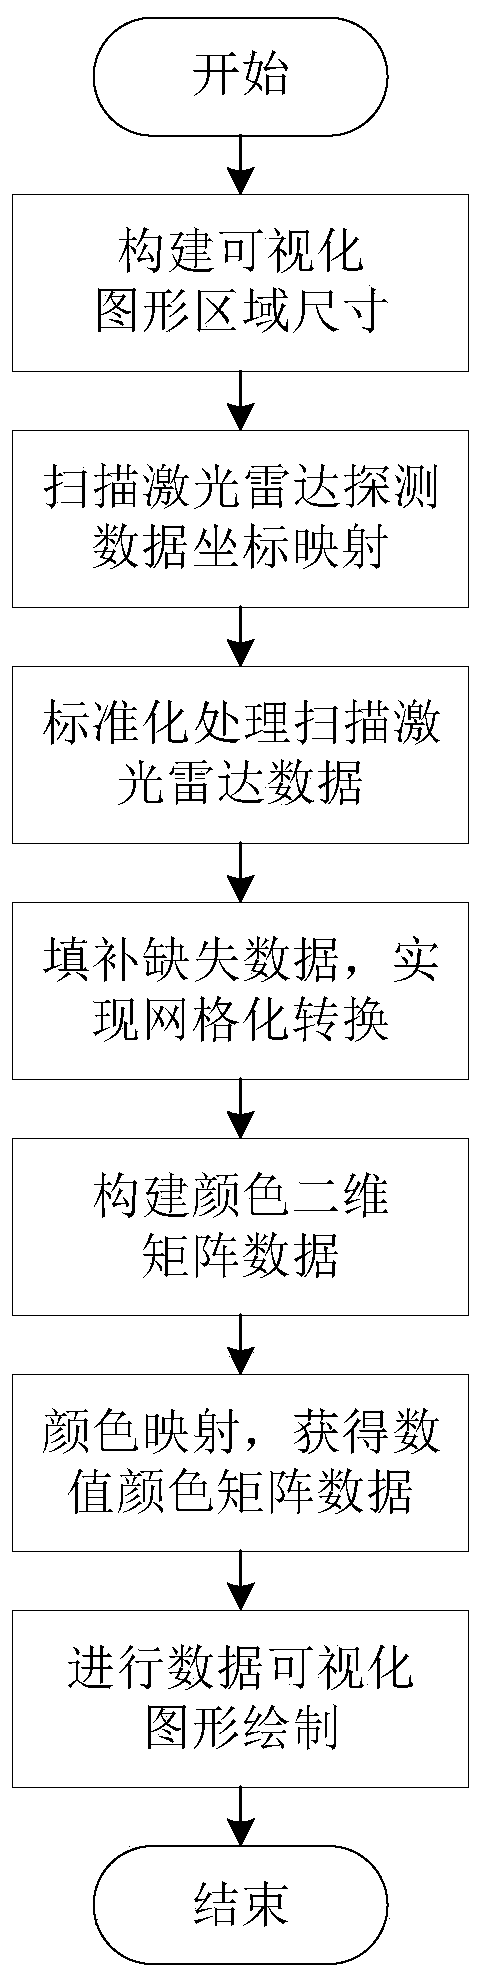
[0080] The present invention provides a scanning laser radar detection data grid visualization method, such as figure 1 As shown, the specific steps are as follows:

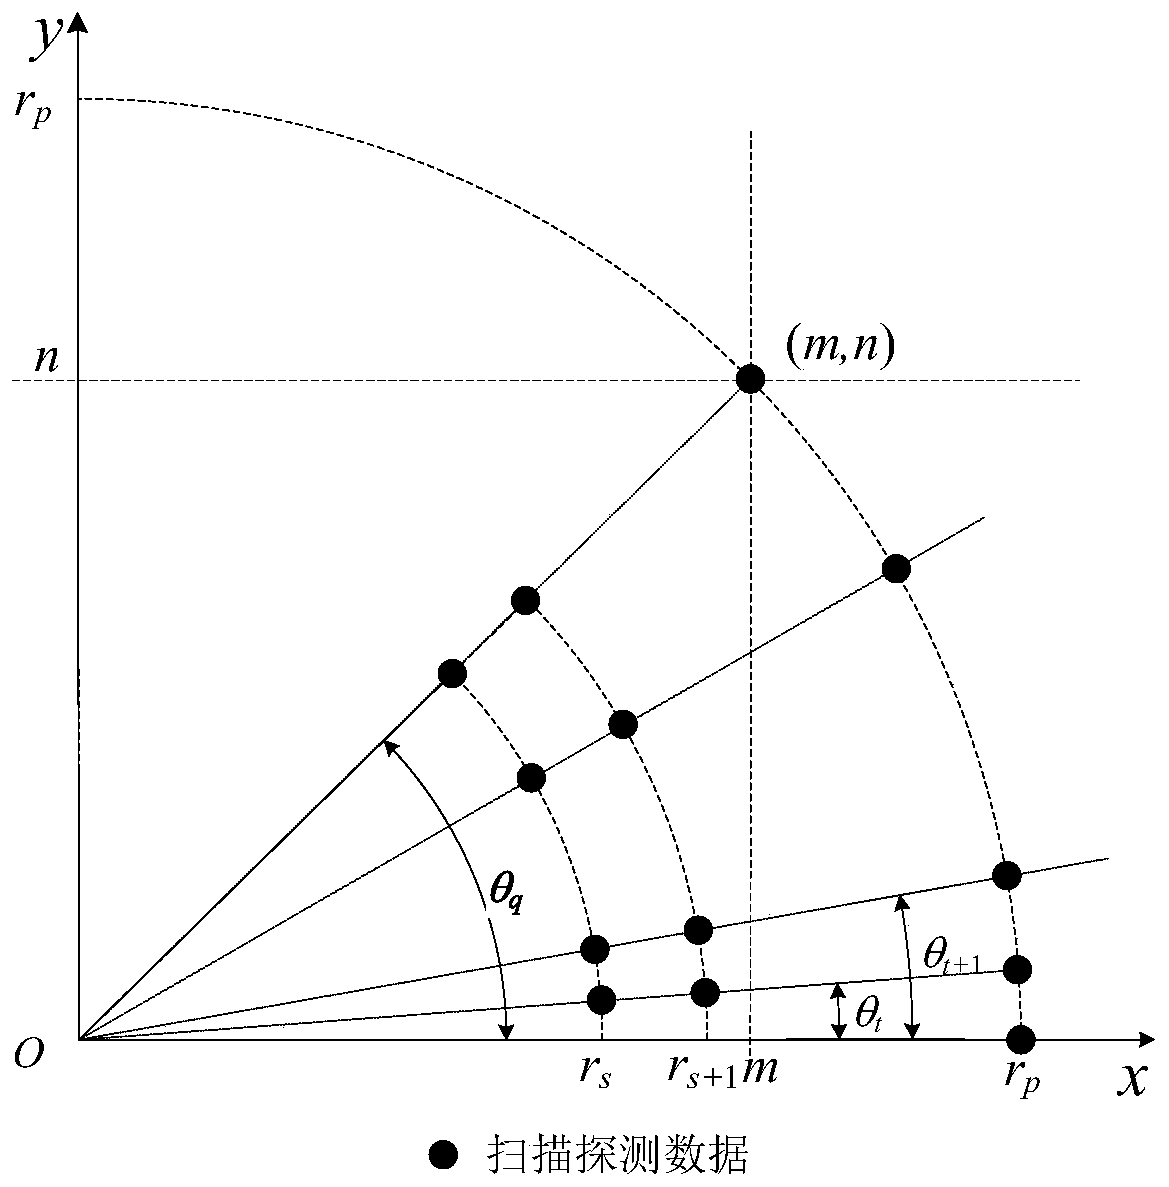
[0081] Step 1. Construct the size of the visualized graph. Since the maximum elevation angle of the scanning laser radar detection generally does not exceed 45°, according to the detection scanning distance and detection angle of the scanning laser radar detection data, a visual graph area with a size of m×n is defined (such as figure 2 Shown), m is width, n is height, and the unit is computer screen pixel here;

[0082] In step 1:

[0083] m=r p ·cosθ q , n=r p · sinθ q

[0084] Among them, r p is the distance of the pth sampling point in the elevation direction of the scanning lidar detection, p is the maximum number of sampling points in the elevation direction of th...


PUM


Abstract

The invention discloses a gridding visualization method for scanning laser radar detection data. The gridding visualization method specifically comprises the steps of: 1, defining a region according to a detection scanning distance and a detection angle of scanning laser radar detection data; 2, performing coordinate conversion on polar coordinates of the scanning laser radar detection data, and converting the polar coordinates into a Cartesian product coordinate form V (m, n); 3, standardizing the data V (m, n) by adopting a normalization method to obtain U (m, n); 4, performing interpolationfilling on a data missing position in the U (m, n) by utilizing a vertical and horizontal interpolation method; 5, creating and initializing two-dimensional space color matrix data C (m, n) corresponding to visual graph sizes m and n, and mapping data G (m, n) into the C (m, n) representing numerical value intensity; and 6, drawing numerical values of the C (m, n) to pixel positions by adopting aprogram visualization method by utilizing a corresponding relationship between pixels and the C (m, n). The gridding visualization method improves the precision of data interpolation.

Description

technical field [0001] The invention belongs to the technical field of atmospheric detection laser radar measurement data processing, and in particular relates to a gridded visualization method for scanning laser radar detection data. Background technique [0002] The problem of particulate pollution caused by atmospheric aerosols is the main factor affecting the quality of my country's atmospheric environment. There are many aerosol observation techniques and research methods. The development of lidar as a new technology for active optical remote sensing monitoring has changed the deductive method of the traditional atmospheric aerosol detection method from point to line to surface, and provided a new technology and detection method for atmospheric environment research, overcoming the traditional atmospheric environment. Due to many limitations in the research, it has realized large-space, long-term, multi-scale, and multi-parameter remote sensing and telemetry, which has b...

Claims


Application Information

Patent Timeline
Patent Type & Authority Applications(China)
IPC IPC(8): G01S17/95G01S7/48
CPCG01S17/95G01S7/48Y02A90/10
Inventor 陈浩陈凯军丁雅婕李博朱磊胡先智邱原闫庆
Owner XIAN UNIV OF TECH
Why Eureka
Try Eureka