Regional power transmission network operation multi-dimensional analysis method based on big data

An analysis method and transmission network technology, applied in data processing applications, instruments, character and pattern recognition, etc., can solve problems such as poor operability, lack of quantitative analysis data support, and inability to meet the needs of power grid development and diagnosis work

Active Publication Date: 2020-07-17
STATE GRID FUJIAN POWER ELECTRIC CO ECONOMIC RES INST +1
View PDF5 Cites 11 Cited by
  • Summary
  • Abstract
  • Description
  • Claims
  • Application Information

AI Technical Summary

Problems solved by technology

Due to technical means and workload, traditional methods can only obtain statistical results of unilateral indicators such as equipment scale and equipment load rate. Evaluation of the overall level of the system, poor operability
Lack of providing sufficient scientific and const

Method used


Image

  • Regional power transmission network operation multi-dimensional analysis method based on big data
  • Regional power transmission network operation multi-dimensional analysis method based on big data
  • Regional power transmission network operation multi-dimensional analysis method based on big data

Examples


Embodiment 1

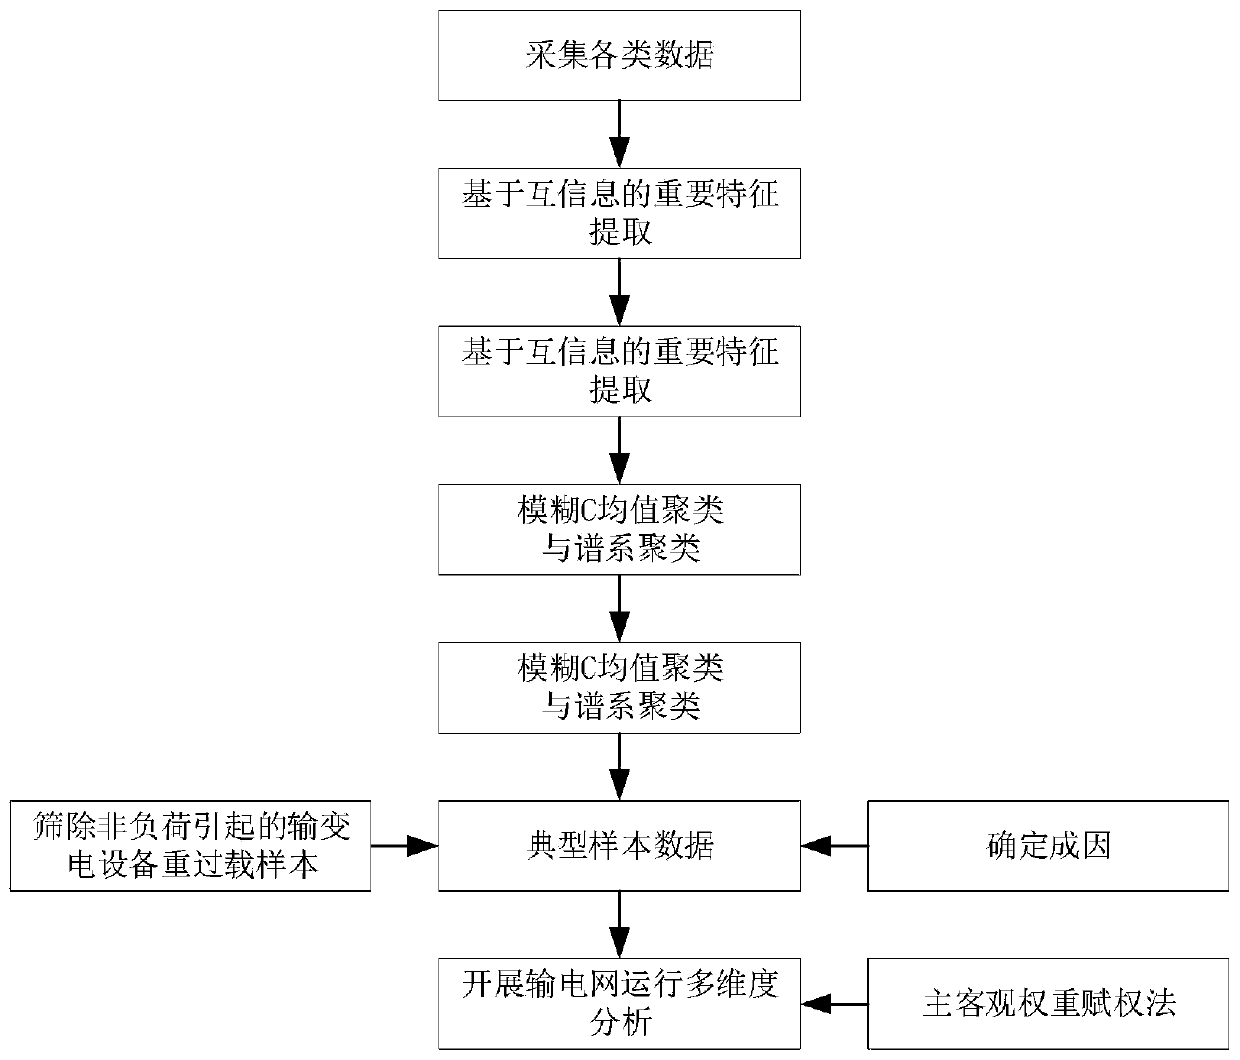
[0075] Such as figure 2 As shown, a multi-dimensional analysis method of regional transmission network operation based on big data includes the following steps:

[0076]As a further setting of the above scheme, step S1 specifically includes: internal data rely on power system telemetry and telesignaling data, according to the respective characteristics of the power grid and primary and secondary equipment, according to the power PMS system, power QS system data, data acquisition and monitoring system (SCADA); The external data mainly comes from the Internet, through the weather information published by the National Meteorological Administration and whether it is a holiday label data, which mainly includes:

[0077] Basic information of power transmission and distribution equipment: power transmission and transformation equipment capacity, equipment ID, voltage level, date of commissioning, and importance level of power transmission and transformation equipment.

[0078] Oper...


PUM


Abstract

The invention discloses a regional power transmission network operation multi-dimensional analysis method based on big data, and the method comprises the steps: carrying out the screening of importantfeatures based on mutual information, and forming a typical operation curve through a fuzzy C value clustering and pedigree clustering algorithm; removing heavy overload sample data caused by operation mode change, maintenance and the like; carrying out multi-dimensional analysis on whether the power transmission network can meet the load demand or not; carrying out the power transmission networkoperation multi-dimensional analysis on the basis of the operation efficiency, the equipment level and the load supply and demand coordination, carrying out multi-level division on power transmissionnetwork regional development. The deviation of evaluation standards caused by subjective cognition is reduced, the scientificity and reasonability of evaluation results are ensured, and reliable reference suggestions are provided for power grid planning personnel.

Description

technical field [0001] The invention relates to a method for judging the cause of heavy overload of transmission network equipment based on big data technology, and belongs to the field of transmission network operation benefit evaluation and electric power big data application field. Background technique [0002] With the application of automation and information technology in the power system, a large amount of operating data will be generated during the operation of the power system, such as node voltage, node current, active power and reactive power, etc. These data present a linear arrangement on the time scale, which constitutes the time series operation data of the power grid. By analyzing each section, it can characterize the operating state of the system and make various analysis on the system. In some important periods, such as the period of the highest or lowest temperature in a year, the period of major social activities, etc., the electricity load may fluctuate ...

Claims


Application Information

Patent Timeline
IPC IPC(8): G06Q10/06G06Q50/06G06K9/62
CPCG06Q10/0639G06Q50/06G06F18/23213Y04S10/50
Inventor 黎萌林毅吴威严通煜黄屏发李明浩
Owner STATE GRID FUJIAN POWER ELECTRIC CO ECONOMIC RES INST
Why Eureka
Try Eureka