
Time series anomaly detection method and system for key performance index data

A technology for key performance indicators and anomaly detection. It is used in electrical digital data processing, error detection/correction, and response error generation. It can solve problems such as low generalization performance, unlearned training, and low detection efficiency.

Active Publication Date: 2020-08-21
BEIJING JIAOTONG UNIV
View PDF5 Cites 20 Cited by
  • Summary
  • Abstract
  • Description
  • Claims
  • Application Information

AI Technical Summary

Problems solved by technology

However, the above method only has an outlier output for the abnormality of the observed sample, and does not learn and train a distribution of the sample itself. Secondly, the existing time series anomaly detection algorithms have certain limitations to varying degrees. For example, the accuracy rate is not high, the detection efficiency is low, and the generalization performance is not high

Method used


Image

  • Time series anomaly detection method and system for key performance index data
  • Time series anomaly detection method and system for key performance index data
  • Time series anomaly detection method and system for key performance index data

Examples


no. 1 example

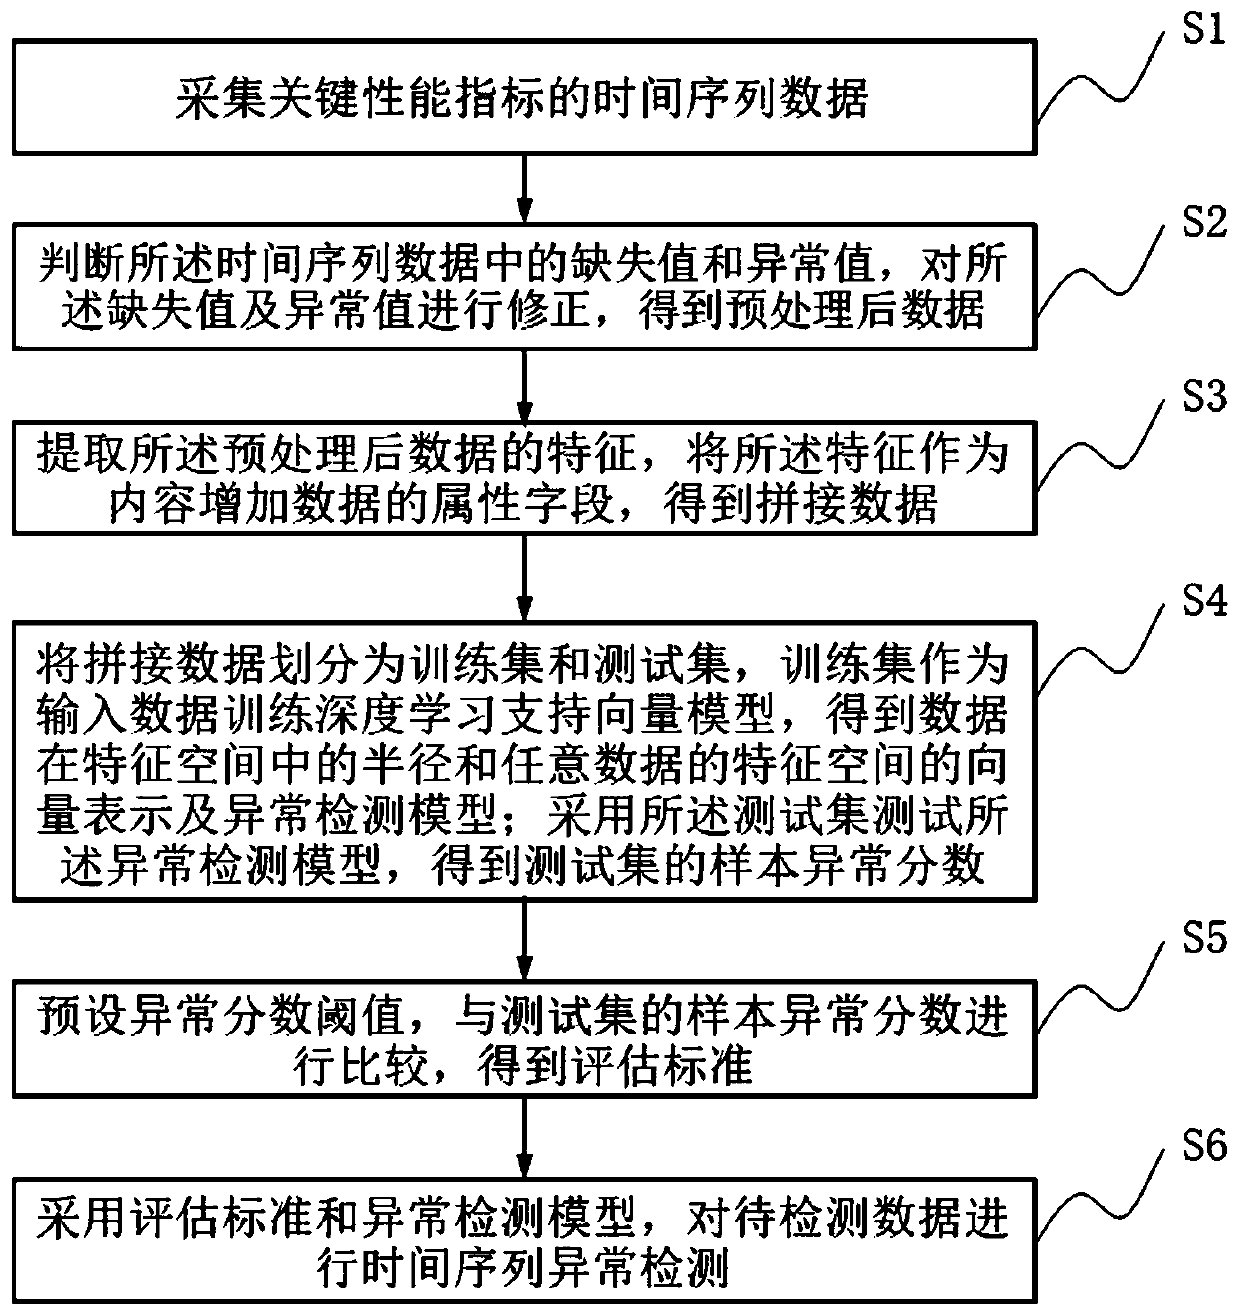
[0068] This embodiment provides a time series anomaly detection method for KPI data. figure 1 Shown is the flow chart of the timing anomaly detection method for the KPI data. Such as figure 1 As shown, the timing anomaly detection method of the KPI data includes the following steps:

[0069] Step S1, collecting time series data of key performance indicators.

[0070] In this step, the minute-grained data of the measured object within a period of time is collected, and the data includes the following attribute fields: the sequence ID of the key performance indicator, the time stamp, and the value of the key performance indicator. Manually mark the abnormalities in the data, and the attribute field of the data will add a "label" field, with 0 indicating normal points and 1 indicating abnormal points, which are used as the basis for evaluating the model during testing. The process of manually labeling abnormalities is generally carried out by experts. This part of the work is ...

no. 2 example

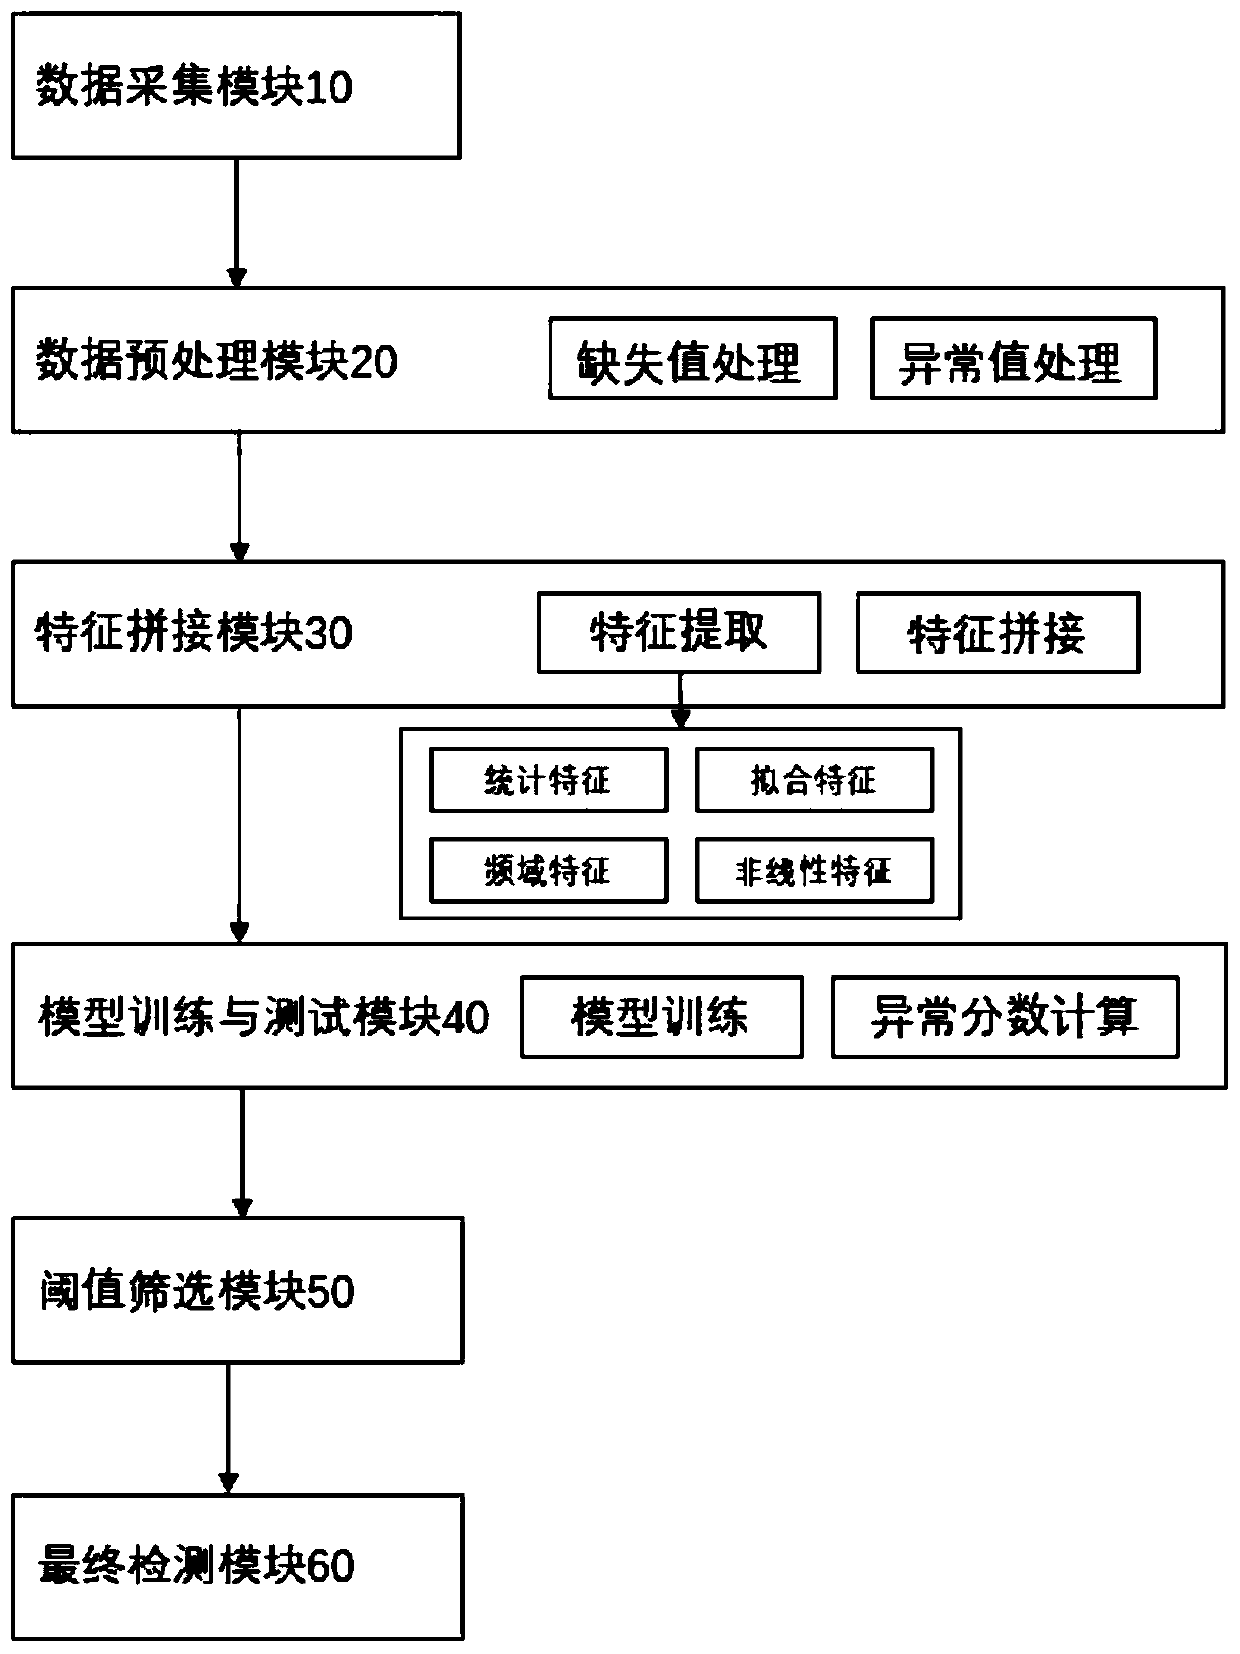
[0116] This embodiment provides a timing anomaly detection system for key performance indicator (KPI) data, figure 2 A schematic diagram of the structure of the system is shown. Such as figure 2 As shown, the timing anomaly detection system for KPI data includes: a data collection module 10 , a data preprocessing module 20 , a feature splicing module 30 , a model training and testing module 40 , a model evaluation module 50 , and a final detection module 60 .

[0117] Wherein, the data collection module 10 is connected with the data preprocessing module 20 for collecting time series data of key performance indicators.

[0118] The data preprocessing module 20 is connected to the feature splicing module 30, and is used for judging missing values ​​and abnormal values ​​in the time series data, correcting the missing values ​​and abnormal values, and obtaining preprocessed data.

[0119] The feature splicing module 30 is connected with the model training and testing module 4...


PUM


Abstract

The invention provides a time series anomaly detection method for key performance index data, which is used for solving the problems of low time series data anomaly detection efficiency and low accuracy in the prior art. The a time series anomaly detection method comprises the following steps: correcting missing values and abnormal values in acquired time series data; extracting features to splicethe data; dividing the spliced data into a training set and a test set; performing training on the basis of optimizing a target function to obtain an anomaly detection model; performing testing and evaluating to obtain an evaluation standard; and performing time series anomaly detection on the data to be detected according to the evaluation standard and the anomaly detection model. According to the invention, anomaly detection is carried out on different time series data with periodicity; features of different dimensions are extracted from the time series data to ensure that the correlation of the data in different dimensions can be learned by the model, so that the cost caused by abnormal labeling is reduced, and meanwhile, the method is suitable for a scene with extremely non-uniform positive and negative samples, and the detection efficiency is improved.

Description

technical field [0001] The invention belongs to the field of data processing and security, and in particular relates to a timing anomaly detection method and system for key performance index data. Background technique [0002] With the rapid development of data collection and storage technology, a large amount of time series data has been accumulated in the fields of finance, transportation, and the Internet. In order to ensure that various services in the Internet are not disturbed, various key performance indicators (Key Performance Indicators) need to be closely monitored. Indicator, KPI), such as CPU usage, network throughput, page views, number of online users, etc., to prevent negative impacts such as service paralysis caused by untimely detected abnormalities. Such KPIs usually have a certain seasonality, and the samples we identify as abnormal are usually points or segments that do not match the normal period, have large differences, and do not satisfy the seasonalit...

Claims


Application Information

Patent Timeline
IPC IPC(8): G06F11/07
CPCG06F11/0763
Inventor 王晶林友芳万怀宇武志昊韩升董兴业张硕
Owner BEIJING JIAOTONG UNIV
Learn More