Multi-energy park day-ahead economic dispatching method by considering demand response and containing electric vehicles

An electric vehicle, demand response technology, applied in electric vehicle charging technology, energy storage, AC network voltage adjustment and other directions, can solve the problem of new energy consumption that has not been solved.

Inactive Publication Date: 2020-09-01
SICHUAN UNIV
3 Cites 6 Cited by

AI-Extracted Technical Summary

Problems solved by technology

In addition, there is currently no mature and extremely effective method for promoting new energy consumption, and there are few studies on the introduction of electric vehicles into the park as a s...

Method used

[0295] The total cost of park operation in calculation example 3 is 205.98 yuan, and the total cost of calculation example 5 i...

Abstract

The invention discloses a multi-energy park day-ahead economic dispatching method by considering demand response and containing electric vehicles. The method comprises the following steps: firstly, modeling each device in the park according to the determined specific composition of the multi-energy park; then introducing the electric vehicle while considering the demand response; taking the minimum total operating cost of the park as an objective function; considering related constraint conditions; combining a Monte Carlo scene theory; constructing a multi-energy park day-ahead economic dispatch random model by considering the uncertainty of wind power output and photovoltaic output, verifying the contribution advantages of demand response and electric vehicles to multi-energy park economic operation and new energy consumption, and obtaining a multi-energy park day-ahead economic dispatch strategy containing the electric vehicles and by considering the demand response. A demand response mechanism and an electric vehicle are introduced to further improve the new energy consumption capability of the park and enhance the operation economy of the multi-energy park.

Application Domain

Power network operation systems integrationSingle network parallel feeding arrangements +10

Technology Topic

Electric vehicleRandom model +7

Image

  • Multi-energy park day-ahead economic dispatching method by considering demand response and containing electric vehicles
  • Multi-energy park day-ahead economic dispatching method by considering demand response and containing electric vehicles
  • Multi-energy park day-ahead economic dispatching method by considering demand response and containing electric vehicles

Examples

  • Experimental program(1)

Example Embodiment

[0143] In order to describe the technical solutions disclosed in the present invention in detail, the present invention will be further described below with reference to the drawings and specific embodiments.
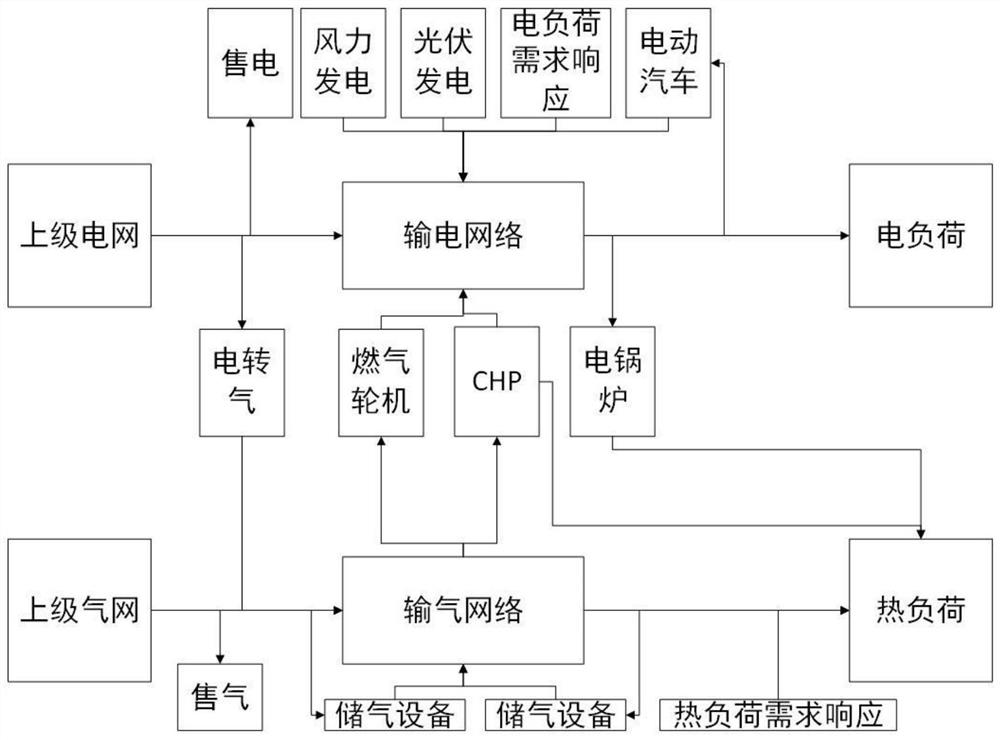
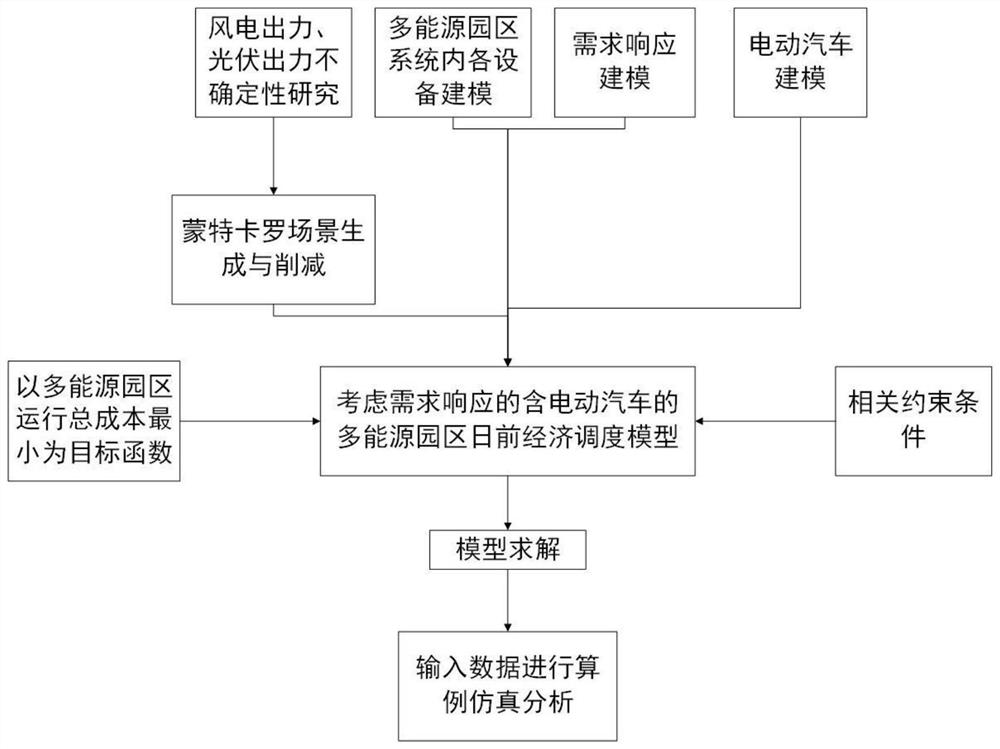
[0144] The invention discloses a day-ahead economic dispatch method for a multi-energy park containing electric vehicles in consideration of demand response. The specific composition of the specific multi-energy park is as follows figure 1 Shown. The specific implementation steps are as follows figure 2 As shown, the technical scheme of the present invention includes the following steps:
[0145] Step 1: Determine the specific composition of the multi-energy park, including the new energy form introduced and the specific equipment composition;
[0146] The multi-energy park contains three energy types: electricity, gas, and heat, so there are:
[0147] (1.1) The new energy forms connected to the multi-energy park are: wind power and photovoltaic power generation;
[0148] (1.2) The energy conversion equipment introduced into the multi-energy park includes: gas turbines, cogeneration units, electricity-to-gas equipment, electric boilers, gas/heat storage equipment and batteries.
[0149] Step 2: Establish models of internal equipment in the multi-energy park, including models of new energy output and various energy conversion equipment models. The equipment in the multi-energy park is an important node for the coordinated conversion of energy and the operation of the park. It is also a physical connection to establish a coupling relationship between various energy sources. The study of the model of each device is the basis for the day-a-day economic dispatch of the multi-energy park.
[0150] (2.1) Wind power output model
[0151] Since the wind power output is approximately proportional to the third power of the wind speed, the wind power output model can be further obtained from the wind speed model. The present invention adopts a combined wind speed model, and uses the wind speed distribution to obey the Weibull distribution to obtain the probability distribution model of wind power output:
[0152]
[0153] In the formula, F(·) represents the probability distribution function of wind power output; p wf Represents wind power output; P(·) represents the probability distribution function; k represents the shape coefficient; c represents the scale parameter of the Weibull distribution; P WF And w r They are the size of the wind power output and the rated capacity of the wind farm, in MW; v in , V r , V out It indicates the wind turbine input, rated, and exit wind speed in turn; p represents the probability.
[0154] (2.2) Photovoltaic output model
[0155] Since the photovoltaic output is restricted by the light intensity r, it is also limited by the battery module area A and the photoelectric conversion efficiency α, combined with the light intensity obeying the Beta distribution, the probability density function of the solar power output can be further obtained:
[0156] P M =rAα
[0157]
[0158] Where P M Is the output power of photovoltaic output; r is the actual illumination in the time period t; A is the area of ​​the battery module; α is the photoelectric conversion efficiency; f(·) represents the photovoltaic output distribution function; τ(·) represents the Beta distribution function; p, q are Beta The shape parameter of the distribution; R M The maximum output power for photovoltaics.
[0159] (2.3) Electric boiler model
[0160] An electric boiler is a device that converts electrical energy into heat through a boiler. Because of its flexible control, easy maintenance and replacement, and high-efficiency storage of thermal energy, it has become more and more widely used in park-type integrated energy systems. Commonly used electric boilers use resistance electric boilers. The present invention utilizes electrothermal conversion efficiency α EB To obtain a simple linear model of the electric boiler, in addition, the output of the electric boiler is limited by the maximum and minimum capacity, and should meet the minimum unit start-up and shutdown time, the cost constraints of unit startup and shutdown, and the up and down ramp rate constraints.
[0161]
[0162]
[0163]
[0164]
[0165]
[0166]
[0167]
[0168]
[0169]
[0170] In the formula, t represents the scheduling time period; t-1 represents the scheduling time period; Respectively represent the thermal power and electric power consumed by the electric boiler during t period; α EB Indicates the efficiency of electrothermal conversion; Respectively represent the cost of starting and shutting down the k-th electric boiler during period t; Indicates the power on and off of the k-th electric boiler in time t, Indicates the on-off status of the k-th electric boiler during t-1 period; Respectively indicate the cost of starting and stopping the electric boiler once; Indicates the thermoelectric conversion rate of the k-th electric boiler; Indicates the power consumption of the k-th electric boiler at time t; Indicates the heat generation power of the k-th electric boiler at time t; Respectively indicate the maximum heat generation power and minimum heat generation power of the k-th electric boiler; Indicates the heat generation power of the k-th electric boiler at time t-1; Respectively represent the up and down ramp rate of the k-th electric boiler; Respectively indicate the successive opening and closing times of the k-th electric boiler in the time period t-1; Respectively represent the shortest startup and shutdown time of the k-th electric boiler in the time period t.
[0171] (2.4) Gas turbine model
[0172] The gas turbine involved in the present invention is mainly a micro gas turbine, an important component of a cogeneration device. Micro gas turbine is a newly developed heat engine in recent years. The working technology adopts radial impeller machinery and regenerative cycle. The working efficiency is higher than that of ordinary gas turbines. It uses natural gas to generate electricity while generating heat. The modeling of a micro gas turbine is similar to that of an ordinary gas turbine, and both can be described by the following model. In addition, the output of gas-fired units is limited by the maximum and minimum capacity, and should meet the minimum unit start-up and shutdown time, the cost constraints of unit startup and shutdown, and the upper and lower ramp rate constraints (similar to electric boilers).
[0173]
[0174]
[0175] In the formula, n represents the nth gas turbine, p n Represents the active power of the gas turbine, G n Indicates the amount of natural gas consumed by the gas turbine; F(·) is the natural gas heat rate curve; SU n Indicates the heat required to start a gas turbine; SD n Represents the heat required for a gas turbine to shut down; HHV represents high calorific value, with a value of 1.026MBtu/Kcf; a n , B n And c n Fit parameters to the cost function of the gas turbine.
[0176] (2.5) Cogeneration unit model
[0177] Micro gas turbine and bromine cooler are the two most critical components of CHP unit. The invention adopts the C65 type micro gas turbine of Capstone Company, ignoring the interference of external environment changes to the unit.
[0178] The mathematical expression of thermoelectric connection is:
[0179]
[0180] In the formula, t represents the scheduling time period; Indicates the heat produced by the CHP unit; Respectively represent the flue gas recovery rate of the p-th bromine cooler, the power generation efficiency and heat dissipation loss rate of the p-th micro-gas turbine in the period t; Is the heat production parameter of the p-th bromine cooler; Represents the power consumption of the p-th micro-gas turbine in the period t.
[0181] CHP unit gas power:
[0182]
[0183] Where Indicates the gas consumption power of the p-th CHP unit in the time period t; Indicates the power consumption of the p-th micro-gas turbine in the period t;
[0184]
[0185]
[0186] In the formula, t represents the scheduling time period; t-1 represents the scheduling time period; Respectively represent the cost of starting and shutting down the p-th CHP unit in time t; Indicates the power on and off of the p-th CHP unit in the t time period, Indicates the power on and off status of the p-th CHP unit during t-1 period, Indicates the power on and off status of the p-th CHP unit during t period, Indicates the power on and off status of the m-th unit at time t; Respectively represent the cost of starting and stopping the CHP unit once.
[0187] (2.6) Electric to gas equipment
[0188] The electricity-to-gas equipment uses electricity-to-gas technology to convert the remaining electric energy into natural gas and inject it into the gas grid or store it in the gas storage equipment, and consume the stored natural gas when the electricity or gas price is high. In an environment where the proportion of new energy sources connected to the grid is increasing year by year, electricity-to-gas equipment has largely met the energy storage needs of the grid, allowing the energy in the system to be stored for a long time on a large scale. The relationship between the gas produced by the electric-to-gas equipment and the electric energy consumed is shown below.
[0189] G m =φ m P m α m /HH V
[0190]
[0191]
[0192] In the formula, t represents the scheduling time period; m is the index of the electric-to-gas equipment; P m Indicates the electric energy required for the operation of the electric-to-gas equipment; G m Indicates the amount of natural gas produced by the electricity-to-gas equipment; φ m Represents the energy conversion coefficient, usually φ m =3.4MBtu/MWh; α m Indicates the working efficiency of the equipment; HHV means high calorific value, the value is 1.026MBtu/Kcf; Represents the natural gas consumption power of the m-th P2G device in the time period t; Represents the power consumption of the m-th P2G device in the time period t; Respectively indicate the minimum stored natural gas power and maximum stored natural gas power of the m-th P2G device; Indicates the conversion efficiency of the m-th P2G device; L HANG Is the low calorific value of natural gas, taken as 9.7kW·h/m 3.
[0193] (2.7) Gas storage/thermal equipment model
[0194]
[0195] In the formula, t represents the scheduling time period; t-1 represents the scheduling time period; S t , S t-1 Respectively indicate the capacity of the heat storage/gas equipment in the t period and t-1 period; W c , W d Respectively represent the energy stored and released by the heat storage/gas equipment; α c , Α d Indicates the efficiency of energy storage and discharge of heat storage/gas equipment respectively; Δt represents the scheduling time interval.
[0196] (2.8) Battery model
[0197] The energy storage of a battery is related to the self-discharge rate and charge-discharge capacity. The remaining battery capacity is calculated as follows:
[0198]
[0199] In the formula, t represents the scheduling time period; t-1 represents the scheduling time period; S Bat,t , S Bat,t-1 Respectively represent the remaining capacity of the battery in the t time period and t-1 time period; σ Bat Indicates the self-discharge rate of the battery; Respectively indicate the charging power and discharging power of the battery in t period; Respectively represent the charging efficiency and discharging efficiency in the t period; Δt represents the scheduling time interval.
[0200] Step 3: Establish a demand response model. Traditional demand response only considers electric load demand response, which is obviously no longer suitable for the demand response mechanism of multi-energy parks. It is necessary to reconsider the demand response model to lay the foundation for promoting the new energy consumption capacity of multi-energy parks.
[0201]
[0202]
[0203]
[0204]
[0205]
[0206]
[0207]
[0208] In the formula, t represents the scheduling time period; N t Represents the entire scheduling time; Represents the demand side response load in time period t; Represents the transferable load in the time period t, a positive value indicates a transferable load, and a negative value indicates a transferable load; Represents the interruptible electric load in time period t; Represents the electrical load in time period t; Represents the electric load after considering the demand response in time period t; Represents the electric load forecast value of time period t; Indicates the maximum electrical load allowed by the system; P inter,max Indicates the maximum interrupt load power allowed in the system scheduling time period; Represents the percentage of the maximum interruptible power load allowed in the period t; Represents the maximum transferable electric load ratio allowed in the time period t.
[0209]
[0210]
[0211] In the formula, t represents the scheduling time period; N t Represents the entire scheduling time; Indicates the predicted value of the heat load in the time period t; Indicates the maximum heat load allowed by the system; Indicates that the heat load value can be responded to; Indicates that the proportion of heat load can be responded to; H DR,max Indicates the maximum interruptible heat load allowed during the park scheduling period.
[0212] Step 4: Build an electric vehicle model. As an emerging technology, electric vehicles have great advantages in terms of controllability and energy storage. However, there are not many studies on the introduction of electric vehicles into multi-energy parks. Therefore, the present invention further explores the consumption of new energy from electric vehicles. And the contribution of the park’s economic operation.
[0213] Think of an electric car as a special battery model:
[0214]
[0215]
[0216]
[0217]
[0218]
[0219]
[0220] In the formula, t represents the scheduling time period; t-1 represents the scheduling time period; S Bat,t , S Bat,t-1 Respectively represent the remaining capacity of the battery in the t time period and t-1 time period; σ Bat Indicates the self-discharge rate of the battery; Respectively indicate the charging power and discharging power of the battery in t period; Respectively represent the charging efficiency and discharging efficiency in the t period; Δt represents the scheduling time interval; Respectively represent the charging and discharging power of the first electric vehicle in the time period t; Respectively represent the charging and discharging state of the electric vehicle connected to the lth charging pile in the time period t; Respectively represent the rated charging and discharging power of electric vehicles; Represents the battery state of charge of the electric vehicle connected to the l-th charging pile during the period t; Represents the battery state of charge of the electric vehicle connected to the lth charging pile in the time period t+1; α ev,c , Α ev,d Indicates the charging and discharging efficiency of electric vehicles respectively; Indicates the battery capacity of electric vehicles; Respectively represent the lower and upper bounds of the state of charge of the electric vehicle battery; Represents the expected battery state of charge when the electric vehicle connected to the lth charging pile leaves, Represents the battery state of charge when the electric vehicle connected to the lth charging pile is away.
[0221] Step 5: Taking the minimum total operating cost of the multi-energy park into consideration while considering the penalty of "abandonment of wind" and "abandonment of light" and load loss compensation as the objective function, considering the constraints of the multi-energy park, establish a multi-energy park with electric vehicles considering demand response. A mixed integer linear programming model for day-ahead economic dispatch of energy parks;
[0222] (5.1) The day-ahead economic dispatch model of the multi-energy park takes the minimum overall operating cost of the park as the objective function. The total operating cost of the park includes power purchase fees, gas purchase fees, and unit startup and shutdown costs, and considers wind and solar consumption and the balance of electricity and heat load Therefore, the penalty fees paid for “abandoning wind” and “abandoning light” and the compensation fees paid for load loss are added to the objective function. At the same time, the income from selling electricity and gas to the grid is added to the objective function. which is:
[0223] among them,
[0224]
[0225]
[0226] C T = U t (1-u t )S t
[0227]
[0228]
[0229]
[0230]
[0231]
[0232]
[0233]
[0234]
[0235] In the formula, t represents the scheduling time period; N t Represents the entire scheduling time; t-1 represents the scheduling time period; Represents the electricity purchase cost in time period t, Represents the gas purchase cost in time period t; Represents the income from electricity sales in time period t, Represents the gas sales revenue at time period t; Respectively represent the unit buying electricity, buying gas, selling electricity, and selling gas prices in time period t; Respectively represent the power of buying electricity, buying gas, selling electricity, and selling gas in time period t; Indicates the cost of wind abandonment and light penalty respectively; Respectively represent the start and stop costs of the CHP unit, Indicate the start and stop cost of electric boiler respectively; Respectively represent penalty costs for power loss and heat load; C T Indicates the start and stop cost of the unit; u t Indicates the start and stop status of the unit; s t Indicates the cost of switching on and off the unit once; Is the unit abandonment penalty price in time period t, N WT Is the number of fans in the park, Is the "abandoned wind" power of the i-th wind turbine in time t, and Δt is the scheduling time interval; Is the penalty price of abandoning light for the unit of time period t, N PV Is the number of photovoltaic cells in the park, Is the "absent light power" of the j-th wind turbine in time t; Is the penalty price of unit power loss load in time period t, Is the power of the power loss load in the period t; Is the penalty price per unit heat loss load for time period t, Is the heat loss load power in time period t; Represents the compensation cost paid to the demand response interruption load; Is the compensation price per unit of interruptible power load in time period t; Is the interruptible electric load power in t period; C ev Dispatch expenses for electric vehicles; The unit price paid to the grid to charge an electric car, The unit price that can be obtained by discharging electric vehicles to sell electricity to the grid; Electric power purchased from the grid to charge electric cars, Discharge the electric power sold to the grid for electric vehicles; N WT , N PV , N CHP , N GT , N P2G , N EB Respectively indicate the number of wind turbines, photovoltaic battery packs, cogeneration units, gas turbines, P2G equipment and electric boilers.
[0236] The operation of a multi-energy park must meet the law of conservation of energy balance, which mainly includes power balance constraints, heat balance constraints, and natural gas balance. The energy input and output of the park and the balance of energy produced and consumed by equipment are mainly considered. In addition, the park system is connected with the upper and lower energy networks, and there are constraints on the power exchange between the upper and lower levels. In addition, due to the capacity limitations of the energy storage equipment in the park, it is also necessary to consider gas and thermal energy storage constraints.
[0237] (5.2) Power balance constraints
[0238]
[0239]
[0240] In the formula, t represents the scheduling time period; Are the output power of the i-th wind turbine and the j-th photovoltaic cell, and the output power of the p-th CHP unit and the n-th gas turbine in the period t; Respectively represent the wind curtailment and photovoltaic power of the i-th wind turbine and the j-th group of photovoltaic cells in the time period t; Respectively represent the power consumption of the t-th P2G device and the power consumption of the t-th electric boiler in the time period t; Indicates the electric load of the park; Indicates the electric load of the park after considering the demand response; Indicates the loss of electrical load in the park; Respectively represent the electric power purchased and sold by the park from the external superior power grid; Respectively represent the charging power and discharging power of the first electric vehicle in the time period t; N WT , N PV , N CHP , N GT , N P2G , N EB Respectively indicate the number of wind turbines, photovoltaic battery packs, cogeneration units, gas turbines, P2G equipment and electric boilers.
[0241] (5.3) Heat balance constraint
[0242]
[0243]
[0244] In the formula, t represents the scheduling time period; Indicates the thermal load of the park after considering the demand response; Indicates that the park demand responds to the heat load; Indicates the loss of heat load in the park; α heat Ratio of heat energy utilization of the heating network; Respectively represent the heat generation power of the p-th CHP unit and the k-th electric boiler in the time period t; Indicates the heat storage/release power of the heat storage device in the time period t, greater than 0 indicates heat storage, and less than 0 indicates heat release; α HS Indicates the heat storage/release efficiency of the heat storage device; Represents the heat storage/release power of the heat storage device; N CHP , N EB Respectively indicate the number of cogeneration units and electric boilers.
[0245] (5.4) Natural gas balance
[0246]
[0247] Where Is the gas production power of the m-th P2G device in the time period t; Represents the natural gas consumption power of the t-th CHP unit and the natural gas consumption power of the t-th gas turbine in the period t; Is the gas storage/discharge power of the gas storage equipment in the time period t, greater than 0 means storing natural gas, and less than 0 means releasing natural gas; α GS Indicates the storage/discharge efficiency of the gas storage device; Respectively indicate the amount of natural gas purchased and sold; N WT , N PV , N CHP , N GT , N P2G , N EB Respectively indicate the number of wind turbines, photovoltaic battery packs, cogeneration units, gas turbines, P2G equipment and electric boilers.
[0248] (5.5) Constraints on power exchange between the park and the external superior network
[0249]
[0250]
[0251]
[0252]
[0253] Where Respectively represent the power of buying electricity, buying gas, selling electricity, and selling gas in time period t; P in,min , P in ,max Respectively represent the minimum and maximum purchase power; P out,min , P out,max Respectively the minimum and maximum selling power; G in,min , G in,max Respectively indicate the lowest and highest gas purchase power; G out,min , G out,max Respectively indicate the minimum and maximum gas selling power.
[0254] (5.6) Gas and thermal energy storage constraints
[0255]
[0256]
[0257]
[0258]
[0259]
[0260]
[0261] In the formula, t represents the scheduling time period; t-1 represents the scheduling time period; Indicates the gas storage/discharge power in time period t, a value greater than 0 indicates natural gas storage, and a value less than 0 indicates natural gas release; G GS,min , G GS,max Respectively represent the minimum storage/release power of natural gas and the maximum storage/release power of natural gas of the gas storage device in time period t; Is the gas output of the gas storage equipment in the time period t; S GS,min , S GS,max Respectively indicate the minimum and maximum gas output of the gas storage device; Is the gas output of the gas storage equipment in the time period t-1; α SGS Indicates the self-consumption rate of gas storage equipment; Is the heat storage in time period t; Is the heat storage in time period t-1; S HS,min , S HS,max Respectively indicate the minimum and maximum gas storage capacity of the heat storage device; α SHS Is the self-consumption rate of heat storage equipment; Indicates the heat storage/discharge power of the heat storage equipment in the time period t; H HS,min , H HS,max They respectively represent the minimum and maximum heat storage/release power of heat storage equipment; Δt represents the scheduling time interval.
[0262] Step 6: Using Monte Carlo scenario theory to process the uncertainty of wind power output and photovoltaic output, after scenario generation and reduction, wind power output scenarios and photovoltaic output scenarios that meet the characteristics of new energy output in the multi-energy park are obtained. The new energy output in the new energy park has strong uncertainty. Ignoring this uncertainty to model will make the final result seriously inconsistent with the actual situation, which is not conducive to the operation and development of the multi-energy park.
[0263] (6.1) Scene generation
[0264] The basic idea is to conduct Monte Carlo sampling of the original wind power output and photovoltaic output data (Monte Carlo sampling can generate a random sequence with uniform probability to sample the probability distribution close to the original data) to obtain the output scene, the output scene is represented by s, and The probability that each scene will occur is assigned to the scene as a weight. Scene generation can be obtained through inverse transformation sampling such as output probability distribution function, output prediction error distribution function, and Markov chain. Regardless of wind power output and photovoltaic output errors, the scenario generation method based on the probability distribution of wind power/photovoltaic output is adopted. The specific steps are as follows:
[0265] (6.1.1) According to the existing new energy output data, assume that the future new energy output conforms to the normal distribution, and further assume that the average actual output is used as the predicted output, and 20% of the predicted output is taken as the standard deviation of the normal distribution;
[0266] (6.1.2) Use the Norrmnd function in Matlab to generate normal distribution random numbers that conform to the new energy output. These random numbers can represent the scenarios of the new energy output probability distribution and ensure that the probability of each scenario is 0.1%.
[0267] (6.2) Scene reduction
[0268] Too many scenes generated will cause two problems that will affect the research progress: one is that the number of generated scenes is large, which makes the subsequent calculation cost larger; the other is that in all the scenes, it is impossible to ensure that every scene is generated. The probability characteristics are in line with the initial probability characteristics of new energy output. Therefore, it is necessary to reduce the large number of scenes generated. The essence of scene reduction is to reduce a large number of scenes to a few scenes that conform to the initial probability distribution to the greatest extent through a certain reduction algorithm. The number of specific final scenes is determined according to the actual calculation example, considering the calculation amount and the accuracy of the result.
[0269] At present, the most commonly used methods for scene reduction are backward back generation elimination and fast previous generation elimination. The present invention uses the backward back generation elimination method to reduce the generated 1000 scenes to four. The main steps are as follows:
[0270] (6.2.1) Determine the initial scene and set it to s, then calculate the distance from s to each of the remaining scenes, find the scene s1 with the smallest distance from s, and delete s1;
[0271] (6.2.2) Find the closest scene to scene s1 in the undeleted scene set, record it as s2, and assign the probability of scene s1 to s2;
[0272] (6.2.3) Repeat the above steps, deleting one scene at a time, until the final number of scenes meets the requirements.
[0273] Step 7: Input the energy access of the multi-energy park, new energy output data, various equipment parameters, operating parameters, etc., and use the commercial solver Gurobi to solve the day-a-day economic dispatch model of the multi-energy park with electric vehicles in consideration of demand response. Results of economic dispatch of energy parks.
[0274] The effects of the present invention will be described in detail below through specific embodiments.
[0275] (1) Introduction to calculation examples
[0276] The multi-energy park system considering the consumption of new energy is composed of gas turbine, fan, CHP unit, electric boiler, P2G device, 1 heat storage device, 1 gas storage device and 1 set of photovoltaic cells. The cost of starting and stopping the gas turbine, electric boiler, and CHP unit is 3.5, 2.74, and 1.94 yuan respectively; the heat production parameters and flue gas recovery rate of the bromine cooler are 0.9 and 1.2 respectively.
[0277] Assuming that the initial state of the CHP unit and gas turbine is in the shutdown state, the self-consumption rate of the gas storage/heating equipment is 0.01; the state of the electric boiler is set to the half-full state; the initial natural gas storage capacity of the gas storage device is 10m 3 , The initial heat storage of the heat storage device is 100kW·h.
[0278] The number of scheduling time periods used in this example is N t = 24, the unit scheduling time is Δt = 1h, and the power of each device in the unit scheduling time period remains constant. In addition, the calculation example adopts the time-of-use electricity price, the penalty price for load loss is 100 times the electricity price, and the penalty for abandoning wind and light is 0.1 yuan/(kW·h). The relevant data of electric vehicles are as follows:
[0279] Table 1 Related parameters of electric vehicles
[0280]
[0281] (2) Example scenario description
[0282] (2.1) In order to verify the advantages of demand response to the park's new energy consumption and dispatch, four operation modes are set that do not consider demand response, only consider electric load demand response, consider electric/heat load demand response, and consider demand response doubling. Setting examples 1-4 are shown in Table 1 below:
[0283] Table 2 Example 1-4 Demand response ratio
[0284]
[0285] (2.2) Based on the operation of Example 3, the electric vehicle is introduced as Example 5.
[0286] (3) Example result analysis
[0287] (3.1) Analysis of results of calculation examples 1-4
[0288] Table 3 Example 1-4 Total operating cost of the park (unit: yuan)
[0289]
[0290] It can be seen from Table 3 that after considering the demand response, the power outage load compensation fee appeared in the park, but the total operating cost of the park did not increase due to the power outage load compensation fee. Calculation example 2 only considers the response of the electric load demand. During the peak electricity price and normal times, according to the overall operation of the park system, the output can be converted to respond to the electric load to reduce the power supply cost during peak hours. Calculation example 3 considers the response to the thermal load on the basis of calculation example 2. When the electricity price is high, the connection of the thermal load can be reduced, which can appropriately reduce the power supply cost of the park. At the same time, during the low electricity price period, consider the increase of heat load to the park. Transfer, this can reduce heating costs as a whole. Example 4 As the demand response is doubled, the response load of the system increases correspondingly, the flexibility of the park system scheduling is improved, and the utilization of various energy in the park is more complementary and coordinated, which further reduces the total operating cost of the park. Therefore, when the day-ahead economic dispatch operation of a multi-energy park considers demand response, the park system’s scheduling flexibility will increase. The more demand response, the higher the system flexibility, the faster the conversion between new energy sources, and the promotion of new energy consumption while reducing The total operating cost of the park.
[0291] (3.2) Analysis of results of example 5
[0292] Table 4 Example 5 Total operating cost of the park (unit: yuan)
[0293]
[0294]
[0295] In Example 3, the total operating cost of the park is 205.98 yuan, and the total cost of Example 5 is 115.83. Therefore, the introduction of electric vehicles to the park can further reduce the total operating cost of the park.
[0296] image 3 with Figure 4 The output of the multi-energy park under the operation modes of Example 3 and Example 5 are respectively given. It is obvious that after the introduction of electric vehicles, the output of wind power and photovoltaic power has increased. Figure 5 The curves of “heat production by electric boiler”, “heat production by CHP” and “heat load” under the operating conditions of example 5 are given. It can be seen that the controllability and energy storage performance of electric vehicles are superior, which can make the park load characteristics. It is more in line with the new energy output curve, thereby increasing the grid connection of new energy, improving the utilization efficiency of new energy, reducing the electricity purchase cost in the park, increasing the flexibility of energy storage, promoting the coordination of various energy sources, and reducing the load peak-valley difference. As a result, the flexibility of the park's scheduling is enhanced, the new energy consumption capacity is higher, and the park's economic operation is better.
[0297] The above are only specific embodiments of the present invention, but do not limit the scope of the patent protection of the present invention. Any equivalent changes or substitutions made using the description of the present invention and the accompanying drawings are directly or indirectly applied to other related technologies. All fields should be included in the protection scope of the present invention.

PUM

no PUM

Description & Claims & Application Information

We can also present the details of the Description, Claims and Application information to help users get a comprehensive understanding of the technical details of the patent, such as background art, summary of invention, brief description of drawings, description of embodiments, and other original content. On the other hand, users can also determine the specific scope of protection of the technology through the list of claims; as well as understand the changes in the life cycle of the technology with the presentation of the patent timeline. Login to view more.
Why Eureka
Try Eureka