Inspection method for determining oral cavity index
An inspection method and intraoral technology, applied in the field of inspection for determining intraoral indicators, can solve problems such as hindering the choice of gum care and reducing the motivation of gum care.
- Summary
- Abstract
- Description
- Claims
- Application Information
AI Technical Summary
Problems solved by technology
Method used
Image
Examples
reference example 1
[0115] (Reference Example 1: Imaging of gingival collagen)
[0116] Ultrasound images were acquired using DermaLab at multiple locations on the gingiva of guinea pigs. Thereafter, the site was sliced, Masson's trichrome staining (Sigma-Aldrich) was applied to stain collagen, and only the blue portion was extracted from the stained image to obtain a binarized image A. The ultrasonic image and image A were divided into grids of 50 μm square, and the average brightness of each grid was calculated for all the grids of the two images.
[0117]According to the position of the epithelium and muscle, the ultrasonic image and the corresponding grid in image A are determined, and the correlation between the average brightness in the ultrasonic image corresponding to the grid and the average brightness in image A is analyzed. As a result, it was found that the average brightness in the ultrasonic image and image A are significantly correlated when the risk rate (significance level) is l...
Embodiment 1 and comparative example 1
[0118] (Example 1 and Comparative Example 1: Correlation between the age group of the test subject and the average brightness of the ultrasonic image (determination of gingival age))
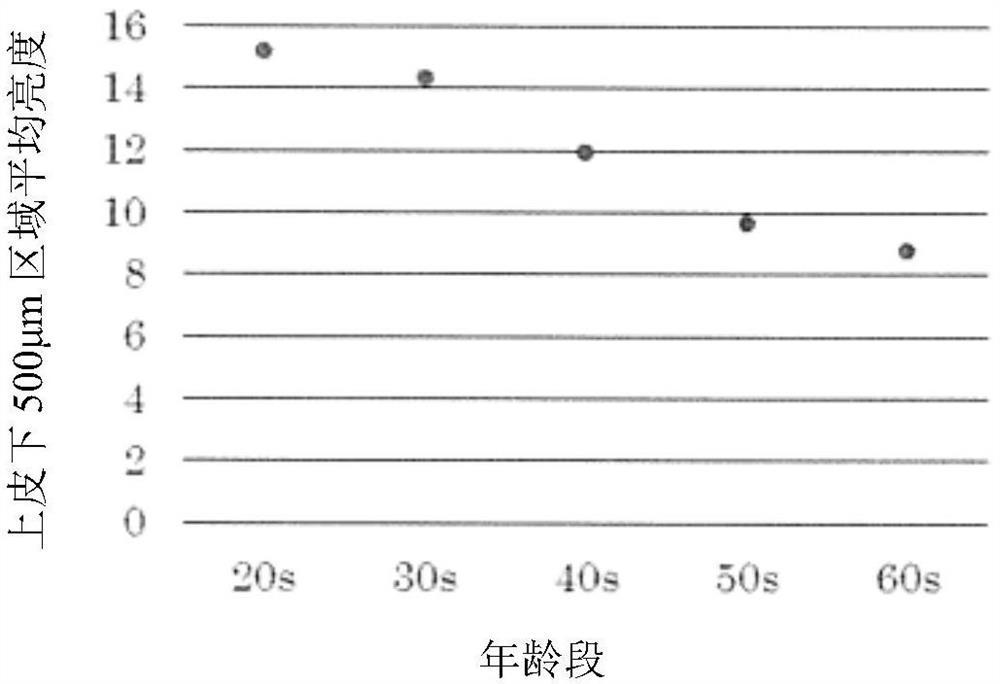
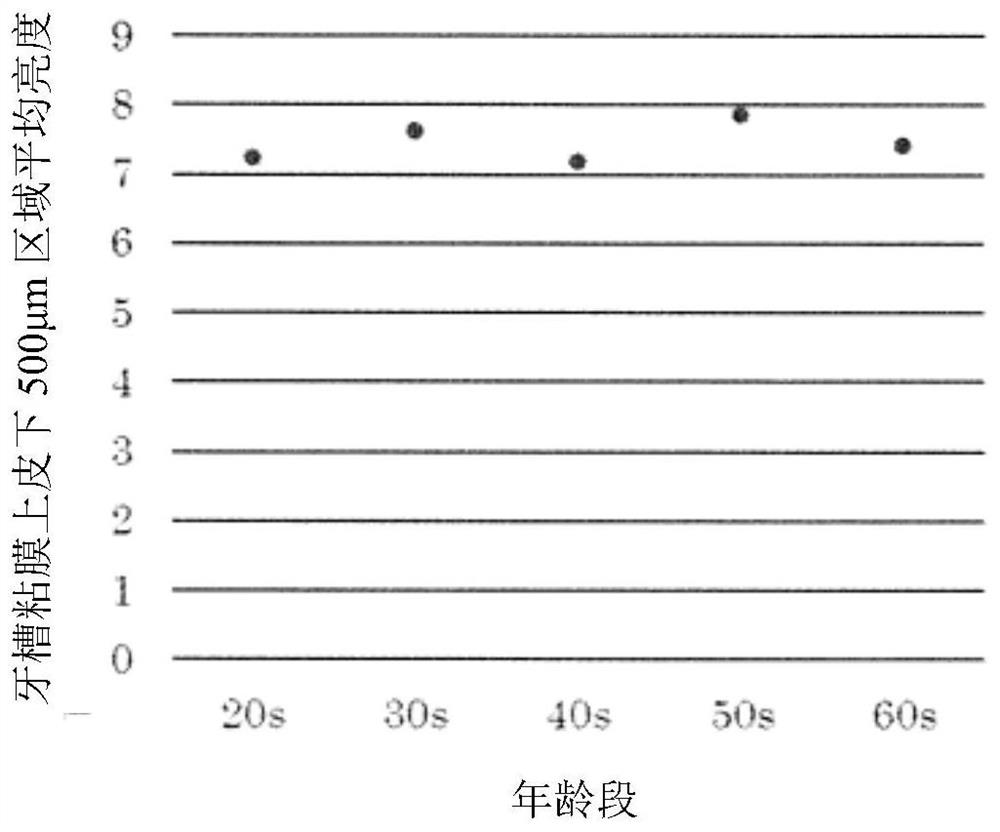
[0119] Ultrasonic images of the gums were obtained from 109 men and women aged 24 to 64, and the average brightness of the connective tissue was calculated by further image analysis.
[0120] Photography of gingival ultrasound images was performed as follows. A probe dripped with edible gel is placed on the attached gingival area about 3 mm from the gingival edge of the interdental papilla on the left and right of the upper jaw, or on the attached gingival area. The alveolar mucosa area above the gingiva-alveolar mucosa boundary about 1 cm upward emits 20 MHz ultrasonic waves and receives reflected waves at the same time. This reflected wave is visualized by a computer and saved as an ultrasound image. This image was analyzed using common image analysis software (ImageJ (National Institutes of...
Embodiment 2
[0124] (Example 2: Correlation between the age group and smoking history of the subject and the average brightness of the ultrasonic image (judgment of the health status of the gums))
[0125] 44 males aged 50 to 64 were surveyed by questionnaire and divided into 2 groups according to their smoking history. In addition, 16 people had a history of smoking and 28 people had no history of smoking. The mean ages of the two groups of subjects were: smoking history 53.2 years old, non-smoking history 53.5 years old, almost the same.
[0126] For each test subject, the average brightness of all 27 measurement sites was calculated for the range from immediately below the gingival epithelium to 500 μm below the epithelium by the method of Example 1. The average value of the average brightness of the subjects of the smoking history group was 9.0, and the average value of the average brightness of the subjects of the non-smoking history group was 10.0.
[0127] In addition, in this ana...
PUM
| Property | Measurement | Unit |
|---|---|---|
| Diameter | aaaaa | aaaaa |
| Diameter | aaaaa | aaaaa |
Abstract
Description
Claims
Application Information
 - R&D
- Intellectual Property
- Life Sciences
- Materials
- Tech Scout
- Unparalleled Data Quality
- Higher Quality Content
- 60% Fewer Hallucinations
Browse by: Latest US Patents, China's latest patents, Technical Efficacy Thesaurus, Application Domain, Technology Topic, Popular Technical Reports.
© 2025 PatSnap. All rights reserved.Legal|Privacy policy|Modern Slavery Act Transparency Statement|Sitemap|About US| Contact US: help@patsnap.com


