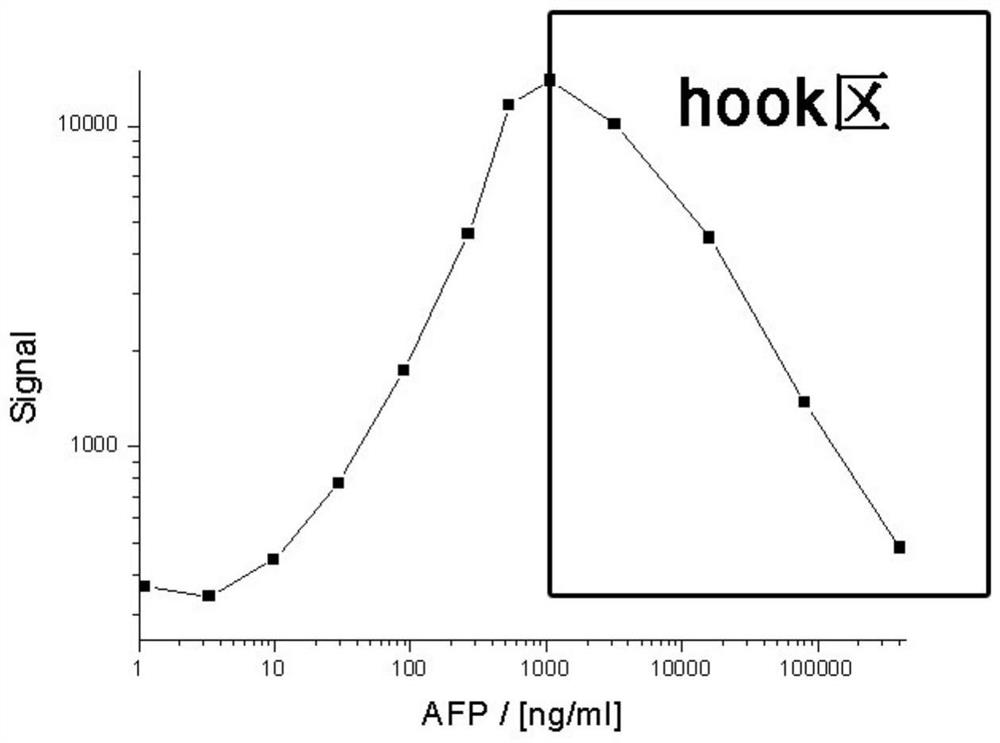
A Method for Judging Hook Effect in Homogeneous Time-Resolved Fluorescence Immunoassay
A technology of time-resolved fluorescence and hook effect, applied in the direction of material analysis, analysis of materials, fluorescence/phosphorescence, etc. by optical means, it can solve the problems of affecting detection throughput, increase cost, consumption, etc., and achieve high detection throughput. Effect
- Summary
- Abstract
- Description
- Claims
- Application Information
AI Technical Summary
Problems solved by technology
Method used
Image
Examples
Embodiment 1
[0042] Example 1: Hook effect assay for AFP assay
[0043] 2.3 Generate Calibration Curve
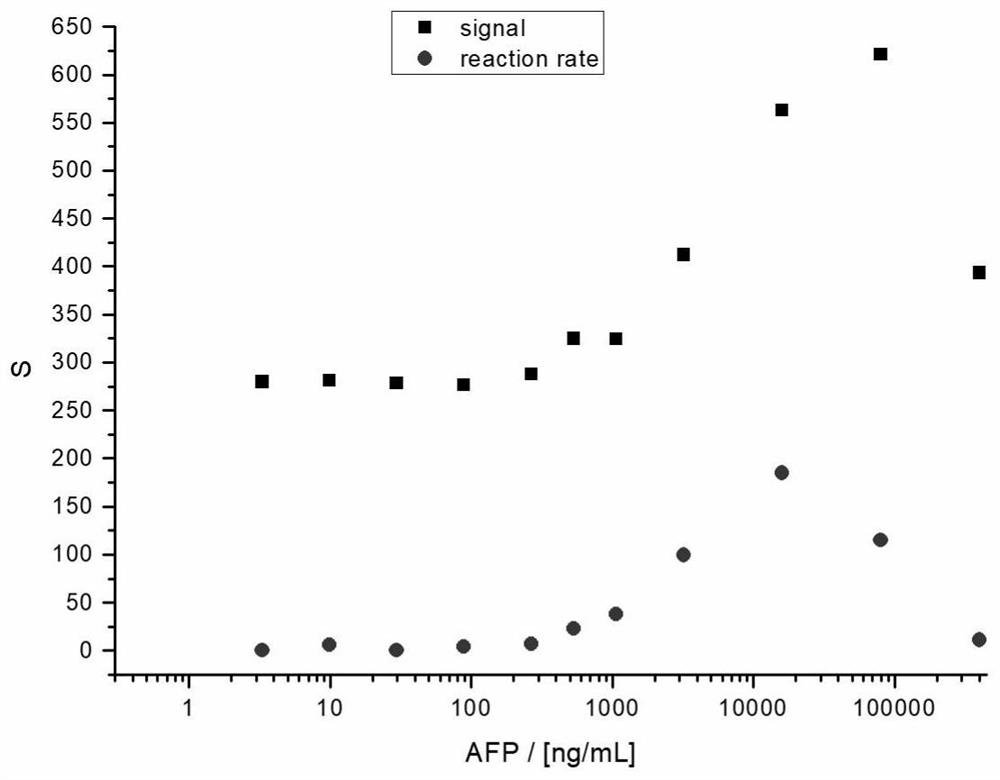
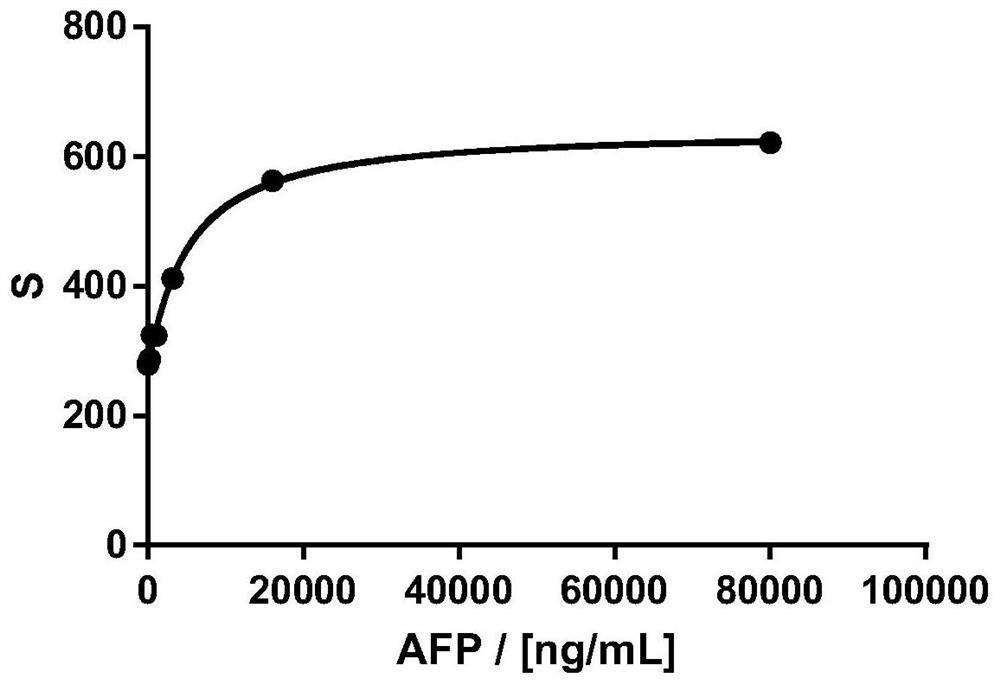
[0044] Detect the signal absolute value of a series of known concentration samples, and use the relationship between the measured signal absolute value and rate value and concentration to establish two calibration curves, within the range of positive correlation between concentration and signal (see figure 2 ), using four parameters for fitting to generate a calibration curve, the fitting curve of the relationship between the absolute value of the signal and the concentration is shown in image 3 , the fitting curve between the rate value and the concentration is shown in Figure 4 .
[0045] 2.4 Calculate the concentration of unknown samples using the calibration curve
[0046] Using the fitted four-parameter curve equation, the concentration value of the unknown sample can be calculated, and using two curves, two concentration values can be calculated.
[0047] Concentr...
Embodiment 2
[0053] Example 2: Hook effect detection for AFP assays across different systems
[0054] 2.3 Generate Calibration Curve
[0055] The signal value and rate value measured between different systems (instruments) are different, Figure 5 Shows the systematic deviation of signal values between the two instruments. Compared with Example 1, Example 2 introduces the 665 / 620nm measurement ratio of the blank sample as the background value, and the measurement system deviation of the calibration signal between different systems (instruments), the calculation method is as follows: divide the signal absolute value and the rate value With the background value, the relative signal absolute value (RS, relative signal) and the relative rate value (RRR, relative reaction rate) were respectively obtained. Under the same incubation conditions, the RS and RRR curves are only related to the degree of immune response, and have nothing to do with the deviation of the measurement system. Using th...
PUM
 Abstract
Description
Claims
Application Information
 - R&D
- Intellectual Property
- Life Sciences
- Materials
- Tech Scout
- Unparalleled Data Quality
- Higher Quality Content
- 60% Fewer Hallucinations
Browse by: Latest US Patents, China's latest patents, Technical Efficacy Thesaurus, Application Domain, Technology Topic, Popular Technical Reports.
© 2025 PatSnap. All rights reserved.Legal|Privacy policy|Modern Slavery Act Transparency Statement|Sitemap|About US| Contact US: help@patsnap.com


