Method and device for generating inspection error spatial distribution diagram of ocean satellite data

A technology of spatial distribution map and satellite data, which is applied in the directions of still image data retrieval, digital data information retrieval, image data processing, etc., can solve problems such as the inability to visually display and accurately display the spatial distribution of inspection errors, so as to improve the visualization effect and improve Demonstrates the effect of accuracy, shortening auto-generation time

Pending Publication Date: 2021-04-06
深圳航天宏图信息技术有限公司
View PDF0 Cites 2 Cited by
  • Summary
  • Abstract
  • Description
  • Claims
  • Application Information

AI Technical Summary

Problems solved by technology

[0003] The purpose of the embodiments of the present application is to provide a method and device for generating a spatial distribution map of inspection errors of marine satellite data, which can accurately calculate and display the inspection errors

Method used


Image

  • Method and device for generating inspection error spatial distribution diagram of ocean satellite data
  • Method and device for generating inspection error spatial distribution diagram of ocean satellite data
  • Method and device for generating inspection error spatial distribution diagram of ocean satellite data

Examples


Embodiment 1

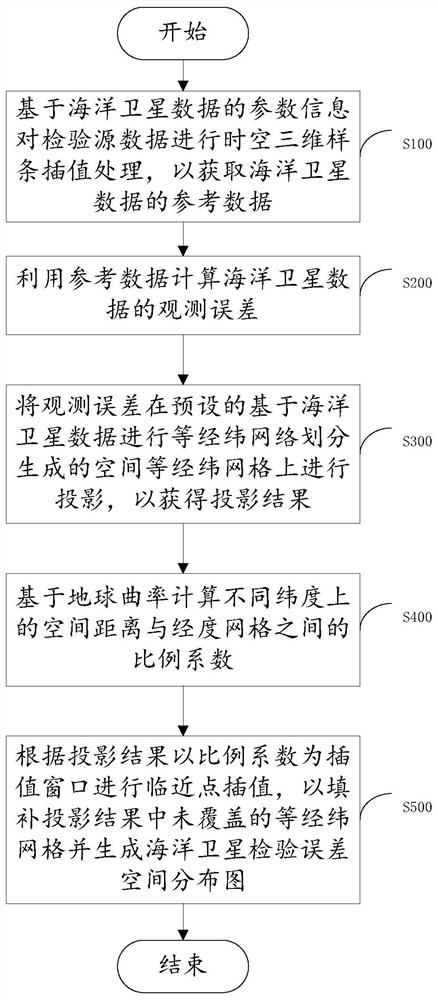
[0064] Please see figure 1 , figure 1 It is a flow chart of a method for generating a spatial distribution map of inspection errors of marine satellite data provided by an embodiment of the present application. This method is used to automatically generate a spatial distribution map of inspection errors, which specifically includes the following steps:

[0065] Step S100: Perform spatio-temporal three-dimensional spline interpolation processing on the inspection source data based on the parameter information of the ocean satellite data, so as to obtain reference data of the ocean satellite data;

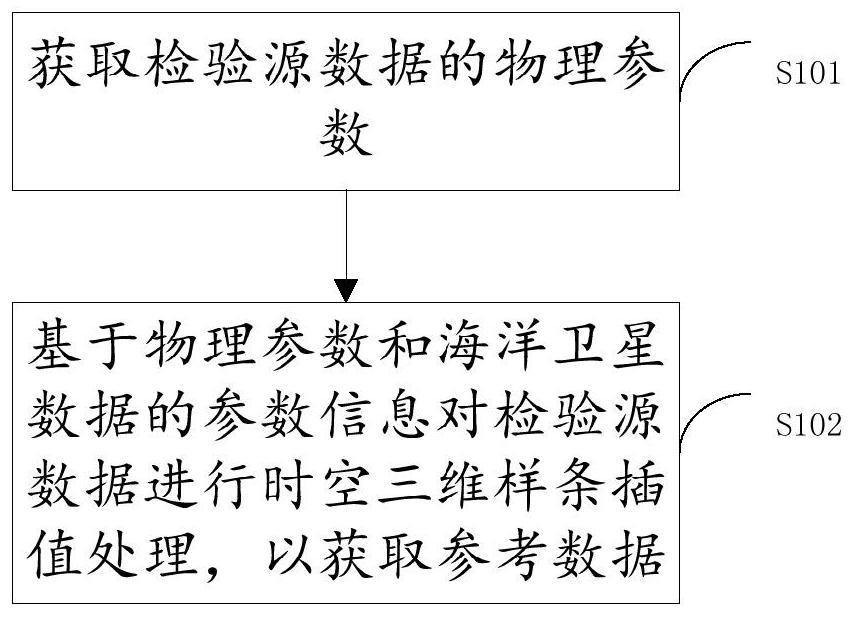
[0066] Specifically, such as figure 2 As shown, it is a flow chart of reference data acquisition, and this step may specifically include:

[0067] Step S101: Obtain physical parameters of the inspection source data;

[0068] Step S102: Perform spatio-temporal three-dimensional spline interpolation processing on the inspection source data based on the physical parameters and para...

Embodiment 2

[0101] The embodiment of the present application provides a device for generating a spatial distribution map of inspection errors of marine satellite data, which is applied to the method for generating a spatial distribution map of inspection errors of marine satellite data in Embodiment 1, such as Figure 6 As shown, it is a structural block diagram of a device for generating a verification error spatial distribution map of marine satellite data, and the device includes:

[0102] The reference data acquisition module 100 is used to perform spatio-temporal three-dimensional spline interpolation processing on the inspection source data based on the parameter information of the marine satellite data, so as to obtain the reference data of the marine satellite data;

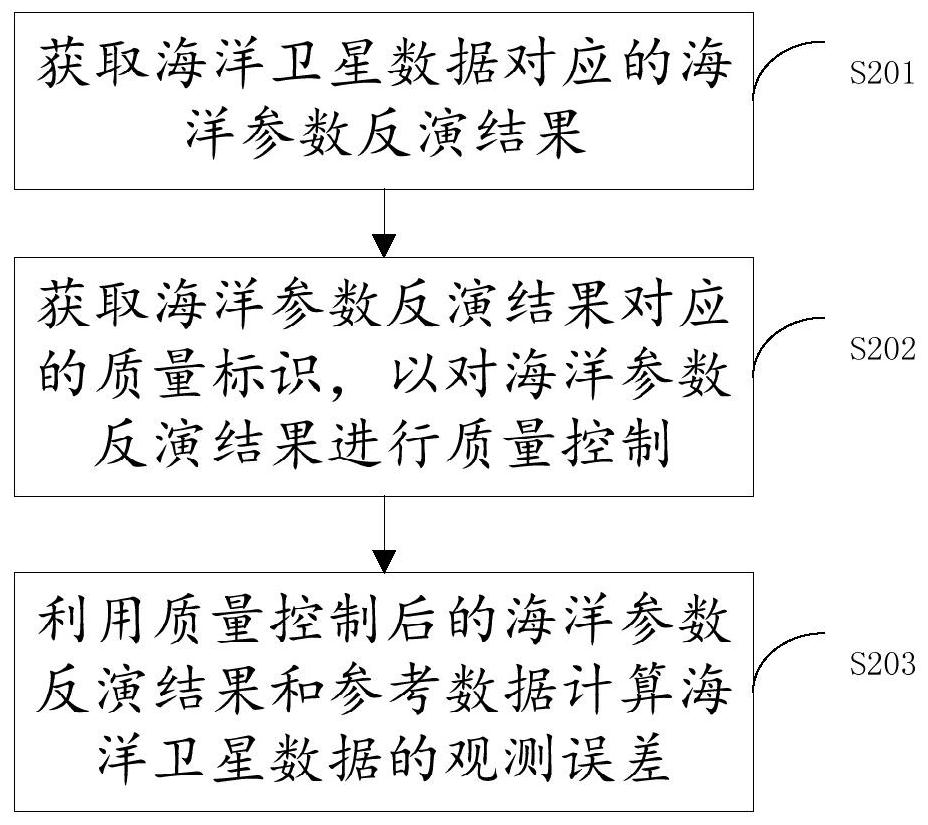
[0103] An error calculation module 200, configured to use the reference data to calculate the observation error of the ocean satellite data;

[0104] The projection module 300 is configured to project the observation...


PUM


Abstract

The embodiment of the invention provides a method and device for generating an inspection error spatial distribution diagram of ocean satellite data, and relates to the technical field of ocean engineering. The method comprises the following steps: performing space-time three-dimensional spline interpolation on inspection source data based on parameter information of marine satellite data to obtain reference data of the marine satellite data; calculating an observation error of the marine satellite data by utilizing the reference data; projecting the observation error on a preset space equal longitude and latitude grid generated by performing equal longitude and latitude network division based on ocean satellite data to obtain a projection result; calculating proportionality coefficients between the spatial distances on different latitudes and the longitude grids based on the earth curvature; and performing adjacent point interpolation by taking the proportionality coefficient as an interpolation window according to the projection result so as to fill the uncovered equal longitude and latitude grids in the projection result and generate a marine satellite inspection error spatial distribution map. Thus, the problem that the existing method cannot visually and accurately display the spatial distribution of the inspection error is solved.

Description

technical field [0001] The present application relates to the technical field of marine engineering, in particular to a method and device for generating a spatial distribution map of inspection errors of marine satellite data. Background technique [0002] With the rapid development of aerospace technology, remote sensing technology and computer technology, ocean satellite remote sensing is in a new stage of updating and rapid development. Ocean satellites have the characteristics of large-scale and high-precision global ocean observation. Its application fields include marine ecological environment monitoring, marine dynamic environment forecasting, marine disaster prevention and mitigation, and marine rights and interests maintenance. The accuracy of marine satellite products is the basis of marine satellite remote sensing applications. Good product quality directly determines the effect of data application, but existing methods cannot visually display and accurately displ...

Claims


Application Information

Patent Timeline
IPC IPC(8): G06F16/587G06F16/54G06T17/05G06T17/20
CPCG06F16/587G06F16/54G06T17/05G06T17/20
Inventor 殷晓斌鲍青柳王宇翔闫军朝毕郁盼
Owner 深圳航天宏图信息技术有限公司
Why Eureka
Try Eureka