

Single-frame differential phase contrast quantitative phase imaging method based on color multiplexing illumination
An imaging method and frame difference technology, which is applied in image enhancement, image analysis, image data processing, etc., can solve the problems of missing frequency information and slow imaging speed, and achieve quality improvement, fast imaging speed, and high stability quantitative phase imaging Effect
- Summary
- Abstract
- Description
- Claims
- Application Information
AI Technical Summary
Problems solved by technology
Method used
Image

Examples
Embodiment Construction
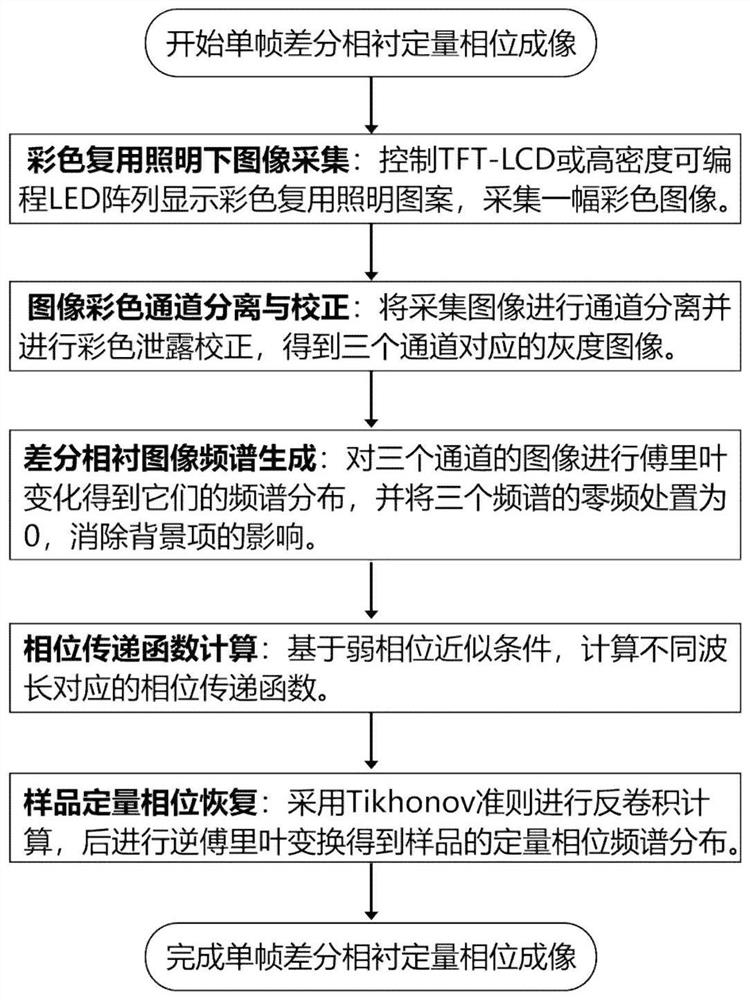
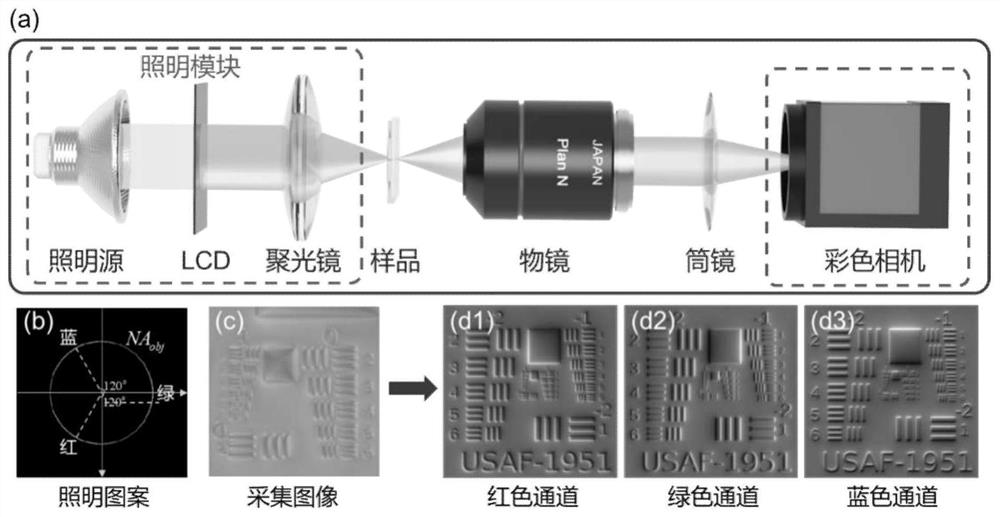
[0019] The experimental platform of the differential phase contrast quantitative phase microscopy imaging method based on color multiplexing illumination can be built based on any commercial microscope system, only need to add a light source modulation module color LCD display lighting or programmable color LED in the optical path array. Taking the differential phase contrast imaging system based on LCD display illumination as an example, the schematic diagram of the microscope system is as follows: figure 2 As shown in (a), it includes a color multiplexing light source module (mercury lamp, LCD, and condenser), sample, microscope objective lens (achromatic objective lens), tube lens, and color camera. The color multiplexing light source module can adopt two structures. The first one is to use the light source, LCD display screen and condenser mirror that come with the microscope as the lighting module. The function of the LCD is to modulate the light source so that the light...
PUM
 Abstract
Description
Claims
Application Information