Surface wave spectrum analysis method for earthquake forecast

A spectrum analysis and surface wave technology, applied in the field of surface wave spectrum analysis of earthquake prediction, can solve the problem of insufficient earthquake prediction accuracy, and achieve the effect of clear indicators and results

Pending Publication Date: 2021-07-16
李智
View PDF7 Cites 1 Cited by
  • Summary
  • Abstract
  • Description
  • Claims
  • Application Information

AI Technical Summary

Problems solved by technology

[0008] Aiming at the deficiencies in the prior art, the present invention provides a surface wave spectrum analysis method for earthquake prediction, which has the advantages of being able to make relatively accurate quiet period prediction, small earthquake prediction and moderate-strong earthquake prediction according to physical phenomena, and solves the current earthquake The problem of insufficient prediction accuracy

Method used


Image

  • Surface wave spectrum analysis method for earthquake forecast
  • Surface wave spectrum analysis method for earthquake forecast
  • Surface wave spectrum analysis method for earthquake forecast

Examples


Embodiment 1

[0064] Example 1: Calm Period Forecast

[0065] 1. The earthquakes used in the analysis are shown in Table 1.

[0066] date Longitude (East) Latitude (North Latitude) magnitude Reference location 2016-04-15 130.81 32.68 4.9 Kyushu, Japan

[0067] Table 1 The catalog of earthquakes used as the source of Example 1

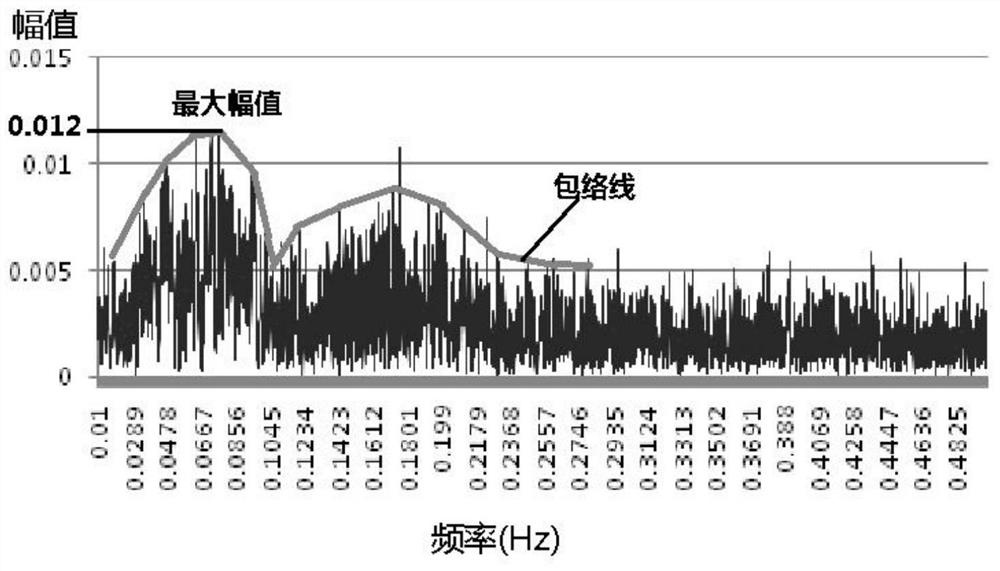
[0068] 2. For the frequency spectrum of each station, see Figure 4-7 , the left side is north-south, and the right side is east-west. The maximum amplitude after the two components are synthesized is shown in Table 2. The maximum amplitude of each station did not exceed the warning amplitude. Therefore, it was not observed in the Liaoning area on April 15, 2016. Regarding the phenomenon of stress concentration, referring to previous earthquake cases, it is conservatively estimated that there will be no earthquakes above M4.0 in the Liaoning area within the next 5 days, and there will be no earthquakes above M5.0 within 20 days.

[0...

Embodiment 2

[0073] Example Two: Small Earthquake Forecast

[0074] 1. The earthquakes used in the analysis are shown in Table 3. The location and magnitude of the earthquakes in Table 3 and Table 1 are not much different, so the same warning amplitude can still be used approximately.

[0075] date Longitude (East) Latitude (North Latitude) magnitude Reference location 2015-11-18 129.05 31.33 5.1 Japan

[0076] Table 3 is as the earthquake catalog of embodiment two seismic sources

[0077] 2. For the frequency spectrum of each station, see Figure 8-11 , the left side is north-south direction, and the right side is east-west direction. The maximum amplitude after the two components are synthesized is shown in Table 4. The maximum amplitude of Chaoyangyang and Longshoushan platforms exceeds the average value, but not the warning amplitude. It can be considered that the stress accumulation is not enough. Many, can not be counted as the source area, Benxi stat...

Embodiment 3

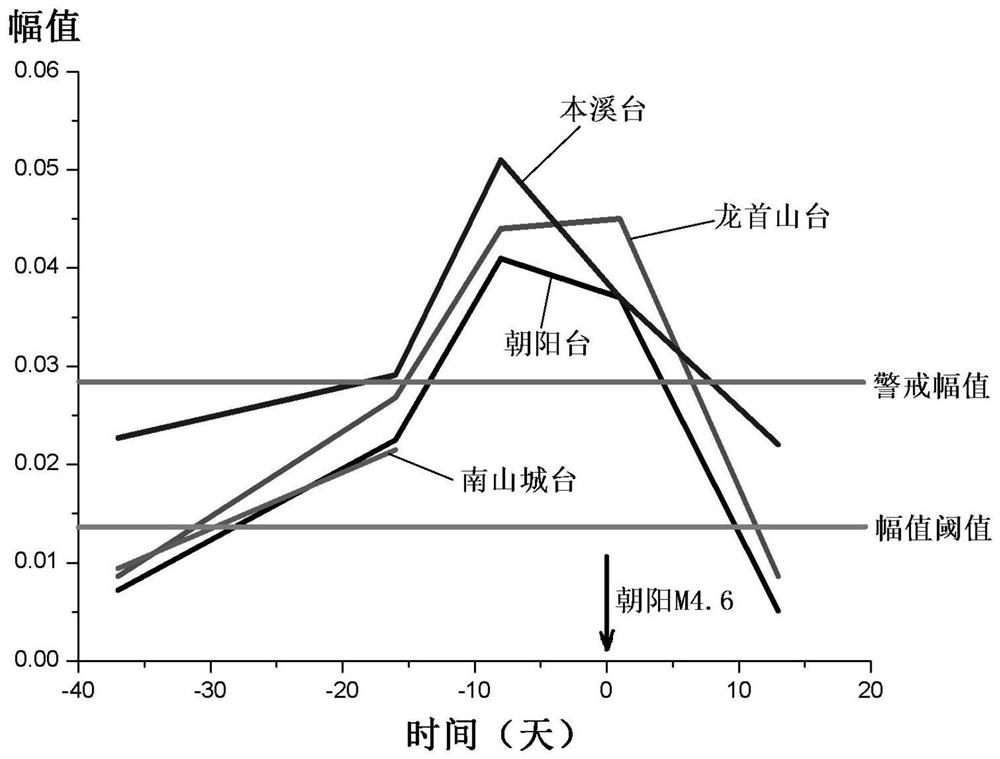
[0082] Example 3: Forecast of Moderate and Strong Earthquakes

[0083] 1. The earthquakes used in the analysis are shown in Table 5. The location and magnitude of the earthquakes in Table 5 and Tables 1 and 3 are not much different, so the same warning amplitude can still be used approximately.

[0084] date Longitude (East) Latitude (North Latitude) magnitude Reference location 2016-04-15 130.81 32.68 4.9 Kyushu, Japan 2016-05-06 129.30 31.11 4.9 Japan 2016-05-14 129.28 31.10 4.9 Japan 2016-05-23 129.25 31.18 4.8 Japan 2016-06-04 128.87 31.84 4.8 Japan

[0085] Table 5 is the catalog of earthquakes used as the source of Example 3

[0086] 2. For the frequency spectrum of each station, see Figure 12-24 , the left side is north-south direction, and the right side is east-west direction. See Table 6, Table 7, Table 8, and Table 9 for the maximum amplitude after the two components are synthesized.

[0087] I, J...


PUM


Abstract

The invention discloses a surface wave spectrum analysis method for earthquake forecast, which relates to the technical field of earthquake prevention and disaster reduction. The method comprises the following steps of carrying out data partitioning and screening, carrying out partitioning, classification and data preprocessing on an occurred earthquake according to earthquake magnitude, epicentral distance from a station, earthquake source depth, earthquake structure type, earthquake source fracture process and the like provided by an earthquake catalog, carrying out second-level resampling on earthquake waveform data according to a Nyquist law. According to the second sampling data, transverse waves and longitudinal waves with relatively high frequency can be lost, and surface waves with relatively low frequency can be restored, so that only waveforms with a period of more than 2 seconds are restored, abnormal amplitudes are determined, an amplitude threshold value and a warning amplitude value are obtained through historical earthquake examples, and the maximum amplitude value is compared with the warning amplitude value. According to calm period forecasting, the phenomenon of underground stress concentration is not observed, earthquakes of M4.0 or above do not occur in a period of time in the future, and various earthquake rumors can be effectively eliminated.

Description

technical field [0001] The invention relates to the technical field of earthquake prevention and disaster reduction, in particular to a surface wave spectrum analysis method for earthquake prediction. Background technique [0002] According to the time course of earthquake gestation, it is mainly divided into four stages: long-term forecast, medium-term forecast, short-term forecast, and impending earthquake forecast. At present, there are many kinds of theoretical methods for earthquake prediction. [0003] Long-term earthquake prediction mainly predicts the risk of earthquakes that may occur in the next 10 to 50 years. The methods mainly include the method of the largest earthquake in history and the method of structural analogy. Remains, form a long-term earthquake catalog, and think that the largest earthquake will occur repeatedly, use statistical methods to estimate the recurrence period, and estimate the risk of the largest earthquake at this stage based on the elaps...

Claims


Application Information

Patent Timeline
Patent Type & Authority Applications(China)
IPC IPC(8): G01V1/30
CPCG01V1/307G01V2210/63
Inventor 李智
Owner 李智
Why Eureka
Try Eureka