

EEG real-time interaction analysis system and real-time interaction analysis method based on web visualization platform
A real-time interaction and analysis method technology, applied in the field of EEG signal analysis, can solve the problems of high equipment prices, single visualization results, low efficiency of EEG signal offline analysis, etc., to achieve the effect of improving efficiency and saving costs
- Summary
- Abstract
- Description
- Claims
- Application Information
AI Technical Summary
Problems solved by technology
Method used
Image

Examples
Embodiment 1
[0037] An EEG real-time interactive analysis system based on a web visualization platform, including a cloud server and a web visualization analysis module, wherein:
[0038] The cloud server includes a service port for receiving the Internet transmission request of the EEG signal acquisition device, a data preprocessing module for performing abnormal value filtering and low-pass filtering on the EEG signal data, a database for storing processed data, A server-side module for performing basic statistical feature extraction and advanced feature extraction on the EEG time series in the database;
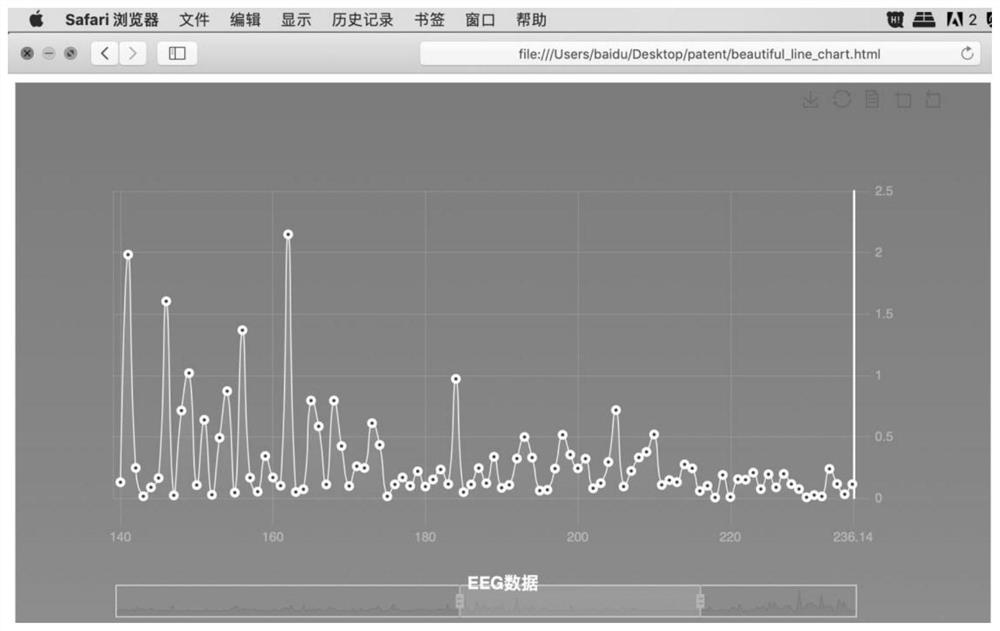
[0039] The web visualization analysis module is used for monitoring data collection and data characteristics, and using icons to visualize them.
[0040] The web visualization analysis module is the front-end module, which is loaded and used in the browser. The cloud server is the back-end module. The transmission request of the EEG signal acquisition device is transmitted by the Inter...
Embodiment 2
[0042] An EEG real-time interactive analysis method based on a web visualization platform, comprising the following steps:
[0043] Step 1, the cloud server receives the EEG signal transmitted by the EEG signal acquisition device;
[0044] Step 2, the data preprocessing module filters the abnormal values in the EEG signal data, and then performs low-pass filtering processing, and then stores the processed data in the database;
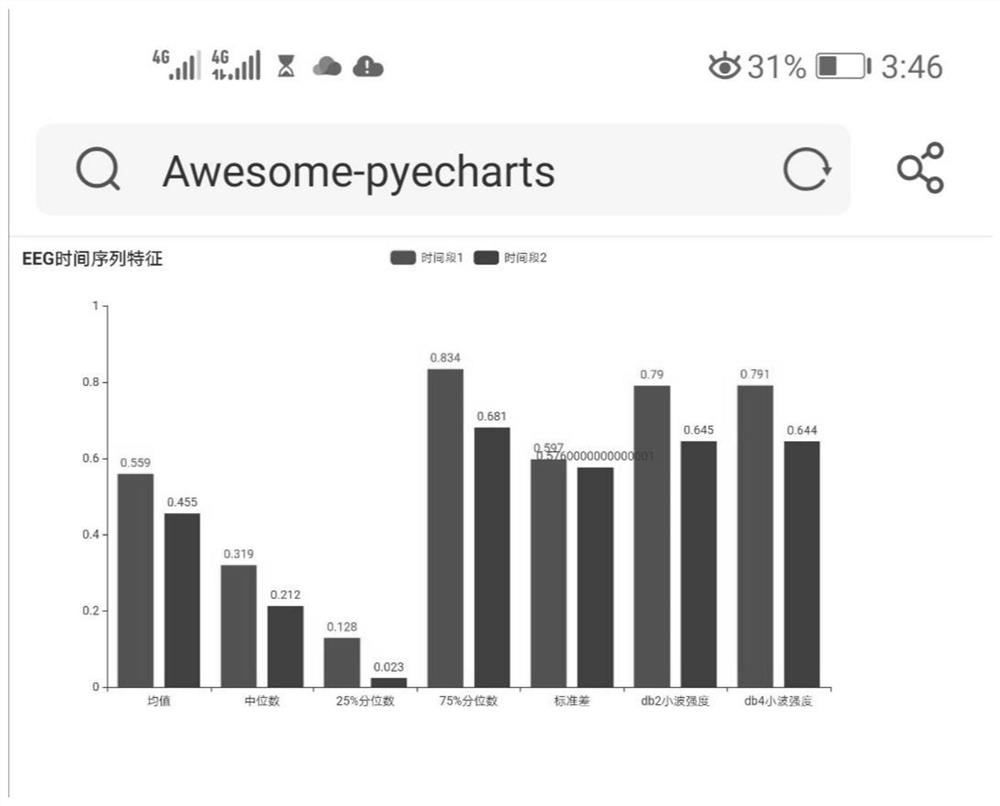
[0045] Step 3, the server-side module performs basic statistical feature extraction and custom advanced feature extraction on the processed data (EEG time series) in the database;
[0046] Step 4, the web visualization analysis module monitors and visualizes the data collection and data characteristics.
Embodiment 3
[0048] In embodiment 1 or embodiment 2, the cloud server processes the request for Internet transmission of the signal acquisition device through port 8080, and the request for Internet transmission is carried out through the post mode in the http protocol, and the time series data of this period of time is sent every minute Convert it to json format, and then upload it to the cloud server by post. The transmission request of the intelligent collection device is transmitted by the Internet through 4G or wifi.
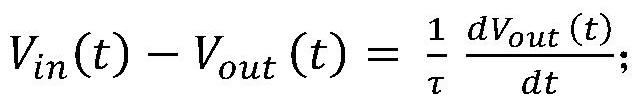
[0049] In the data preprocessing module of embodiment 1 or step 2 of embodiment 2, when filtering outliers, take 5 times of the median of the overall signal as the threshold value, and the signal points exceeding the threshold value are filtered out, and during low-pass filter processing, The low-pass filter input-output relationship satisfies the following differential equation, V in (t) is the input signal, dV out (t) is the output signal, τ=20ms
[0050]
[0051]...
PUM
 Abstract
Description
Claims
Application Information