Method for analyzing sources of large inclusions in heavy rail steel
An analysis method and technology of inclusions, applied in the direction of analyzing materials, using wave/particle radiation for material analysis, measuring devices, etc., can solve the problem of imperfect and inaccurate judgment of the source of large inclusions
- Summary
- Abstract
- Description
- Claims
- Application Information
AI Technical Summary
Problems solved by technology
Method used
Image
Examples
Embodiment 1
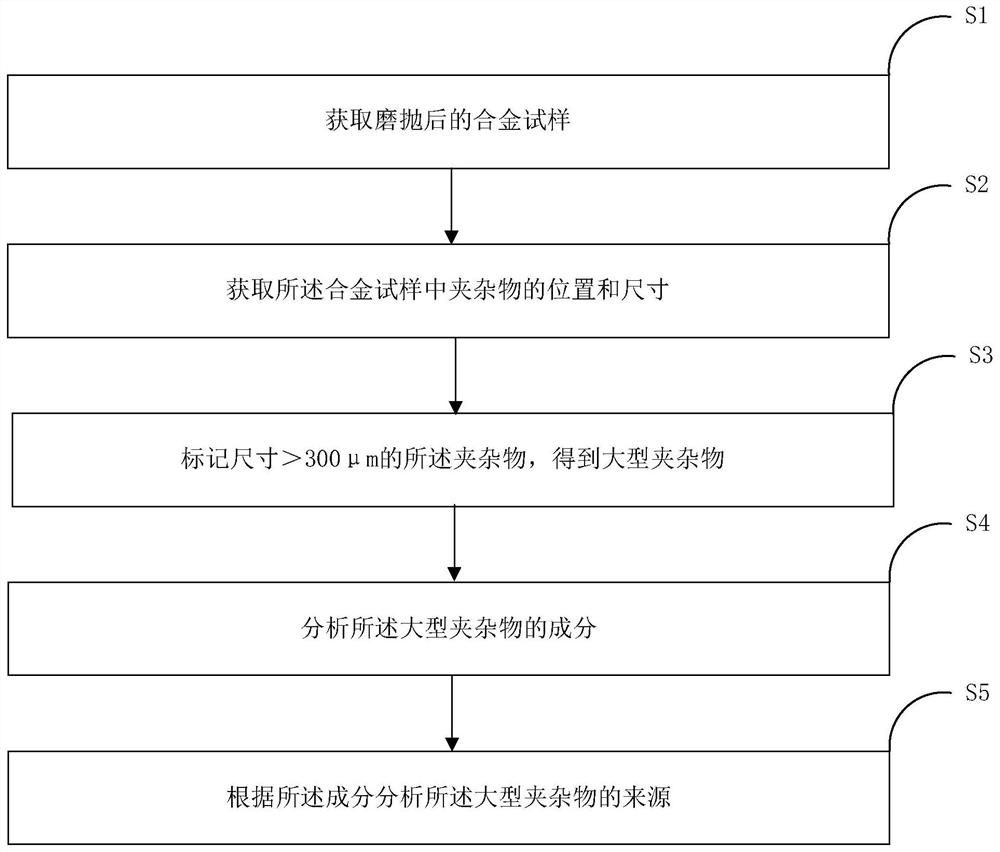
[0114] This embodiment provides a method for analyzing the source of large inclusions in heavy rail steel, including the following steps:
[0115] S1. Obtain the alloy sample after grinding and polishing.
[0116] S2. Using a microscope to obtain the position and size of the inclusions in the alloy sample.
[0117] S3. Using an indenter to mark the inclusions with a size >300 μm to obtain large inclusions.
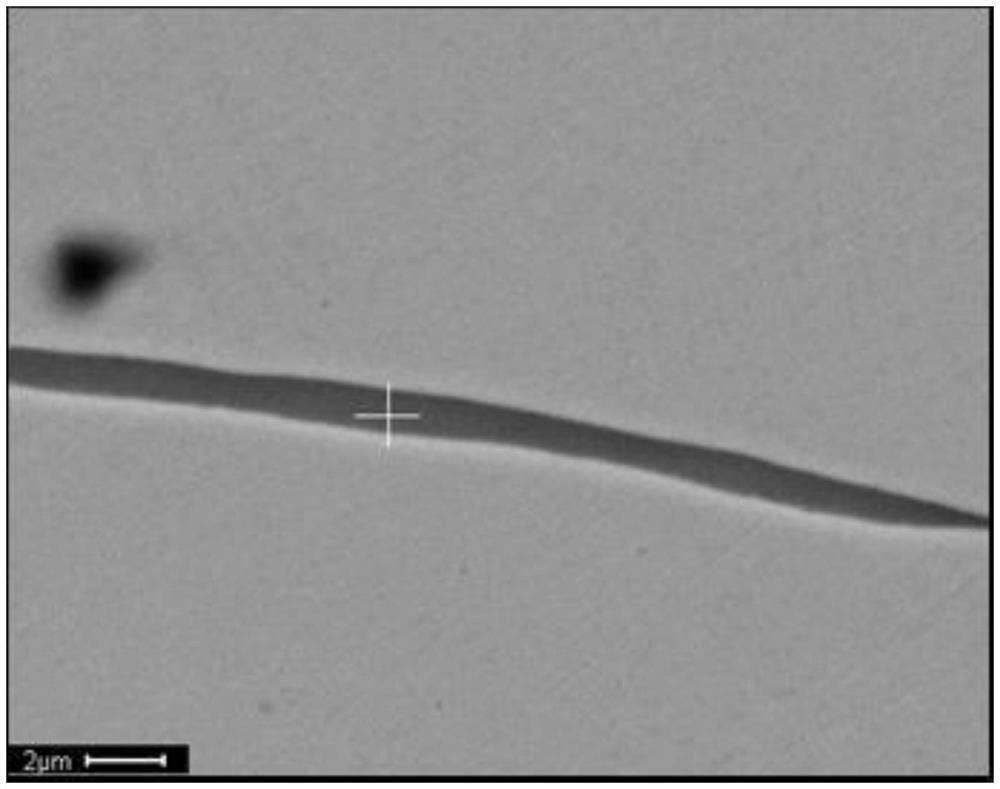
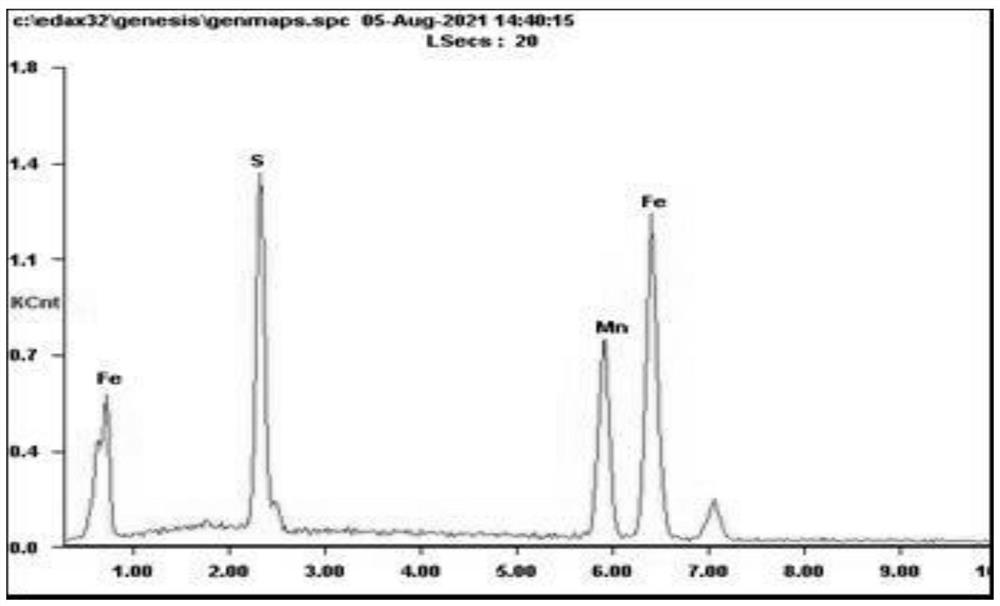
[0118] S4. Using scanning electron microscope and energy spectrum analyzer to analyze the composition of the large inclusions, the scanning electron microscope picture is shown in figure 2 , the energy spectrum analysis diagram sees image 3 .
[0119] S4.1. Analyzing the overall morphology of the large inclusions.
[0120] S4.1.1, by figure 2 It can be seen that the large inclusions are strip-shaped, consistent in color, and the ends are smooth, so it is judged that the large inclusions are sulfides. image 3 It can be seen that the sulfide is manganese sulfide.
Embodiment 2
[0122] S1. Obtain the alloy sample after grinding and polishing.
[0123] S2. Using a microscope to obtain the position and size of the inclusions in the alloy sample.
[0124] S3. Using an indenter to mark the inclusions with a size >300 μm to obtain large inclusions.
[0125] S4. Using scanning electron microscope and energy spectrum analyzer to analyze the composition of the large inclusions, the scanning electron microscope picture is shown in Figure 4 , the energy spectrum analysis diagram of steel slag is shown in Figure 5 , see the composition diagram of steel slag Image 6 , the energy spectrum analysis diagram of refractory material is shown in Figure 7 , see the refractory composition diagram Figure 8 .
[0126] S4.1. Analyzing the overall morphology of the large inclusions.
[0127] S4.1.2, by Figure 4 It can be seen that the large inclusions are irregular strips with clear boundaries and sharp edges and corners. It is judged that the large inclusions ar...
Embodiment 3
[0136] S1. Obtain the alloy sample after grinding and polishing.
[0137] S2. Using a microscope to obtain the position and size of the inclusions in the alloy sample.
[0138] S3. Using an indenter to mark the inclusions with a size >300 μm to obtain large inclusions.
[0139] S4. Using scanning electron microscope and energy spectrum analyzer to analyze the composition of the large inclusions, the scanning electron microscope picture is shown in Figure 9 , the energy spectrum analysis diagram of steel slag is shown in Figure 10 , see the composition diagram of steel slag Figure 11 , the energy spectrum analysis diagram of refractory material is shown in Figure 12 , see the refractory composition diagram Figure 13 .
[0140] S4.1. Analyzing the overall morphology of the large inclusions.
[0141] S4.1.2, by Figure 9 It can be seen that the large inclusions are irregular strips with clear boundaries and sharp edges and corners. It is judged that the large inclusio...
PUM
| Property | Measurement | Unit |
|---|---|---|
| size | aaaaa | aaaaa |
Abstract
Description
Claims
Application Information
 - R&D
- Intellectual Property
- Life Sciences
- Materials
- Tech Scout
- Unparalleled Data Quality
- Higher Quality Content
- 60% Fewer Hallucinations
Browse by: Latest US Patents, China's latest patents, Technical Efficacy Thesaurus, Application Domain, Technology Topic, Popular Technical Reports.
© 2025 PatSnap. All rights reserved.Legal|Privacy policy|Modern Slavery Act Transparency Statement|Sitemap|About US| Contact US: help@patsnap.com


