Method for determining rhNGF protein content
A technology for protein content and protein content, applied in the measurement of color/spectral properties, etc., can solve the problems of complex, time-consuming, and unsuitable processes
- Summary
- Abstract
- Description
- Claims
- Application Information
AI Technical Summary
Problems solved by technology
Method used
Image

Examples
Embodiment 1
[0013] Embodiment 1: Determination of protein concentration of rhNGF sample by Kjeldahl method
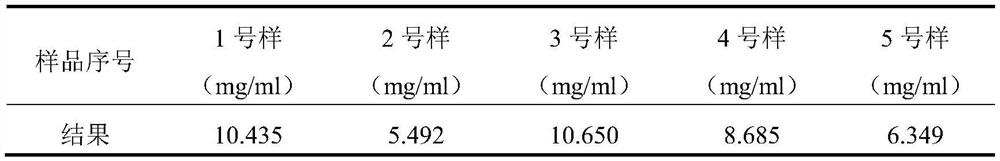
[0014] Using the Kjeldahl method (for specific methods, please refer to the first method of "Pharmacopoeia of the People's Republic of China" 2020 edition four parts 0731) to measure the protein concentration of samples 1 to 5, the measured data are as follows, see Table 1:
[0015] Table 1 Kjeldahl method to measure the concentration of each sample
[0016]
[0017] The absolute protein content of different rhNGF samples can be accurately determined by Kjeldahl method.
Embodiment 2
[0018] Embodiment 2: the establishment of standard curve
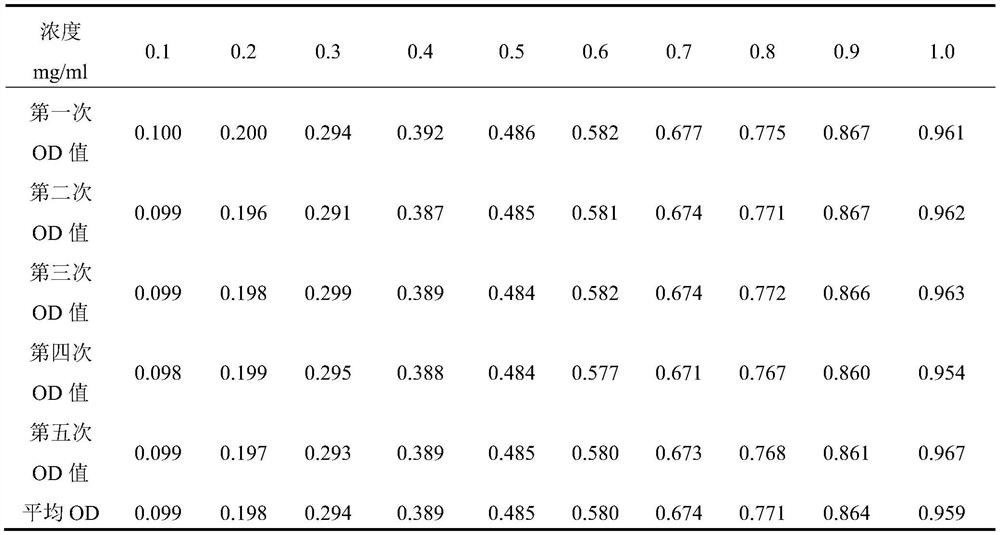
[0019] Dilute sample No. 1 to 1.0mg / ml, 0.9mg / ml, 0.8mg / ml, 0.7mg / ml, 0.6mg / ml, 0.5mg / ml, 0.4mg / ml, 0.3mg / ml, 0.2mg / ml , 0.1mg / ml a series of concentrations, the absorbance of each concentration sample was measured 5 times at 280nm, and the average value was calculated. The results are as follows, see Table 2:
[0020] Table 2 OD value under gradient dilution concentration
[0021]
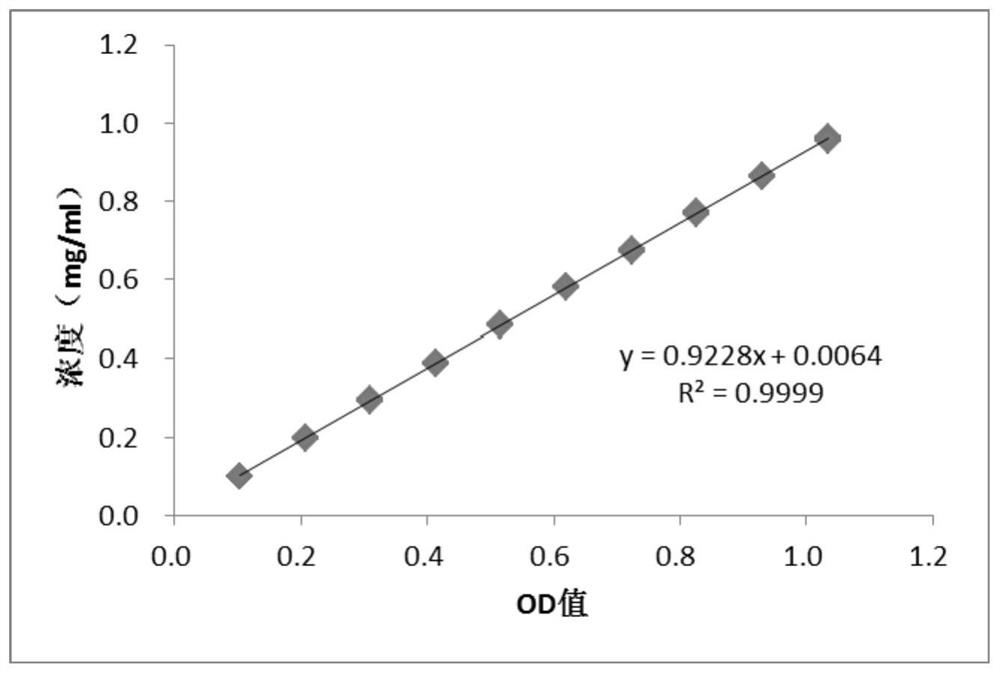
[0022] According to the data in the table, use Excel to establish the concentration-OD value proportional relationship, and perform linear regression to obtain the standard curve, judge whether the standard curve is qualified according to the correlation coefficient of the standard curve, and then average the qualified standard curve to obtain the standard curve, see figure 1 .
[0023] Depend on figure 1 It can be seen that the obtained rhNGF standard curve equation is: y=0.9228x+0.0064, and its R 2 =0.9999, the applicable range ...
Embodiment 3
[0024] Embodiment 3: the determination of rhNGF sample content
[0025] Take rhNGF samples A, B and C with unknown concentrations, dilute them 16 times with buffer solution, measure their absorbance at 280 nm with a UV-Vis spectrophotometer, measure 3 times, and calculate the average value. Then the average value was substituted into the rhNGF standard curve equation obtained in Example 2 to calculate the concentration of the rhNGF sample. The results are shown in Table 3 below.
[0026] Table 3 Determination of rhNGF content
[0027]
[0028]
PUM
 Abstract
Description
Claims
Application Information
 - R&D Engineer
- R&D Manager
- IP Professional
- Industry Leading Data Capabilities
- Powerful AI technology
- Patent DNA Extraction
Browse by: Latest US Patents, China's latest patents, Technical Efficacy Thesaurus, Application Domain, Technology Topic.
© 2024 PatSnap. All rights reserved.Legal|Privacy policy|Modern Slavery Act Transparency Statement|Sitemap