Method for evaluating solar energy absorption capability of regional electric-thermal integrated energy system

A technology that integrates energy systems and absorbing capacity, and is used in heating systems, hot water central heating systems, heating methods, etc.

Pending Publication Date: 2022-05-27
TIANJIN UNIV
0 Cites 0 Cited by

AI-Extracted Technical Summary

Problems solved by technology

[0005] The technical problem to be solved by the present invention is to provide a method for evaluating the solar energy absorption capacity of the regional electric-thermal integrated energy system, which is used to solve the multi-form en...

Method used

The optimization result corresponding to calculation example 1 is as table 4 and Fig. 5-7. It can be seen that due to the time-delay characteristics of the heating network, SC has certain advantages compared with PV in improving the level of solar energy consumption. By adjusting the water supply temperature of the energy station within a reasonable range, the delay characteristics of the district heating network can be fully utilized, breaking through the heat load limit at noon in summer, while achievi...

Abstract

The invention relates to a regional electric-thermal integrated energy system solar energy absorption capability assessment method, which comprises the following steps: firstly, determining a regional electric-thermal integrated energy system model; secondly, establishing a solar energy absorption capability evaluation index based on electric and thermal collaborative absorption; thirdly, establishing a solar energy absorption capability evaluation model of the regional electric-thermal integrated energy system by taking the maximum system absorption capability as a target; then, power distribution network system parameters, regional heat supply network parameters and regional electricity-heat integrated energy system equipment parameters are determined; and finally, solar energy consumption capability evaluation is carried out on the regional electric-thermal integrated energy system, and a system maximization consumption mode and corresponding reasonable configuration of solar energy consumption equipment are obtained. According to the invention, when the method is adopted to evaluate the solar energy consumption capability from the perspective of consumption technology, the regional electric-thermal integrated energy system can explore the own consumption capability, the consumption mode and the reasonable configuration of solar energy consumption equipment, and the maximum consumption of solar energy is realized.

Application Domain

Lighting and heating apparatusDesign optimisation/simulation +5

Technology Topic

Process engineeringElectric heating +6

Image

  • Method for evaluating solar energy absorption capability of regional electric-thermal integrated energy system
  • Method for evaluating solar energy absorption capability of regional electric-thermal integrated energy system
  • Method for evaluating solar energy absorption capability of regional electric-thermal integrated energy system

Examples

  • Experimental program(1)

Example Embodiment

[0252] Specific examples are given below:
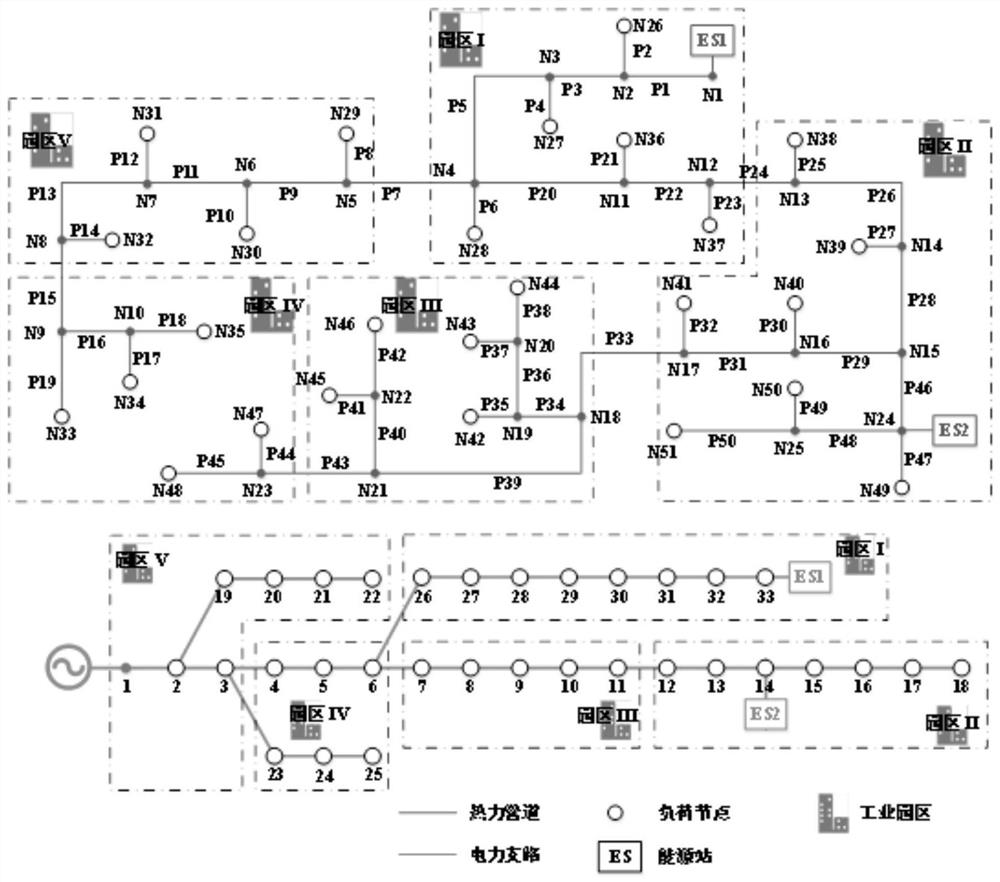
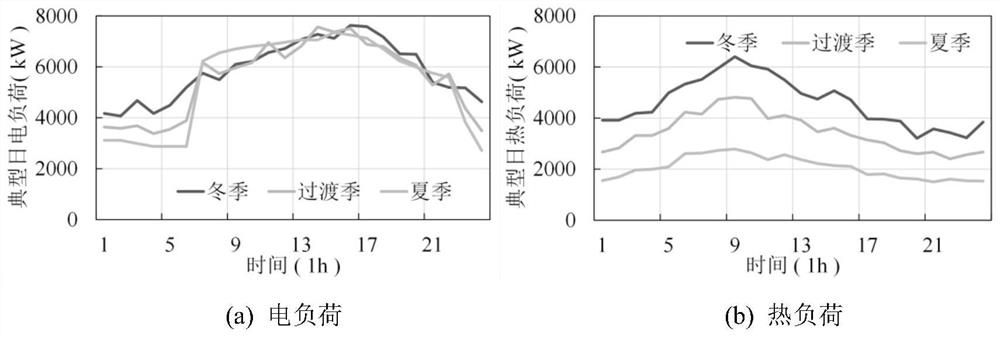
[0253] In particular, as figure 2 In this embodiment, a regional electric-thermal integrated energy system composed of an IEEE33 regional power system and a 51-node regional thermal system is selected, and its topology is as follows figure 2 shown. The system contains two energy stations. The equipment in each energy station includes Photovoltaic (PV), Solar Collector (SC), Gas Turbine Combined Heat and Power (CHP) unit, Electric Boiler (Electrical) boiler, EB). In this example, three typical days of winter (120 days, determined according to the heating period), transition season (153 days), and summer (92 days) are used to verify the solar energy absorption capacity evaluation model.
[0254] In this embodiment, four sets of calculation examples are selected to verify the solar energy absorption capacity evaluation model of the regional electric-thermal integrated energy system proposed in the present invention, to explore the optimal solar energy configuration and operation scheme of the system, and to provide various methods to improve the absorption capacity. The typical means of maximizing the effect of the method:
[0255] (1) Example 1: The solar energy absorption capacity of the district thermal-electric integrated energy system is evaluated without considering and considering the delay characteristics of the heat network, and the influence of the delay characteristics of the heat network on the solar energy absorption capacity of the system is explored. In order to exclude the influence of energy storage and abandoned light on the analysis process, this example does not consider energy storage and does not allow abandoned light.
[0256](2) Example 2: Adjust the upper limit of the return water temperature of each node within the range of 85-100 °C to study the influence of the temperature operating range of the heat network node on the solar energy consumption of the system. In order to exclude the influence of energy storage and abandonment of light on the analysis process, energy storage is not considered in this example and abandonment of light is not allowed.
[0257] (3) Calculation example 3: By adjusting the light abandonment penalty coefficient between 0.0001 and 1000, to analyze the changes in the installation area of ​​solar energy absorption equipment and ASEAC under different light abandonment rates. In order to exclude the influence of energy storage, this example does not consider energy storage.
[0258] (4) Example 4: By changing the capacity of the energy storage device, the influence of the energy storage device on the solar energy absorption capacity of the system is explored. In order to avoid the influence of abandoned light on the solar energy absorption capacity of the system, abandoned light is not allowed.
[0259] For the above system, the method of this embodiment is specifically the following steps:
[0260] Step 1: Determine the components and structure of the regional electric-thermal integrated energy system.
[0261] Step 2: According to the components and structure of the regional electric-thermal integrated energy system provided in step 1, determine the regional electric-thermal integrated energy system model, including the following steps:
[0262] Step 2-1: Use the Distflow model to model the distribution network, as follows:
[0263] For any moment, for any node j in the regional power system, there is the following power balance relationship:
[0264]
[0265]
[0266]
[0267]
[0268]
[0269] Among them, ζ e (j) represents the set of branch head-end nodes with j as the end node; ξ e (j) represents the set of branch end nodes with j as the head node; are the active power (kW) and reactive power (kVar) flowing from node i to node j, respectively; are the active and reactive injection power of node i at time t, respectively; r ij , x ij are the resistance and reactance (Ω) of line ij, respectively; is the square of the current amplitude on line ij at time t (A 2 ). are the active and reactive power injected by the large grid at node j at time t, respectively; are the active load and reactive load at load node j at time t, respectively; are the active and reactive outputs of the CHP unit at node j at time t, respectively; is the active power output of photovoltaics at node j at time t; is the active power consumed by the electric heating boiler at node j at time t; are the charging and discharging power of the power storage device at node j at time t, respectively; is the maximum injected power at node j of the distribution network.
[0270] For any moment, for any branch ij in the distribution network, the following relationship holds:
[0271]
[0272]
[0273]
[0274] in, is the square of the voltage amplitude of node i at time t (V 2 ); is the active power loss of branch ij at time t.
[0275] For any time t, the voltage of any node in the entire network and the current of any branch must be within the safe operating range:
[0276]
[0277]
[0278] where, u max , u min are the upper limit and lower limit of the voltage square of node i, respectively (V 2 ); i max is the square of the maximum current allowed by line ij (A 2 ).
[0279] Step 2-2: Model the regional heat network using the quality adjustment mode. The specific steps include:
[0280] Step 2-2-1: Establish the temperature model of the heat network node, the specific steps are as follows:
[0281] The temperature mixing equations of node j in the supply and return water network can be expressed as:
[0282]
[0283]
[0284] where m ij , m loadj are the mass flow of pipeline ij and the load flow of node j (kg/s); are the outlet temperatures (°C) of the water supply pipeline ij and the return water pipeline jk at time t, respectively; are the supply and return water temperatures (°C) of node j at time t, respectively; is the return water temperature (°C) of load j at time t. ζ s (j), ζ r (j) is the first node set of the pipeline with node j as the end node in the supply and return water pipeline network respectively, ξ s (j), ξ r (j) is the set of end nodes of the pipeline with node j as the head node in the supply and return water pipeline network respectively.
[0285] Divide both sides of the equation by the total injected mass flow at node j, and introduce the upstream mass flow ratio β of the supply and return pipe network s , β r , at the same time, let Then formulas (11)-(12) can be expressed as:
[0286]
[0287]
[0288]
[0289]
[0290]
[0291] The time-delay characteristics of the inlet temperature and outlet temperature of the pipeline can be processed by the method of time discretization. Take the water supply pipeline ij as an example, suppose the time interval is Δt and the length of the pipeline ij is l ij (m), pipeline ij can be approximately divided into τ according to Δt ij length is Δl ij (m) unit. Thus, τ ij It can be calculated by the following formula:
[0292]
[0293]
[0294] Among them, D ij is the diameter of the pipe ij (m), ρ is the density of the hot water (kg/m 3 ).
[0295] Since the thermal process of the regional heat network is transmitted at the mass flow rate, the delay time of the influence of the temperature of node i on the temperature of node j can be approximated by τ ij Δt represents. Therefore, after considering the time delay characteristics of temperature, the outlet temperature of pipeline ij at time t can be regarded as t-τ ij The result of the temperature of the inlet node i at the time of Δt after the heat dissipation through the pipeline:
[0296]
[0297] Among them, c is the specific heat capacity of hot water (kJ/(kg·K)); λ ij is the thermal conductivity of pipe ij (kW/(m·K)).
[0298] Substituting formula (20) into formula (13), let The temperature calculation formula of node j in the water supply network at time t can be obtained:
[0299]
[0300] Similarly, the calculation formula of node j in the return water pipe network at time t is:
[0301]
[0302] When t Bring in the initial water supply temperature of node i and the initial return water temperature of node k, respectively.
[0303] Step 2-2-2: Establish the heat loss model of the heat network pipeline, the specific steps are as follows:
[0304] Assuming that the hot water temperature of each unit pipe in pipe ij at time t is approximately represented by the average temperature of the inlet and outlet of the unit pipe at time t, the heat loss of pipe ij at time t can be expressed as:
[0305]
[0306] Among them, node i is the entry node of pipeline ij. The above formula is applicable to both the water supply pipe network and the return water pipe network.
[0307] Step 2-2-3: Establish the heat source and heat load thermal power model of the heat network. The specific steps are as follows:
[0308] For the heat source and heat load at node i, the thermal power at time t is the thermal potential difference of the water supply and return pipe network at time t:
[0309]
[0310]
[0311] in, are the heat source and heat load power (kW) at node i, respectively.
[0312] For the heat source at node i, its thermal power is the sum of the heat output of each heating equipment:
[0313]
[0314] in, are the thermal output (kW) of the solar collector and the CHP unit at node i at time t, respectively; are the charge and discharge heat power (kW) of the heat storage device at node i at time t, respectively.
[0315] Step 2-2-4: Establish the temperature operation model of the whole heating network. The specific steps are as follows:
[0316] For any node i in the supply and return water pipeline network, whether it is a heat source node, a heat load node or a common node, the temperature of the supply and return water has a specific operating range:
[0317]
[0318]
[0319] Among them, T s,min , T r,min are the minimum operating temperature (°C) of the supply and return water pipe network respectively, T s,max , T r,max are the maximum operating temperature (°C) of the supply and return water pipe networks, respectively.
[0320] In addition, in order to prevent the effect of the delay characteristic of the heat network from "accumulating recklessly" one day after the Should be the same as the temperature at the initial scheduling moment of the day be consistent:
[0321]
[0322] Step 3: Based on the synergistic consumption of solar power and heat, establish an evaluation index for the solar energy consumption capacity of the regional electric-thermal integrated energy system, which specifically includes the following steps:
[0323] Step 3-1: In order to take into account the energy level difference between electricity and heat, based on the energy quality coefficient, establish the annual solar energy accommodation capacity index ASEAC (Annual solar energy accommodation capacity) from the energy supply side, as follows:
[0324]
[0325] in, are the photovoltaic power (kW) and the solar collector heating power (kW) at node i at time t in the d day; N day is the number of days in a year; N Δt is the number of scheduling intervals in a day; N bus , N node are the number of busbars in the distribution network and the number of nodes in the regional heating network; is the energy quality coefficient of the hot water produced by the solar collector at time t on the dth day at node i, calculated as follows:
[0326]
[0327] in, are the supply and return water temperatures (K) at the heat source node i at time t in the dth day, respectively; is the ambient temperature (K) at time t in day d.
[0328] Step 3-2: In order to analyze the solar energy absorption capacity from the perspective of abandoned light, establish the annual solar energy abandonment index ASEC (Annual solar energy curtailment) of the system, and the specific calculation is as follows:
[0329]
[0330] in, are photovoltaic power (kW) and solar collector power (kW) at node i at time t in day d, respectively.
[0331] Step 3-3: Maintaining a reasonable light rejection rate will help improve the solar energy consumption level of the regional integrated energy system. However, when the light rejection rate is small, it may cause insufficient installation of solar energy absorbing equipment and waste solar energy resources; when the light rejection rate is large, the utilization rate of solar energy absorbing equipment may be weakened. In order to further explore the influence of the abandoned light rate on the solar energy absorption capacity of the system, an index of the abandoned light rate based on the synergistic consumption of solar electricity and heat was established, that is, the proportion of annual abandoned electricity and annual abandoned heat in the maximum annual energy supply of solar energy consumption equipment.
[0332]
[0333] Step 4: According to the evaluation index of solar energy absorption capacity proposed in Step 3, establish the solar energy absorption capacity evaluation model of the regional electric-thermal integrated energy system with the goal of maximizing the solar energy absorption capacity and considering the suppression of abandoned light and network loss, Specifically include the following steps:
[0334] Step 4-1: Assessment of the solar energy absorption capacity of the district heat-electric integrated energy system aims to coordinate various technical means to promote solar energy absorption and energy network characteristics, maximize the system ASEAC, and determine the optimal solar energy consumption of the system accordingly. Proportion of equipment installed capacity. However, the pure pursuit of ASEAC maximization may lead to excessive electrical loss, thermal loss or light rejection rate in the consumption scheme. In order to take into account the principles of green and energy saving and improve energy utilization efficiency, it is necessary to consider the power loss, Heat loss and suppression of light rejection. In view of the above considerations, the present invention adopts the typical daily analysis method with a time scale of one year to evaluate the solar energy absorption capacity of the regional thermal-electric integrated energy system, and the objective function is as follows:
[0335]
[0336] in, are the penalty coefficients for the distribution network loss and the regional heating network heat loss, respectively. Generally, the power loss and heat loss are much smaller than the system ASEAC. The penalty factor for net heat loss is recommended to be between 1 and 100. μ solar For the abandonment penalty coefficient, when the system can adjust the abandonment power autonomously, the abandonment power can be determined according to the system’s optimal abandonment rate. At this time, the abandonment penalty coefficient can be set to 0; if the system cannot adjust the abandonment power independently, then According to the order of magnitude relationship and a large number of example tests, the abandonment penalty coefficient is recommended to be between 0.5 and 100. is the power network loss (kW) of branch b at time t in day d; is the thermal network loss (kW) of the pipeline p at time t in the dth day. N branch , N pipe are the number of branches in the distribution network and the number of pipes in the district heating network.
[0337] Step 4-2: The optimization variable x of the model established in Step 4-1 includes planning optimization variables and running optimization variables, including:
[0338] (7) The planning optimization variables include the photovoltaic installation area A in each energy station PV , Solar collector installation area A SC.
[0339] (8) Operational optimization variables include:
[0340] ·The output of the superior power grid at each time of each typical day Heat source output
[0341] ·The busbar voltage u of the distribution network at each time of each typical day t,d , the branch current i t,d , branch power P t,d , Q t,d , the bus injection power
[0342] ·The supply and return water temperature T of the regional heating network nodes at each time of each typical day s,t,d , T r,t,d;
[0343] ·The output and operating status of various energy conversion and energy storage equipment at various times on a typical day, including,
[0344] In the optimization variable x, in addition to the charging and discharging states of the energy storage device Except for 0-1 integer variables, the rest of the optimization variables are continuous variables.
[0345] Step 4-3: Establish the constraints of the model in Step 4-1, including the following steps:
[0346] Step 4-3-1: Establish constraints on solar energy absorbing equipment. For the evaluation of solar energy absorption capacity considering the co-consumption of electricity and heat, it is necessary to consider the installation area constraints of solar energy absorption equipment. Generally, solar energy absorbing equipment needs to be installed in places with high light intensity in the district electric-thermal integrated energy system to maximize the utilization of solar energy. But whether it is installed on the roof or in the open space, the installation area is often limited. When photovoltaic and solar collectors are built in the same area, there will be a competitive relationship between the two:
[0347]
[0348] Among them, A PV,i , A SC,i are the PV and SC installation areas at node i, respectively (m 2 ), is the maximum installable area of ​​solar energy absorbing equipment at node i (m 2 ).
[0349] To sum up, the constraints of solar energy absorbing equipment include formulas (30)-(34), (54).
[0350] Step 4-3-2: Establish thermoelectric coupling device constraints. The thermoelectric coupling device constraints in the evaluation of solar energy absorption capacity include equations (35)-(38), all of which are linear constraints.
[0351] Step 4-3-3: Establish energy storage device constraints, ie formulas (39)-(48).
[0352] Step 4-3-4: Establish regional heat network operation constraints, namely formulas (21)-(22), (24)-(29).
[0353] Step 4-3-5: Establish grid operation constraints, namely formulas (1)-(7), (9)-(10).
[0354] Step 5: Input the system parameters according to the solar energy absorption capacity evaluation model of the district electric-thermal integrated energy system proposed in Step 4, which specifically includes the following steps:
[0355] Step 5-1: Input distribution network system parameters, including distribution network line parameters, load level, and network topology connection relationship, as shown in Table 1. In addition, the bus voltage safety range is 0.9-1.1p.u., and the branch current is limited to 1000A.
[0356] Table 1 Regional power system parameters
[0357]
[0358] Step 5-2: Input the parameters of the district heating network, including the pipeline parameters of the district heating network, the load level, and the network topology connection relationship, as shown in Table 2. In addition, the temperature range of the water supply of the energy station is 90-110°C, and the temperature of the return water is 90-70°C. Assume that the initial temperature of the three typical daily SC water tanks is 100 °C.
[0359] Table 2 Regional thermal system parameters
[0360]
[0361]
[0362] Step 5-3: Input the equipment parameters of the regional electric-thermal integrated energy system, including the access location and capacity of each energy supply equipment and energy storage equipment, and the maximum installation area of ​​each node that can install solar energy equipment, as shown in Table 3.
[0363] Table 3 Regional Electric-Heat Integrated Energy System Equipment Parameters
[0364]
[0365] Step 5-4: Input the typical daily load parameters, including the electricity and heat load conditions of typical days in winter, transition season, and summer for 24 hours. image 3.
[0366] Step 5-5: Input environmental parameters, including solar light intensity and ambient temperature, as in Figure 4.
[0367] Step 5-6: Set the simulation time interval to 15 minutes, the network loss penalty coefficient to 1, and the light abandonment penalty coefficient to 100.
[0368]Step 6: Solve the solar energy absorption capacity evaluation model of the regional electric-thermal integrated energy system proposed in step 4 and the input data in step 5, and evaluate the solar energy absorption capacity of the regional electric-thermal integrated energy system, and obtain the maximum consumption of the system. Consumption mode and reasonable configuration of solar energy consumption equipment. Specifically include the following steps:
[0369] Step 6-1: Based on the interpretation of the solar energy absorption capacity evaluation model of the regional electric-thermal integrated energy system in steps 4-1, 4-2, and 4-3, it can be known that the model belongs to a 0-1 mixed integer nonlinear optimization problem. In order to facilitate the calculation and solution, the model objective function and constraints need to be processed, including the following steps:
[0370] Step 6-1-1: Process the objective function. In the objective function (53), due to the energy-mass coefficient κ t,d The existence of , makes the objective function nonlinear. After calculating the formula (50), it can be judged that when the water supply temperature is constant, the change of energy mass coefficient when the return water temperature changes by 20°C under the same ambient temperature is smaller than that when the ambient temperature changes by 20°C under the same return water temperature; The same is true when the return water temperature is constant. Therefore, the influence of ambient temperature on energy quality coefficient is greater than that of supply and return water temperature on energy quality coefficient. Based on the above analysis, in order to simplify the calculation, the energy-mass coefficient calculation formula (50) Use the supply and return water temperatures at the median value of each cluster of energy and mass coefficient change curves to replace, that is, replace the energy and mass coefficient calculation formula (3-2) with the mean value of the temperature range. So far, the energy-mass coefficient calculation formula (50) is transformed into:
[0371]
[0372] in, are the mean values ​​(K) of the supply and return water temperature operating ranges at the heat source node i, respectively.
[0373] Step 6-1-2: Handling Constraints
[0374] Because the solar energy absorption capacity evaluation model of the district electric-thermal integrated energy system is processed above, except the distribution network constraint (7) is a non-convex nonlinear constraint, the objective function and other constraints are all linear. In order to overcome the difficulty of solving the model, the distribution network constraint (7) is relaxed into a second-order conical form:
[0375]
[0376] To verify the accuracy of the second-order cone relaxation constraint at the optimal solution, the relaxation error is defined as follows:
[0377]
[0378] Step 6-2: Based on the processing of the solar energy absorption capacity evaluation model of the regional electric-thermal integrated energy system in Step 6-1, mature mathematical software such as Gurobi and CPLEX can be used to directly solve the problem, and obtain the maximum absorption capacity of the system. Consumption mode and reasonable configuration of solar energy consumption equipment.
[0379] The results of the four examples are as follows, verifying the effectiveness of the proposed method:
[0380] The optimization results corresponding to Example 1 are shown in Table 4 and Figure 5-7. It can be seen that due to the delay characteristics of the thermal network, SC has certain advantages in improving the level of solar energy consumption compared with PV. By adjusting the water supply temperature of the energy station within a reasonable range, the delay characteristics of the district heating network can be fully utilized to break through the heat load limit at noon in summer. While achieving a better match between the heat source output and the peak solar light intensity, the peak output of the heat source can be increased. Improve the solar energy absorption capacity of the system.
[0381] The optimization results corresponding to Example 2 are as follows: Figure 8-10. It can be seen that the increase of the upper limit of the return water temperature helps to increase the annual solar energy consumption of the regional electric-thermal integrated energy system. At the same time, limited by the lower limit of the water supply temperature and the heat load, the system has an upper limit of the minimum return water temperature.
[0382] The optimization results corresponding to Example 3 are as follows: Figure 11-13. It can be seen that although increasing the SC installation area properly will cause the phenomenon of light rejection, it will help to improve the solar energy consumption of the system as a whole.
[0383] The optimization results corresponding to Example 4 are shown in Table 5 and Figure 14-16. It can be seen that due to the objective existence of the delay characteristics of the thermal network, compared with the electricity storage equipment, the thermal storage equipment has a more significant impact on the system absorption capacity, and is regarded as an important means to improve the solar energy absorption capacity and solve the problem of abandoned light. .
[0384] Table 4 Optimization results under calculation example 1
[0385]
[0386] Table 5 Optimization results of sub-examples
[0387]
[0388] As will be appreciated by those skilled in the art, the embodiments of the present application may be provided as a method, a system, or a computer program product. Accordingly, the present application may take the form of an entirely hardware embodiment, an entirely software embodiment, or an embodiment combining software and hardware aspects. Furthermore, the present application may take the form of a computer program product embodied on one or more computer-usable storage media (including, but not limited to, disk storage, CD-ROM, optical storage, etc.) having computer-usable program code embodied therein.

PUM

no PUM

Description & Claims & Application Information

We can also present the details of the Description, Claims and Application information to help users get a comprehensive understanding of the technical details of the patent, such as background art, summary of invention, brief description of drawings, description of embodiments, and other original content. On the other hand, users can also determine the specific scope of protection of the technology through the list of claims; as well as understand the changes in the life cycle of the technology with the presentation of the patent timeline. Login to view more.
Why Eureka
Try Eureka