Inplausible method based on few-sample relation prediction model

A technology for predicting models and relationships, applied in the field of knowledge graphs, can solve problems such as difficult decision-making process and insufficient interpretability, and achieve the effects of high practicability, good application prospects, and improved credibility

Pending Publication Date: 2022-08-05
CHONGQING UNIV OF POSTS & TELECOMM
0 Cites 0 Cited by

AI-Extracted Technical Summary

Problems solved by technology

However, most neural networks are black-box models, and their internal decision-making process is difficult to understand
With...

Method used

As can be seen from the analysis of Table 3, each data set has its own optimal convolution kernel size. Through the experimental results, it can be found that combining several convolution kernels whose sizes are close to the optimal single size can improve the performance, but increasing the convolution kernel size far from the optimal range may hurt the performance. As can be seen from Table 4, using (3,4,5), and (2,3,4) and (2,3,4,5) sets close to the optimal single kernel size produces the best results with closest effect. The difference is especially noticeable compared to other settings such as (5,6,7). Even using only one effective kernel size (here 3) performs better than combining different kernel sizes (5,6,7). Therefore, in some cases, it is better to use multiple filters with different but close to the optimal size. From Table 3, another experimental result using several convolution kernel sizes on the Wiki dataset, it can be concluded that from the performance of a single convolution kernel size, Wiki's best single convolution kernel size is 7. Based on this Table 4 exploring kernel sizes around these values, and comparing to using multiple kernel sizes far from these "best" values, you can see here that (6,7,8) outperforms ( 2,3,4) and (3,4,5) are good. Therefore, the results still show that a combination of close to the optimal single kernel size is ...

Abstract

The invention belongs to the field of knowledge maps, and particularly relates to an interpretable method based on a few-sample relation prediction model. The method comprises the following steps: evaluating the interpretability of a few-sample relation prediction model to obtain an interpretable evaluation result; improving the model according to the interpretable evaluation result; acquiring a problem from a user, and inputting the problem into the improved few-sample relation prediction model to obtain a credible prediction result of the problem; according to the method, multiple comparison models are selected for analysis, evaluation indexes are calculated by changing data volumes and data contents of the few-sample relation prediction model and the comparison models, and influences of different data volumes and different data contents on the models are analyzed; calculating evaluation indexes by changing hyper-parameters, such as an activation function, a pooling strategy and regularization, of a convolutional neural network in the few-sample relation prediction model, and analyzing the influence of the hyper-parameters on the model; the credibility of the relation prediction result of the model is improved, and the practicability is high.

Application Domain

Natural language data processingNeural architectures +3

Technology Topic

Data contentActivation function +10

Image

  • Inplausible method based on few-sample relation prediction model
  • Inplausible method based on few-sample relation prediction model
  • Inplausible method based on few-sample relation prediction model

Examples

  • Experimental program(1)

Example Embodiment

[0028] The technical solutions in the embodiments of the present invention will be clearly and completely described below with reference to the accompanying drawings in the embodiments of the present invention. Obviously, the described embodiments are only a part of the embodiments of the present invention, but not all of the embodiments. Based on the embodiments of the present invention, all other embodiments obtained by those of ordinary skill in the art without creative efforts shall fall within the protection scope of the present invention.
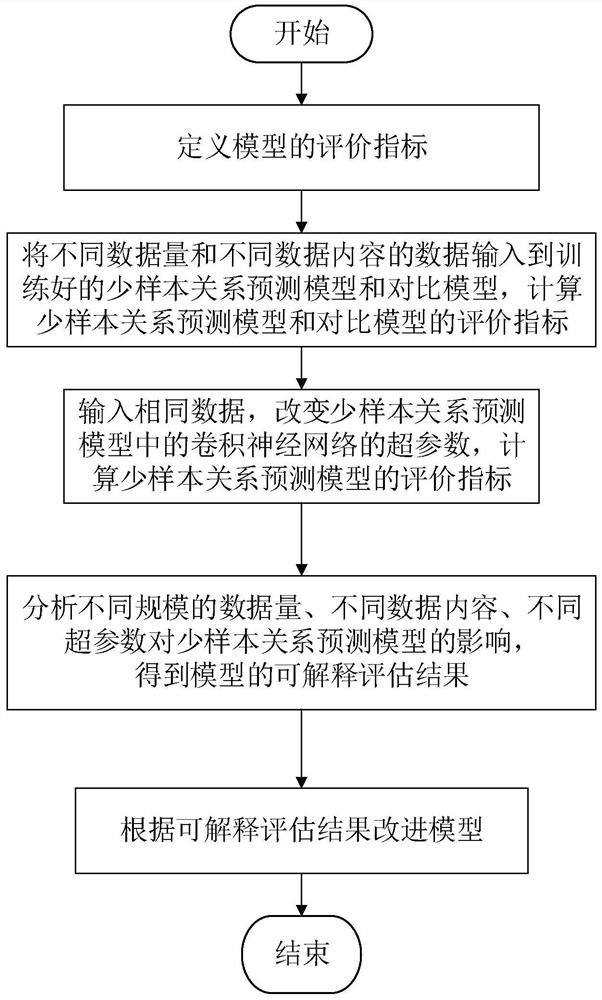
[0029] The present invention proposes an interpretable method based on a few-sample relation prediction model, such as figure 1 As shown, the method includes: evaluating the interpretability of a few-sample relationship prediction model to obtain an interpretable evaluation result; improving the model according to the interpretable evaluation result; acquiring a question from a user, and entering the question into the improved few-sample In the relationship prediction model, the credible prediction results of the problem are obtained;
[0030] In some embodiments of the present invention, the few-shot relationship prediction model is a neighbor aggregation-based few-shot relationship prediction model (MEEN).
[0031] like figure 2 As shown, the relationship prediction of the neighbor-aggregated few-sample relationship prediction model includes obtaining the original data; constructing the initial knowledge graph and the triplet to be predicted according to the original data; using the trained neighbor encoder to process the triplet to be predicted to obtain the relationship Correct triplet; complete the initial knowledge graph according to the triplet with the correct relationship to obtain a complete knowledge graph; among them, the training process of the neighbor encoder includes:
[0032] Obtain the correct knowledge graph; preprocess the knowledge graph to obtain the embedded representation of the knowledge graph;
[0033] Randomly extract K triples in the knowledge graph and use the K triples as the support set, and use the remaining triples as the positive sample query set; among them, the triples contain head entities, relation entities and tail entities the management unit;
[0034] Replace the tail entities of triples in the positive sample query set to obtain the negative sample query set;
[0035] Sampling the neighbor entities of all entities in the knowledge graph to obtain all neighbor entities of each entity;
[0036] The neighbor encoder is used to extract the features of the neighbor entities of each entity, and the neighbor features of each entity are obtained; specifically: using convolution kernels of different sizes to extract the features of the neighbor entities to obtain feature maps of different scales; The feature map is subjected to the maximum pooling operation to obtain the maximum pooling result of each feature map; the maximum pooling result of each feature map is spliced, and the spliced ​​maximum pooling result is input to the fully connected layer to obtain the neighbor feature ;
[0037] Integrate the neighbor features of each entity with the corresponding entity to obtain the updated entity;
[0038] The head entity and tail entity of the triplet in the support set and the query set are spliced ​​to obtain the support entity pair and the query entity pair; wherein, the query set includes a positive sample query set and a negative sample query set;
[0039] Calculate the similarity between the supporting entity pair and the query entity pair according to the supporting entity pair and the query entity pair;
[0040] Calculate the loss function according to the similarity between the support entity pair and the positive sample query entity pair and the similarity between the support entity pair and the negative sample query entity pair, and adjust the neighbor encoder parameters according to the loss function. When the loss function is the smallest, the trained neighbors are obtained. Encoder.
[0041] The process of evaluating the interpretability of a few-shot relational prediction model includes the following:
[0042] S1: Define the evaluation index of the model, including the first evaluation index Hit@n and the second evaluation index MRR;
[0043] Knowledge Graph (Knowledge Graph) is an important branch technology of artificial intelligence. It is a structured semantic knowledge base that is used to describe concepts and their interrelationships in the physical world in symbolic form. Its basic unit is "entity-relationship-entity". Triples, as well as entities and their related attribute-value pairs, entities are connected to each other through relationships to form a networked knowledge structure.
[0044] K triples are randomly selected from the knowledge graph and the K triples are used as the support set, and the remaining triples are used as the query set.
[0045] For each query triple q i , if the score of its correct tail entity is ranked in the top n, then add one count (i=i+1), and the ratio of the count to the number of all query triples is hit@n (assuming the query set is Q) ; The calculation formula of the first evaluation index Hit@n is:
[0046]
[0047]Among them, i represents the number of query triples ranked in the top n by the score of the correct tail entity, and |Q| represents the number of triples in the query set.
[0048] For each query triple q i , and the score result of its correct tail entity is ranked k in the candidate entity list i , then the Reciprocal Rank (RR) score is counted as 1/k i , average the RR scores of all query triples query; the calculation formula of the second evaluation index MRR is:
[0049]
[0050] Among them, N represents the correct number of tail entities for query triples.
[0051] S2: Input data of different data amounts and data contents into the trained few-sample relationship prediction model and comparison model to obtain relationship prediction results; calculate the evaluation indicators of the few-sample relationship prediction model and the comparison model according to the relationship prediction results.
[0052] In some embodiments of the present invention, the comparison models are the GMatchin model, the MetaR model, and the FAAN model.
[0053] GMatchin is the first embedding-based method to propose and solve the few-shot learning problem in the knowledge graph domain. It applies the local graph structure to generate neighbor codes to strengthen the embedding representation of entity pairs, and applies a multi-step matching mechanism for similarity calculation.
[0054] MetaR is a model-based optimization method. It realizes few-shot relation prediction of knowledge graph by transferring shared knowledge from reference entity pair to query entity pair (ie relation), and the model applies gradient descent strategy for parameter update.
[0055] FAAN is an embedding-based method. It proposes an adaptive neighbor encoding and adaptive matching mechanism. In the encoding process, all neighbors are not regarded as equally important, but an attention mechanism is added. According to the correlation between the reference triplet and the current task To distinguish weights, dynamically obtain neighbor codes.
[0056] Input different amounts of data into the trained few-sample relationship prediction model and comparison model, and analyze the impact of different amounts of data on the model; for the case where the training is based on tasks, the training data is divided by tasks. , using the number of tasks to represent the amount of input. During the analysis, by comparing the evaluation indicators MRR and Hit@n under different data amounts, the impact of the data on the MetaR, GMatching, FAAN, and MEEN models is obtained; in some embodiments, the NELL data set and WiKi data are used. Sets are input into the trained few-sample relationship prediction model and comparison model with different data volumes, and the input data volume is adjusted regularly from the largest scale down, and the interval should not be too large or too small; different few-sample relationship prediction models The evaluation results under different data amounts are shown in Table 1:
[0057] Table 1 Evaluation results of different few-sample relationship prediction models under different data volumes
[0058]
[0059] Input data of different data content into the trained few-sample relation prediction model and comparison model, different data content includes entity, neighbor information, and mixed data of entity and neighbor information; design comparative experiments to analyze the impact of different data content on model performance , use E-O (Entity-O) to represent only the data represented by the entity, use N-O (Neighbor-O) to represent only the data of the neighbor structure, and use ALL to represent the two kinds of data. By comparing different types of data separately and combining the two types of data, the evaluation results of the models under different data contents are obtained, and the influence of the data contents on the comparative models is analyzed according to the evaluation results; The following evaluation results are shown in Table 2:
[0060] Table 2 Evaluation results of different few-sample relationship prediction models under different data content
[0061]
[0062] S3: Input the same data, change the hyperparameters of the convolutional neural network in the few-sample relationship prediction model, and obtain the relationship prediction result; calculate the evaluation index of the few-sample relationship prediction model according to the relationship prediction result.
[0063] Hyperparameters of convolutional neural networks include kernel size, number of kernels, activation function, pooling strategy, and regularization.
[0064] The effect of convolution kernel size:
[0065] The core of the convolutional neural network is the convolution operation, so the influence of the size and number of the convolution kernel that plays a key role in the convolution operation on the model is analyzed. The present invention applies one-dimensional convolution, and when considering setting the size of the convolution kernel, the dimension is the same as that of the entity embedding, and experiments are carried out on two data sets respectively. Analyze the MRR values ​​of the two datasets under different convolution kernel sizes, and determine the optimal size of a single convolution kernel in the two datasets by observing the experimental results. The evaluation results of the MFEN model under different convolution kernel sizes are shown in Table 3:
[0066] Table 3 Evaluation results of the MFEN model under different convolution kernel sizes
[0067]
[0068] Exploring the MRR values ​​for kernel sizes near these values ​​based on the optimal kernel size in the dataset is compared with the MRR values ​​using multiple kernel sizes far from these "optimal" values, and the results show that the best convolution kernel size;
[0069] The evaluation results of the MFEN model under different combinations of convolution kernel sizes are shown in Table 4:
[0070] Table 4 Evaluation results of MFEN model under different convolution kernel size combinations
[0071]
[0072] The effect of the number of convolution kernels
[0073] like image 3 As shown in the figure, the influence of different convolution kernel numbers on the model is analyzed. Preferably, the number of convolution kernels is 10, 50, 100, 200, 400 and 600 for experiments to obtain the evaluation results of the model.
[0074] The effect of activation function:
[0075] like Figure 4 As shown, the influence of different activation functions on the model is analyzed. Preferably, the activation functions are respectively selected from ReLU, tanh, Sigmoid, Cube, tanh cube and Iden to conduct experiments to obtain the evaluation results of the model.
[0076] Impact of pooling strategy:
[0077] Fixing the size of the convolution kernels and the number of feature maps in the baseline configuration only changes the pooling strategy. In the baseline configuration, a global 1-max ensemble of feature maps (Fig. 7) is performed to generate a feature vector of length 1 for each convolution kernel. But in addition to the basic max pooling, there are some other strategies, such as the k-max ensemble strategy, which extracts the largest k values ​​from the entire feature map and preserves the relative order of these values. Next, we further consider using average pooling instead of max pooling, keeping the rest of the architecture unchanged; the impact of the pooling strategy on the model is obtained through analysis of the experimental results. The evaluation results of the MFEN model under different pooling strategies are shown in Table 5:
[0078] Table 5 Evaluation results of the MFEN model under different pooling strategies
[0079]
[0080] The effect of regularization:
[0081] The common regularization strategy dropout of CNN is adopted; the dropout rate of the experiment is from 0.0 to 0.9, and the rest of the settings are the same as the baseline configuration. In addition, the model effect obtained without regularization is also recorded, which is represented by 0.0. The dropout rate discussed in the present invention is mainly aimed at the convolutional neural network used in the model, and has no effect on other parts of the model. After analyzing the experimental results, the effect of regularization on the model is obtained; The evaluation results are shown in Table 6:
[0082] Table 6 Evaluation results of the MFEN model under different dropout rates
[0083]
[0084] S4: Analyze the impact of different data volumes, different data contents, and different hyperparameters on the few-sample relationship prediction model according to the evaluation indicators, and obtain interpretable evaluation results of the model.
[0085] Analysis of Table 1 shows that among the comparison models, the GMatching model is the model most affected by the amount of input data, and the MFEN model is the model that is least affected by the amount of input data. This shows that the MFEN model has better stability, regardless of the size of the input data, the performance of the model is relatively more stable, and it is more suitable for the situation of uncertain input data. On the other hand, the performance of FAAN fluctuates greatly depending on the amount of input data, indicating that the model has more advantages in the case of a large number of tasks, and is suitable for a large amount of input data. Models are applicable regardless of the size of the data. But for real-world applications, the scale of data is often uncertain, especially for few-sample tasks, so a model with more stable model performance is more practical.
[0086] Analysis of Table 2 shows that compared with the combination of entities and neighbors, the performance of each model when using entity or neighbor information alone has decreased to varying degrees, which shows that the method of combining entity and neighbor information is effective for few-sample relationship prediction. It is an effective way to improve the effect. By comparing only the entity representation and the neighbor structure alone, it can be found that the overall effect of using entity information alone is better, indicating that the information of the entity itself is indispensable in the few-sample relationship prediction. After combining entity information with neighbors, the neighbor structure can provide more information through multiple neighbors and improve the performance of model decision-making.
[0087] Among the three contrasting models, the MFEN model outperforms the contrasting models in all cases, indicating that the MFEN model adequately learns entity and neighbor information. For neighbor information, the neighbor encoder in the model plays a major role, retaining the part of the neighbor structure related to relationship prediction, eliminating the influence of irrelevant information on decision-making, and improving the accuracy of the model. For the entity itself, the similarity calculator in the model plays a role, and a more accurate and reasonable similarity score is obtained through the combination of multi-angle measures. Therefore, the experimental results prove that the method proposed in the present invention is effective, and for the few-shot relation prediction task, the influence of the entity itself is greater.
[0088]Analysis of Table 3 shows that each dataset has its own optimal convolution kernel size. From the experimental results, it can be found that combining several kernels with sizes close to the optimal single size can improve the performance, but increasing the kernel size far from the optimal range may hurt the performance. As can be seen from Table 4, using (3,4,5), and (2,3,4) and (2,3,4,5) sets close to the optimal single convolution kernel size yields the best results the closest effect. The difference is especially noticeable when compared to other settings such as (5,6,7). Even using only one good kernel size (here 3) gives better performance than combining different kernel sizes (5, 6, 7). Therefore, in some cases, it is better to use multiple different but close to optimal size convolution kernels. From another experimental result of using several convolution kernel sizes on the Wiki dataset in Table 3, it can be concluded that from the performance of a single convolution kernel size, the optimal single convolution kernel size for Wiki is 7. Based on this Table 4 explores the kernel sizes around these values ​​and compares with using multiple kernel sizes far from these “optimal” values, here it can be seen that (6, 7, 8) performs better than ( 2,3,4) and (3,4,5) are good. Thus, the results still show that combinations close to the optimal single kernel size outperform combinations using multiple kernels far from the optimal single kernel size.
[0089] Given these observations, it is known that it is best to first do a thick line search on a single kernel size to find the "best" size for the dataset under consideration, and then explore several kernel sizes around this single optimal size , including combining different kernel sizes and optimal sizes.
[0090] analyze image 3 , in practice the number of feature maps can be set in the range of 100 to 600. Of course, in some cases more than 600 feature maps are possible, given by image 3 It can be seen that the training time required when the number of feature maps is 600 is very long and may not be worth the effort to explore. In practice, it should be considered whether the best experimental results are near the boundary of the number of feature maps, and if the best results are produced at the boundary, it may be worth exploring beyond that boundary.
[0091] analyze Figure 4 , the experimental results show that in some cases a linear transformation is sufficient to capture the correlation between entity pair embeddings and relations. However, if there are multiple hidden layers, Iden may not be as suitable as a nonlinear activation function. Therefore, regarding the choice of activation function in single-layer CNN, it is recommended to choose ReLU and tanh according to the experimental results, and Iden can be tried in some cases.
[0092] Analyzing Table 5, the experimental results show that average pooling performs consistently worse than max pooling on the two datasets used for experiments. The model observed a large drop in performance and very slow running time under average pooling. An experimental analysis of pooling strategies shows that 1-max pooling consistently performs better than other strategies in the few-shot relation meta-prediction task. This may be because the location of the predictive context does not matter, and some n-grams in the neighbor structure may themselves be more predictive than all neighbors considered together.
[0093] Analyzing Table VI, the experimental results show that the dropout on the convolutional layer does not help the performance very much, while the large dropout rate greatly impairs the performance, and the MRR decreases with the dropout rate. Experimental results demonstrate that dropout has no beneficial effect on the performance proposed by the present invention. This observation can be attributed to the fact that a single-layer CNN has a smaller number of parameters than a multi-layer deep learning model. Another possible explanation is that using word embeddings helps prevent overfitting. However, it is also not advisable to abandon regularization entirely. In the actual application process, it is recommended to set the dropout rate to a small value (0.0-0.5), while increasing the number of feature maps to see if more features will help. When further increasing the number of feature maps seems to degrade performance, it may be worth increasing the dropout rate.
[0094] The invention selects a variety of comparison models, calculates the evaluation index by changing the data volume and data content of the few-sample relationship prediction model and the comparison model, and analyzes the influence of different data volumes and different data content on the models; The hyperparameters of the convolutional neural network, such as activation function, pooling strategy, regularization, etc., calculate the evaluation indicators and analyze the influence of the hyperparameters on the model; according to the analysis results, the interpretable results of the few-sample relationship prediction model are obtained, and the improvement is less according to the interpretable results. The sample relationship prediction model; the invention improves the reliability of the relationship prediction result of the model, has high practicability, and has a good application prospect.
[0095] The above-mentioned embodiments further describe the purpose, technical solutions and advantages of the present invention in detail. It should be understood that the above-mentioned embodiments are only preferred embodiments of the present invention, and are not intended to limit the present invention. Any modification, equivalent replacement, improvement, etc. made to the present invention within the spirit and principle of the present invention shall be included within the protection scope of the present invention.

PUM

no PUM

Description & Claims & Application Information

We can also present the details of the Description, Claims and Application information to help users get a comprehensive understanding of the technical details of the patent, such as background art, summary of invention, brief description of drawings, description of embodiments, and other original content. On the other hand, users can also determine the specific scope of protection of the technology through the list of claims; as well as understand the changes in the life cycle of the technology with the presentation of the patent timeline. Login to view more.

Similar technology patents

Screen picture interception method and device, watermark adding method and device, equipment and medium

InactiveCN109828810Aincrease credibilityAvoid fake screenshots
Owner:BEIJING DAJIA INTERNET INFORMATION TECH CO LTD

Method for establishing prawn virus infection model

Owner:EAST CHINA SEA FISHERIES RES INST CHINESE ACAD OF FISHERY SCI

Classification and recommendation of technical efficacy words

  • increase credibility
  • Improve practicality

Air cleaner testing device and testing method thereof

ActiveCN103091121Aincrease credibility
Owner:ZHEJIANG ERMA ENVIRONMENT TECH CO LTD

Digitalized method for magnetic resonance perfusion imaging

Owner:INST OF AUTOMATION CHINESE ACAD OF SCI

X-ray sample image generation method, X-ray sample image generation equipment and storage device

ActiveCN111242905AAvoid black lumpsincrease credibility
Owner:科大讯飞(苏州)科技有限公司

Device and method for constructing self-adaptive graphic user interface (GUI)

ActiveCN102193786ASolve control intersection and information truncation problemsImprove practicality
Owner:INDUSTRIAL AND COMMERCIAL BANK OF CHINA

Photographing method and terminal

Owner:GUANGDONG OPPO MOBILE TELECOMM CORP LTD
Why Eureka
Try Eureka