Methods and systems for visualizing mobile terminal network conditions

a mobile terminal and network condition technology, applied in the field of communication systems, can solve the problems of complex troubleshooting of mobile terminal network performance problems, affecting the network performance of mobile terminals, etc., and achieve the effect of improving the troubleshooting of complex systems and facilitating the isolation of end user performance issues

Active Publication Date: 2020-03-24
VIASAT INC
View PDF15 Cites 11 Cited by
  • Summary
  • Abstract
  • Description
  • Claims
  • Application Information

AI Technical Summary

Benefits of technology

[0008]The methods and systems disclosed improve troubleshooting of these complex systems by providing a visualized presentation of one or more mobile terminals and in some cases one or more coverage areas for corresponding access networks. In some aspects, separate icons representing a mobile terminal and a coverage area for its respective access network are simultaneously provided for display on an electronic display. A map of a geographic region may also be provided for display on the electronic display. The icons may be displayed at map positions representing the geographic locations of the respective mobile terminals and access networks. The mobile terminal icon representing the mobile terminal may include a feature that indicates a status of a communication link connecting the mobile terminal to the access network. For example, if the communication link performance is nominal, the icon may be green, whereas if the communication link is experiencing issues, the icon may be yellow or red. In some aspects, hovering over the icon may display a window including a first level of detail of communication status metrics associated with the communication link. Clicking on the icon may display a window including a second level of detail of communication status metrics associated with the communication link.
[0009]The coverage area icon may include a geographic boundary of a carrier (e.g., a satellite spot beam) serviced by the access network. For example, the coverage area icon may overlay geographic points at which service is available via the carrier, but not overlay a second set of geographic points outside coverage of the carrier. The coverage area icon may include a feature that indicates a status of the carrier. In some aspects, this feature may be based on network performance data of the coverage area, such as being based on network performance experienced by two or more mobile terminals within the coverage area and using the carrier. The coverage area icon may also use green / yellow / and red colors in some aspects (and / or other features) to indicate the network performance of the access network. By visualizing both communication status at the mobile terminal and separately communication status within a coverage area of an access network on a single electronic display, a troubleshooter may more easily isolate an end user performance issue as either mobile terminal or access network related.
[0010]Some aspects may further provide for display one or more prior location icons (“breadcrumbs”) associated with the mobile terminal. The portion of the prior location icon on the map may indicate prior locations of the mobile terminal along a route of travel (also referred to herein as a “transit route”). The prior location icon may be associated with communication link performance data the mobile terminal was at the location represented by the prior location icon. A feature (e.g., color, shape, etc.) of the prior location icon may indicate status of the link performance data when the mobile terminal was at the location represented by the prior location icon. By selecting (e.g., by clicking and / or hovering) on the prior location icon, one or more of the performance link performance data may be displayed. Thus, a troubleshooter may not only examine a most recent communication link status, but may easily review communication link status when a mobile terminal was at a particular prior location, for example, a location within a coverage area of a particular access network, that might be under suspicion for having a performance issue.

Problems solved by technology

For example, there may be an issue with the two-way communications system within the mobile terminal itself that affects the network performance the mobile terminal experiences.
Therefore, troubleshooting network performance problems experienced by a mobile terminal may be a complex undertaking, given that the mobile terminal's service performance may relate to conditions within the mobile terminal itself, and / or conditions within the access network utilized by the mobile terminal as it moves across a geographic area.

Method used


Image

  • Methods and systems for visualizing mobile terminal network conditions
  • Methods and systems for visualizing mobile terminal network conditions
  • Methods and systems for visualizing mobile terminal network conditions

Examples


Embodiment Construction

[0022]In the following description, numerous specific details are set forth to provide a thorough understanding of the present disclosure. However, one having ordinary skill in the art should recognize that the disclosure can be practiced without these specific details. In some instances, circuits, structures, and techniques have not been shown in detail to avoid obscuring the present disclosure.

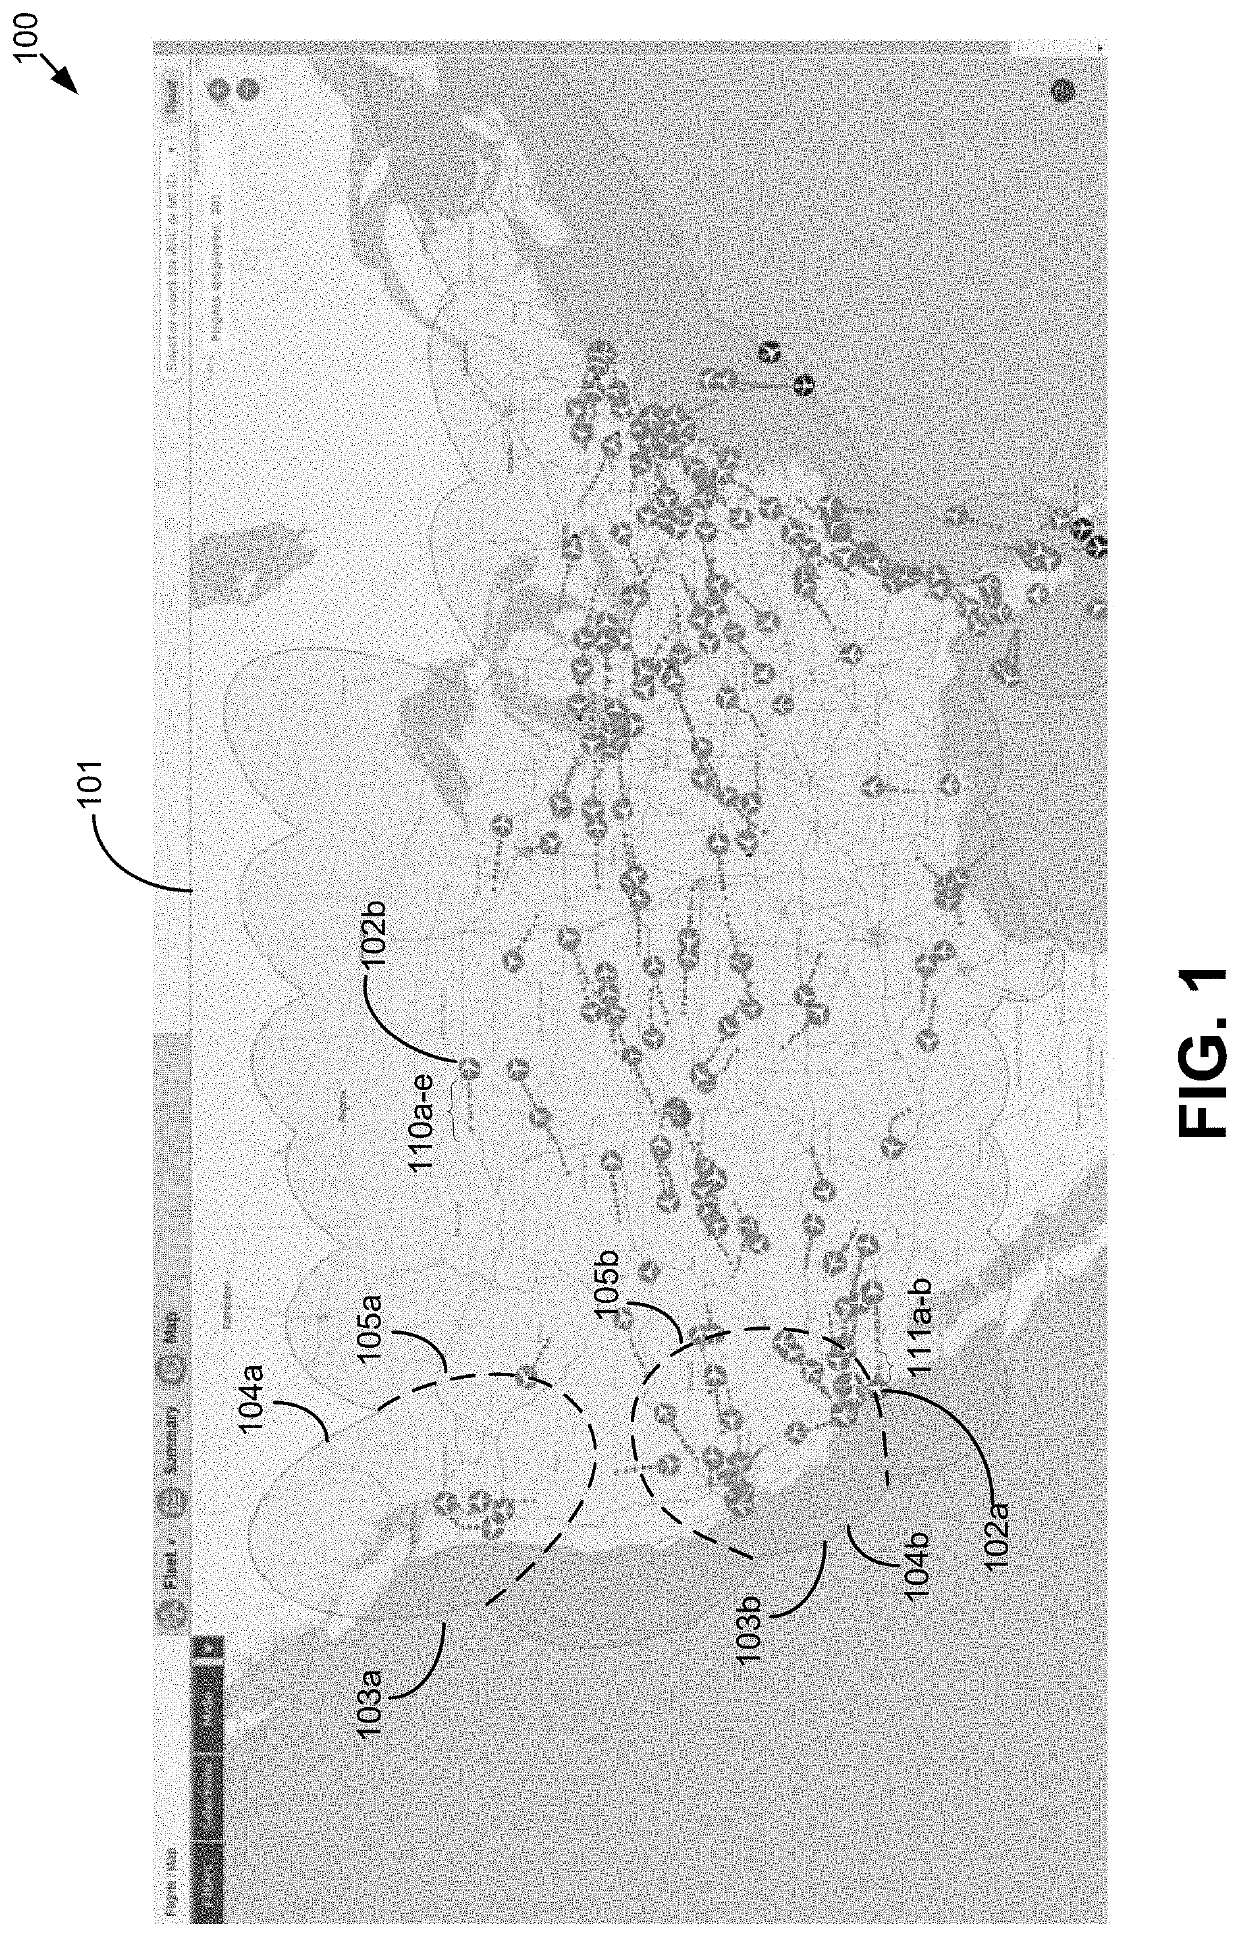
[0023]FIG. 1 is a visualization of network conditions of a plurality of mobile terminals in one exemplary embodiment. The visualization 100 includes a map 101, in this case, a map of the continental United States. Overlaid on the map 101 are a plurality of mobile terminal icons, a subset of which are identified by icons 102a-b. In the illustrated embodiment, the mobile terminals are aircraft. Alternatively, other and / or additional types of mobile terminals may be included such as trains, cruise ships, etc.

[0024]The icons representing the mobile terminals 102a-b may include an indication of p...


PUM


Abstract

Methods and systems for visualization of mobile terminal communication link status are disclosed. In some aspects, one or more mobile terminal icons are provided for display on a map of a geographic area at map locations representing geographic locations of the mobile terminals. Coverage area icons of one or more network services are also displayed on the map. Features of the mobile terminal and coverage area icons indicate a network status of the respective terminals and coverage areas. In some aspects, prior location icons representing prior locations of the mobile terminal(s) are displayed on the map. In some of these aspects, clicking or hovering on the prior location icons provides for display, link performance data when the corresponding mobile terminal was at the geographic location represented by the prior location icon.

Description

CROSS-REFERENCE TO RELATED APPLICATIONS[0001]This application claims priority to U.S. Provisional Application No. 62 / 378,127, titled “Methods and Systems for Visualizing Mobile Terminal Network Conditions”, filed 22 Aug. 2016, which is incorporated by reference herein.BACKGROUND[0002]Embodiments relate generally to communications systems, and, more particularly, to improved methods and systems for visualizing network conditions of mobile communication terminals.[0003]Communication networks providing mobile terminal access to communications are increasing in complexity. Many communication networks may rely on many carriers (e.g., satellite beams of a multi-beam satellite system), with each carrier providing network services to a set of sometimes overlapping geographic coverage areas.[0004]As a mobile terminal moves across a geographic region, service provided to the mobile terminal may also vary over time. In some cases, this variability may relate to the mobile terminal itself, for ...

Claims


Application Information

Patent Timeline
Patent Type & Authority Patents(United States)
IPC IPC(8): G06F3/048H04L12/26H04L12/24G06F3/0484H04W24/02H04W24/08G06F3/0481G06T17/05G06T15/80
CPCH04L41/12G06T17/05G06F3/04842H04L43/0817G06T15/80H04L41/22H04W24/08H04L43/045H04W24/02G06F3/04817H04L43/08
Inventor HASHMI, SHAMEEMLALA, SANJAY VVRETTAS, MELANIE
Owner VIASAT INC
Why Eureka
Try Eureka