Whole cell circular delta viewer and navigator

a navigator and viewer technology, applied in the field of simulation system of cell processes, can solve the problems of overwhelming visualizing and presenting all simulation data for all the different types of data, and might arise challenges, so as to facilitate visualizing, ease in observing, and ease in visualizing

Active Publication Date: 2020-11-17
X DEV LLC
View PDF9 Cites 0 Cited by
  • Summary
  • Abstract
  • Description
  • Claims
  • Application Information

AI Technical Summary

Benefits of technology

[0005]The circular viewer provides ease in observing effects of the simulation in the simulation data. The circular viewer may visually distinguish interesting simulation data that is above a threshold differential from the baseline cell state. As the simulation data is grouped into different biological categories which are then separately displayed in the circular graphical elements, the visually distinguished simulation data over all the circular graphical elements provide an ease in visualizing correlative simulation data over the various biological categories. As one example, the circular viewer may provide an ease in observing an upregulation of protein production correlated with an upregulation of a gene expression. Moreover, in embodiments where the circular viewer may update to display simulation data over different time steps in the simulation, the circular viewer provides ease in comparing effects of the simulation over the simulation's run time. In one example, the circular viewer may display a long term effect of an upregulation of a specific gene as downregulation of a metabolic process. Upon viewing the circular viewer, the user may learn interesting correlations in the simulation data through observing which portions of the simulation data are visually distinguished by the circular viewer. The user may focus further experimentation, either in silico or in vivo / in vitro using wet lab, due to the newly observed portions of simulation data. In some instances, the user may follow up with adjusting simulation parameters to narrow the simulation for studying the newly learned correlations corresponding to visually distinguished simulation data.
[0006]As a result of the specific construction of the circular viewer and the information presented, a user may have an insight that leads to a new or further simulation being performed. Additionally, insight garnered from the circular viewer may allow for specification of an in vitro or in vivo experiment to be performed in a web lab (e.g., using cell cultures). This may be the case, for example, for target identification or compound (hit) evaluation for a drug discovery process. Additionally, the circular viewer may prevent unneeded simulations. Due to the multitude of data synthesized by the circular viewer, unneeded simulations may be avoided where the data was present in an already performed simulation, where the desired information was not identified by the user due to the unstructured and sprawling nature of the simulation data in the absence of the circular viewer. Reducing the number of in silico simulations and resulting number of datasets produced by the simulations may then correspond to a reduction of the parameter space of the web lab tests. Wet lab tests are costly in terms of employee time, physical resources required, physical space, and so on. Any reduction in the parameter space of wet lab evaluation would generate tangible benefits in this regard.

Problems solved by technology

A challenge arises in displaying all the simulation data for a user in an efficient fashion.
Visualizing and presenting all simulation data for all the can be overwhelming.
Still more challenging is presenting simulation data of significance to a user of the simulation system.
Likewise there is a challenge of presenting items of the simulations which might be correlative, such as related reactions, related reactants, related products, etc.
Another challenge might arise when the user attempts to compare different simulations against one another as the amount of data grows multiplicatively.
Wet lab tests are costly in terms of employee time, physical resources required, physical space, and so on.

Method used


Image

  • Whole cell circular delta viewer and navigator
  • Whole cell circular delta viewer and navigator
  • Whole cell circular delta viewer and navigator

Examples


Embodiment Construction

I. Simulation Model of a Simulation

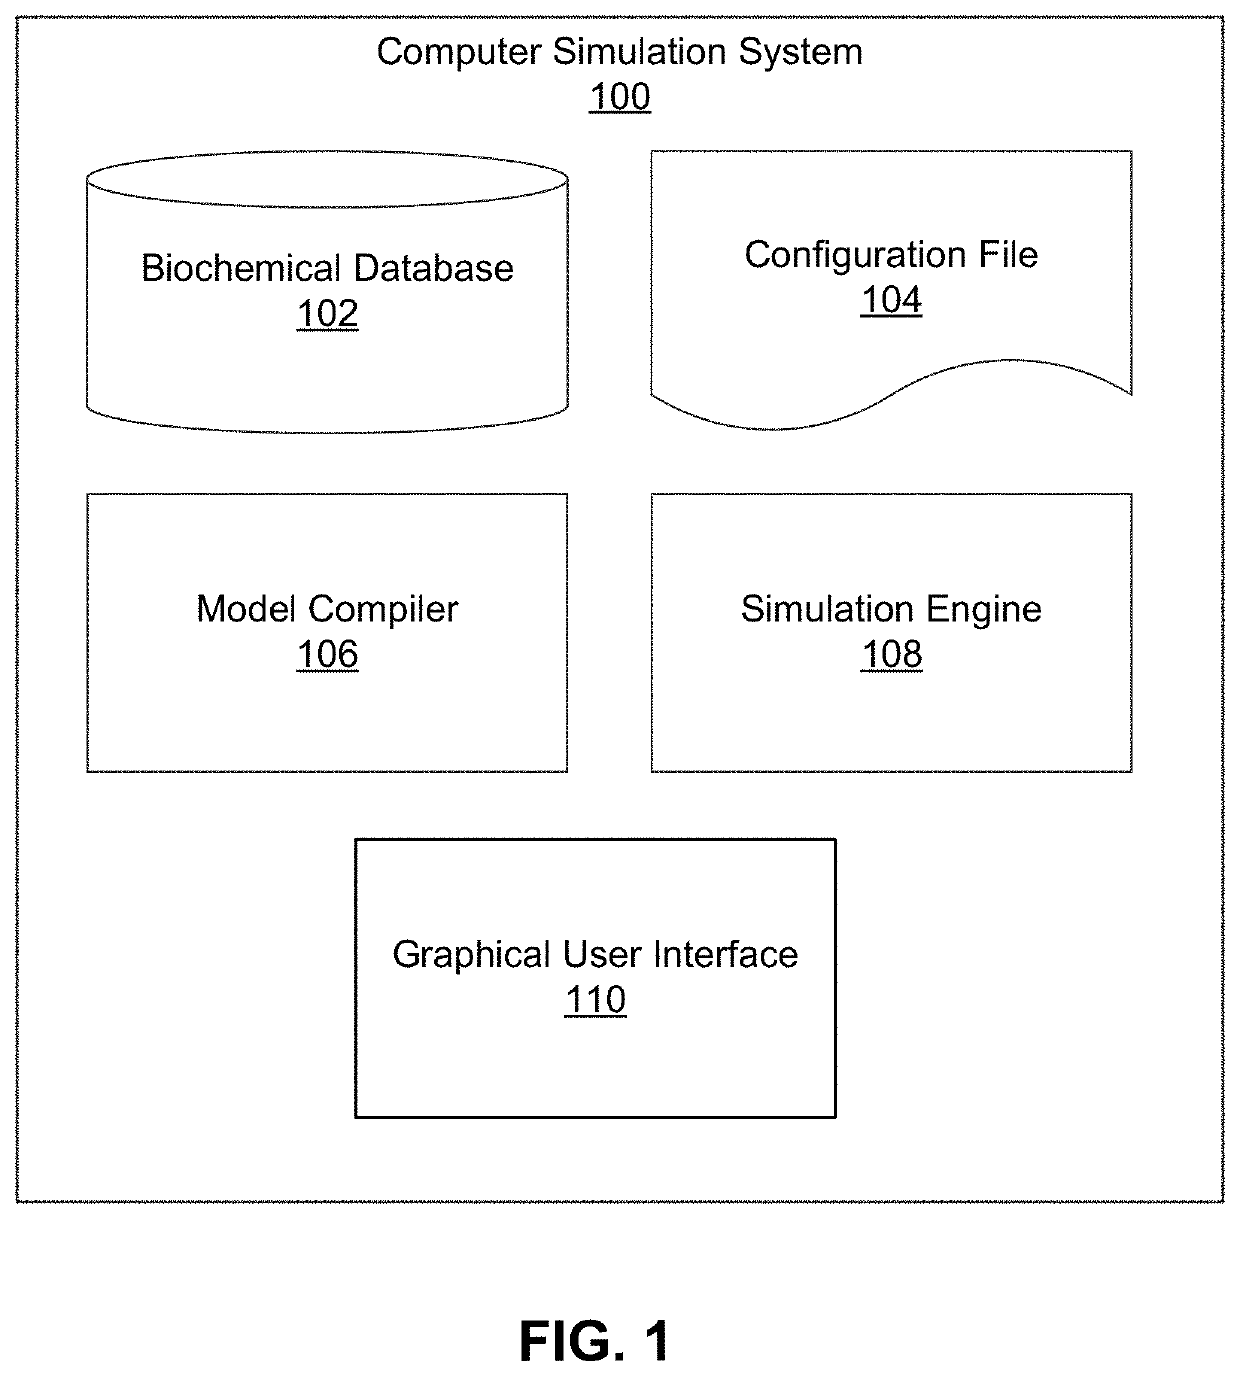
[0026]FIG. 1 is a block diagram illustrating computational components of a computer simulation system 100 (herein referred to as simply “simulation system”) for modeling the behavior of a biological cell, in accordance with an embodiment. Depending on the embodiment, each component of the simulation system 100 may be implemented on one or more servers or other computational devices that are configured to communicate over a network (e.g. the Internet, a local area network, etc.). Alternatively, all computational components may be locally present on a single computational device. The computational components making up the simulation system 100 shown in FIG. 1 are a biochemical database 102, a working data file 104, a model compiler 106, a simulation engine 108, and a GUI 110. The GUI 110 may be the GUI 1200, and is described in further detail with reference to FIG. 12.

[0027]The biochemical database 102 is a database that stores data regarding molecul...


PUM


Abstract

After running a simulation on a biological cell, a simulation system displays a circular viewer for presenting simulation data. The circular viewer is a graphical element which contains a plurality of circular graphical elements, wherein each circular graphical element displays simulation data of one biological category ordered around the circular graphical element. Responsive to a user input, the circular viewer updates the circular graphical elements to visually indicate subsets of simulation data in each graphical element that are above a threshold differential from a baseline cell state of the biological cell. The circular viewer may additionally display connectors linking portions of simulation data from different circular graphical elements. Moreover, the circular viewer may update to display simulation data in the circular graphical elements over a plurality of time steps over which the simulation has occurred.

Description

BACKGROUNDField of Art[0001]This disclosure generally relates to a simulation system of cell processes displaying simulation data of different cell reaction networks.Description of the Related Art[0002]A simulation system may perform an experiment which runs one or more simulations on a model system of a cell. Simulation parameters may include reactants, amount of reactants, gene mutation, gene knockout, timing, availability of enzymes, etc. The result of each simulation is simulation data which describes the cell's state throughout the simulation. The model cell's state may comprise amount of molecules, reaction rates, and so on.[0003]A challenge arises in displaying all the simulation data for a user in an efficient fashion. At each stage of the simulation, the simulation system may keep counts of intermediary reactants, products, reactant rates, etc. Visualizing and presenting all simulation data for all the can be overwhelming. Still more challenging is presenting simulation dat...

Claims


Application Information

Patent Timeline
Patent Type & Authority Patents(United States)
IPC IPC(8): G16B5/00G06F3/0481G16B30/00G06F3/0484G16B45/00
CPCG06F3/04847G06F3/0481G16B5/00G16B45/00G16B30/00G06F3/0484
Inventor JESSEN, JOHANGRUBISIC, IVANSIBIGTROTH, MATTHEW
Owner X DEV LLC
Why Eureka
Try Eureka