
Traffic safety prediction model

a traffic safety and model technology, applied in the field of mathematical annual accidental and severity prediction models, can solve the problems of no model capable of forecasting future accidents, no sensitive method of reasonably predicting accident expectancies, and the complexity of the problem of reasonable prediction accident expectancies becomes even more complex, so as to reduce the development of hazardous safety levels

Inactive Publication Date: 2002-06-27
KAUB ALAN R
View PDF0 Cites 91 Cited by
  • Summary
  • Abstract
  • Description
  • Claims
  • Application Information

AI Technical Summary

Benefits of technology

[0015] The object of the present invention is to provide for traffic engineering and transportation planning professionals a mathematical model to examine the existing hazard levels of highway intersections and routes, and for designing safety into intersection and highway route project design before construction by accurately estimating the annual accident and severity effects of alternative intersection designs and highway route intersection spacing strategies to provide for optimal safety and minimize the development of hazardous safety levels within the design life of the highway intersection or route project.
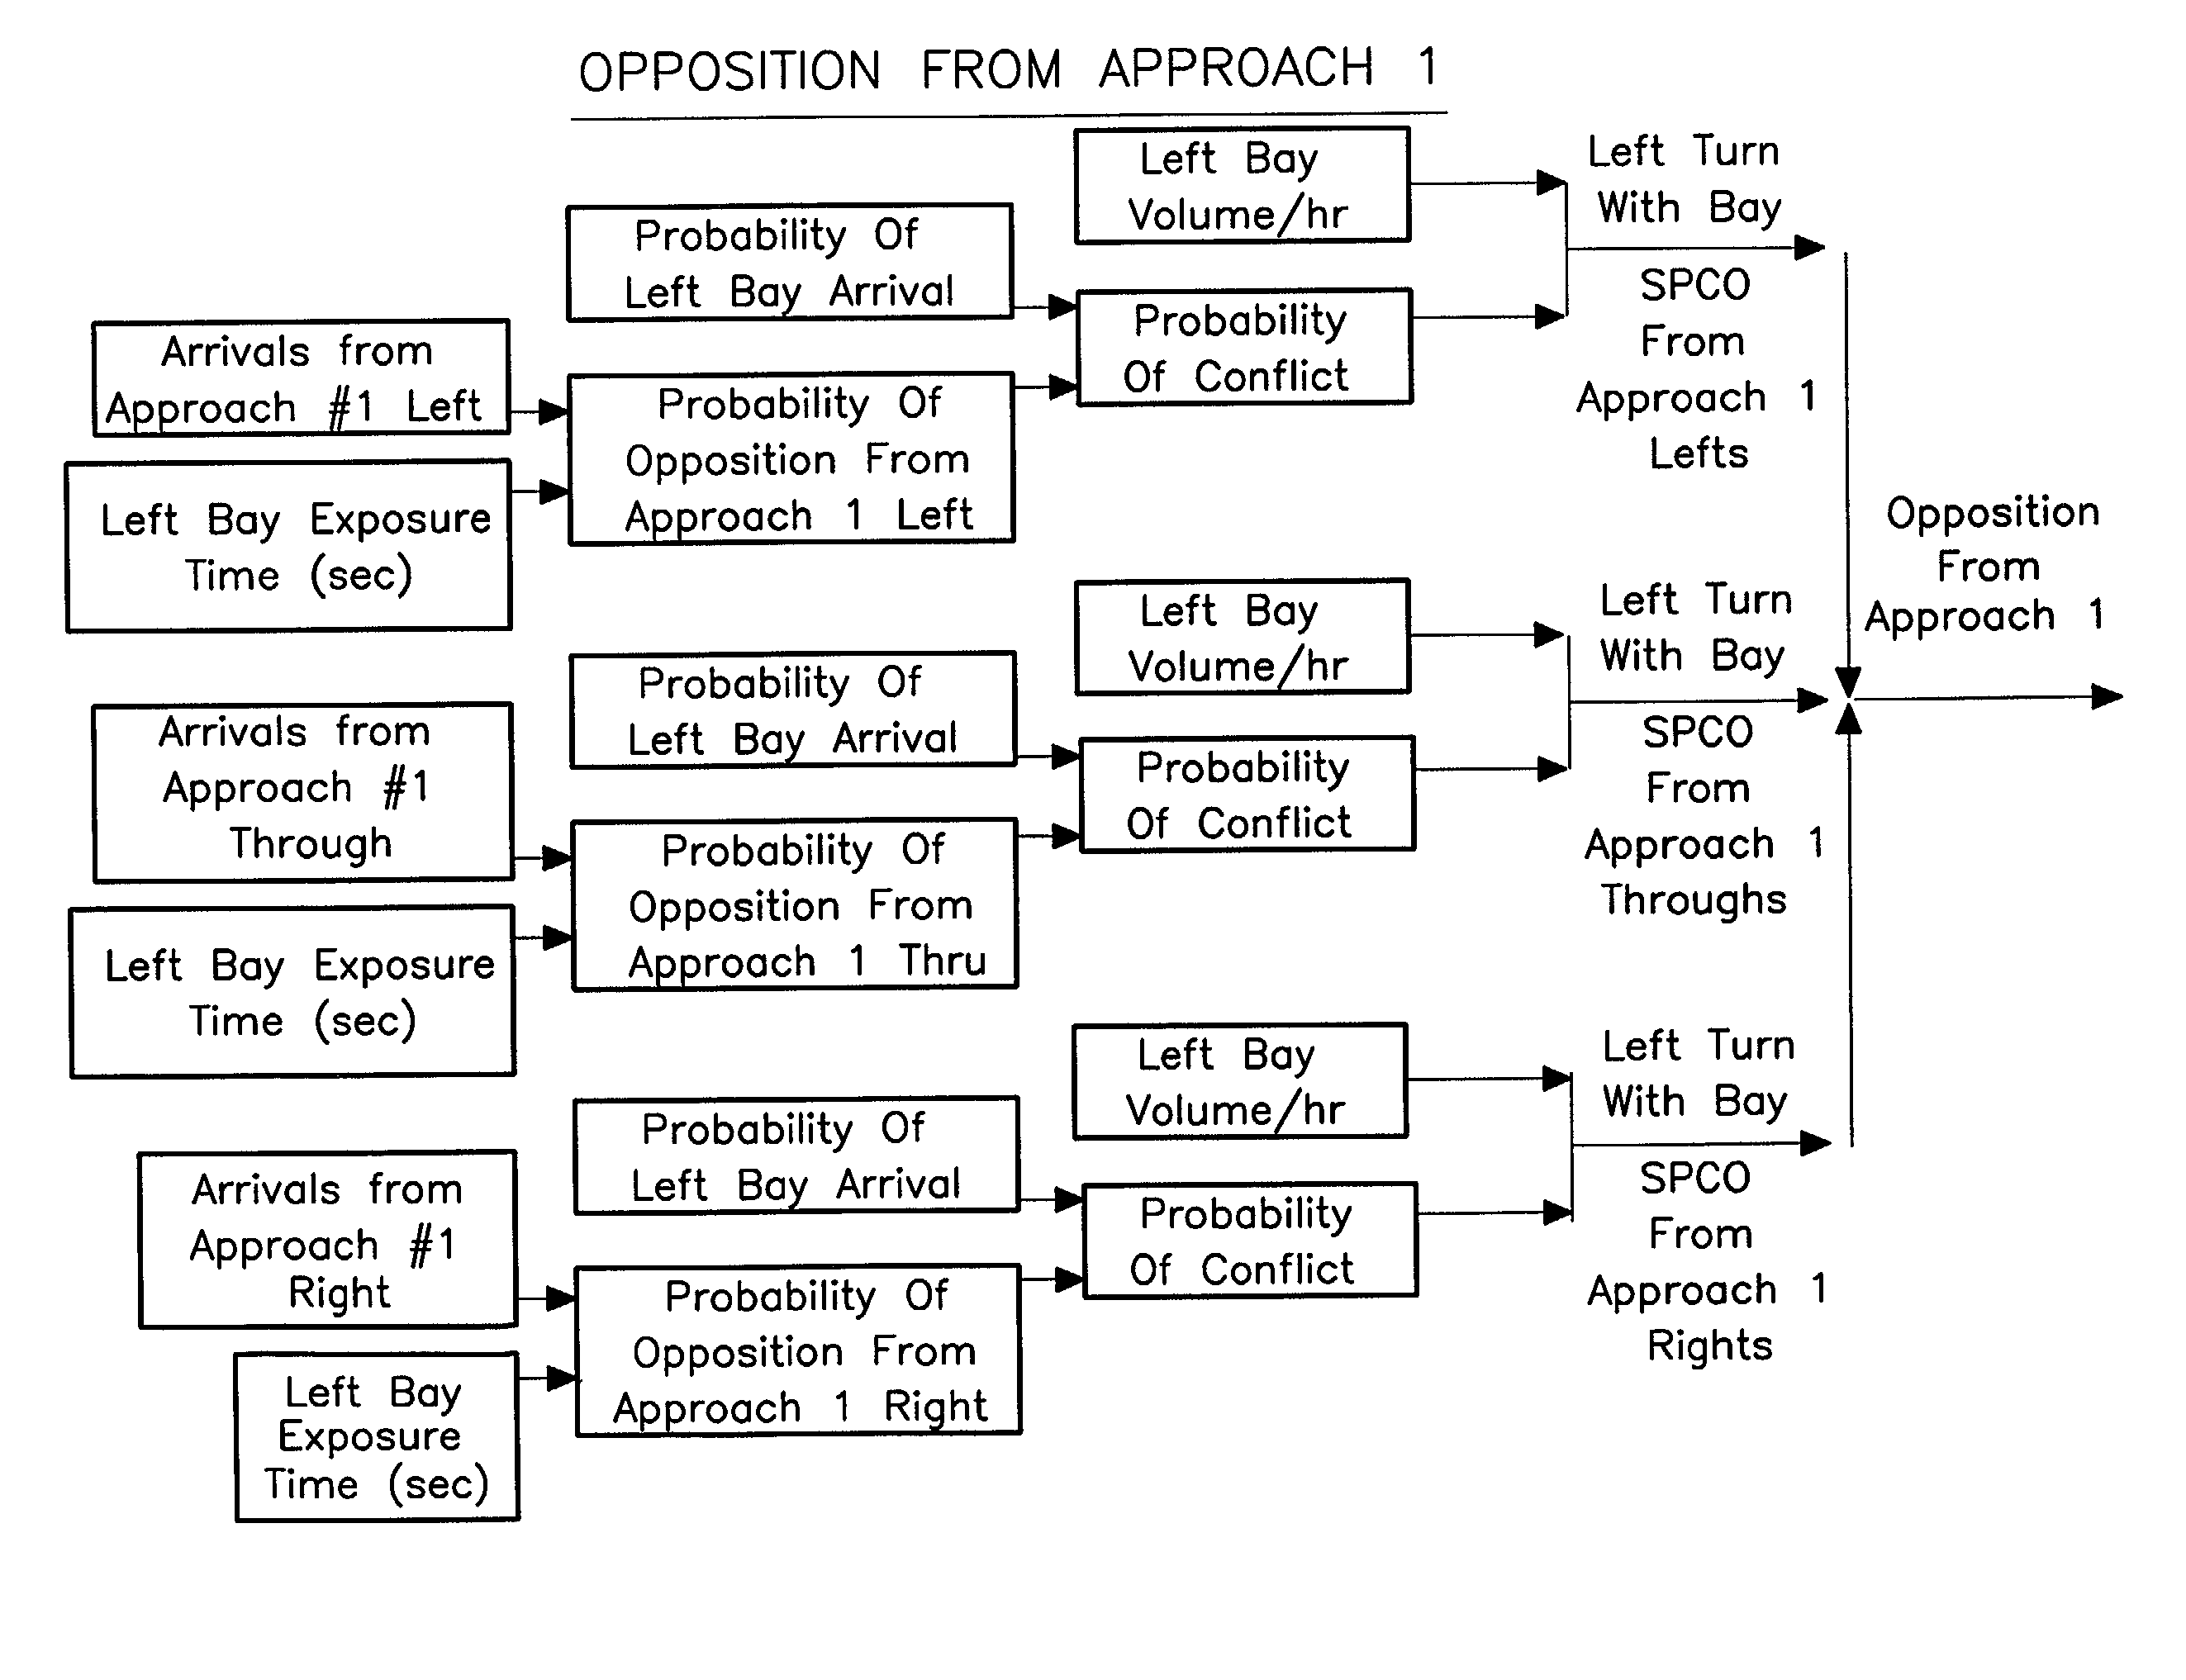
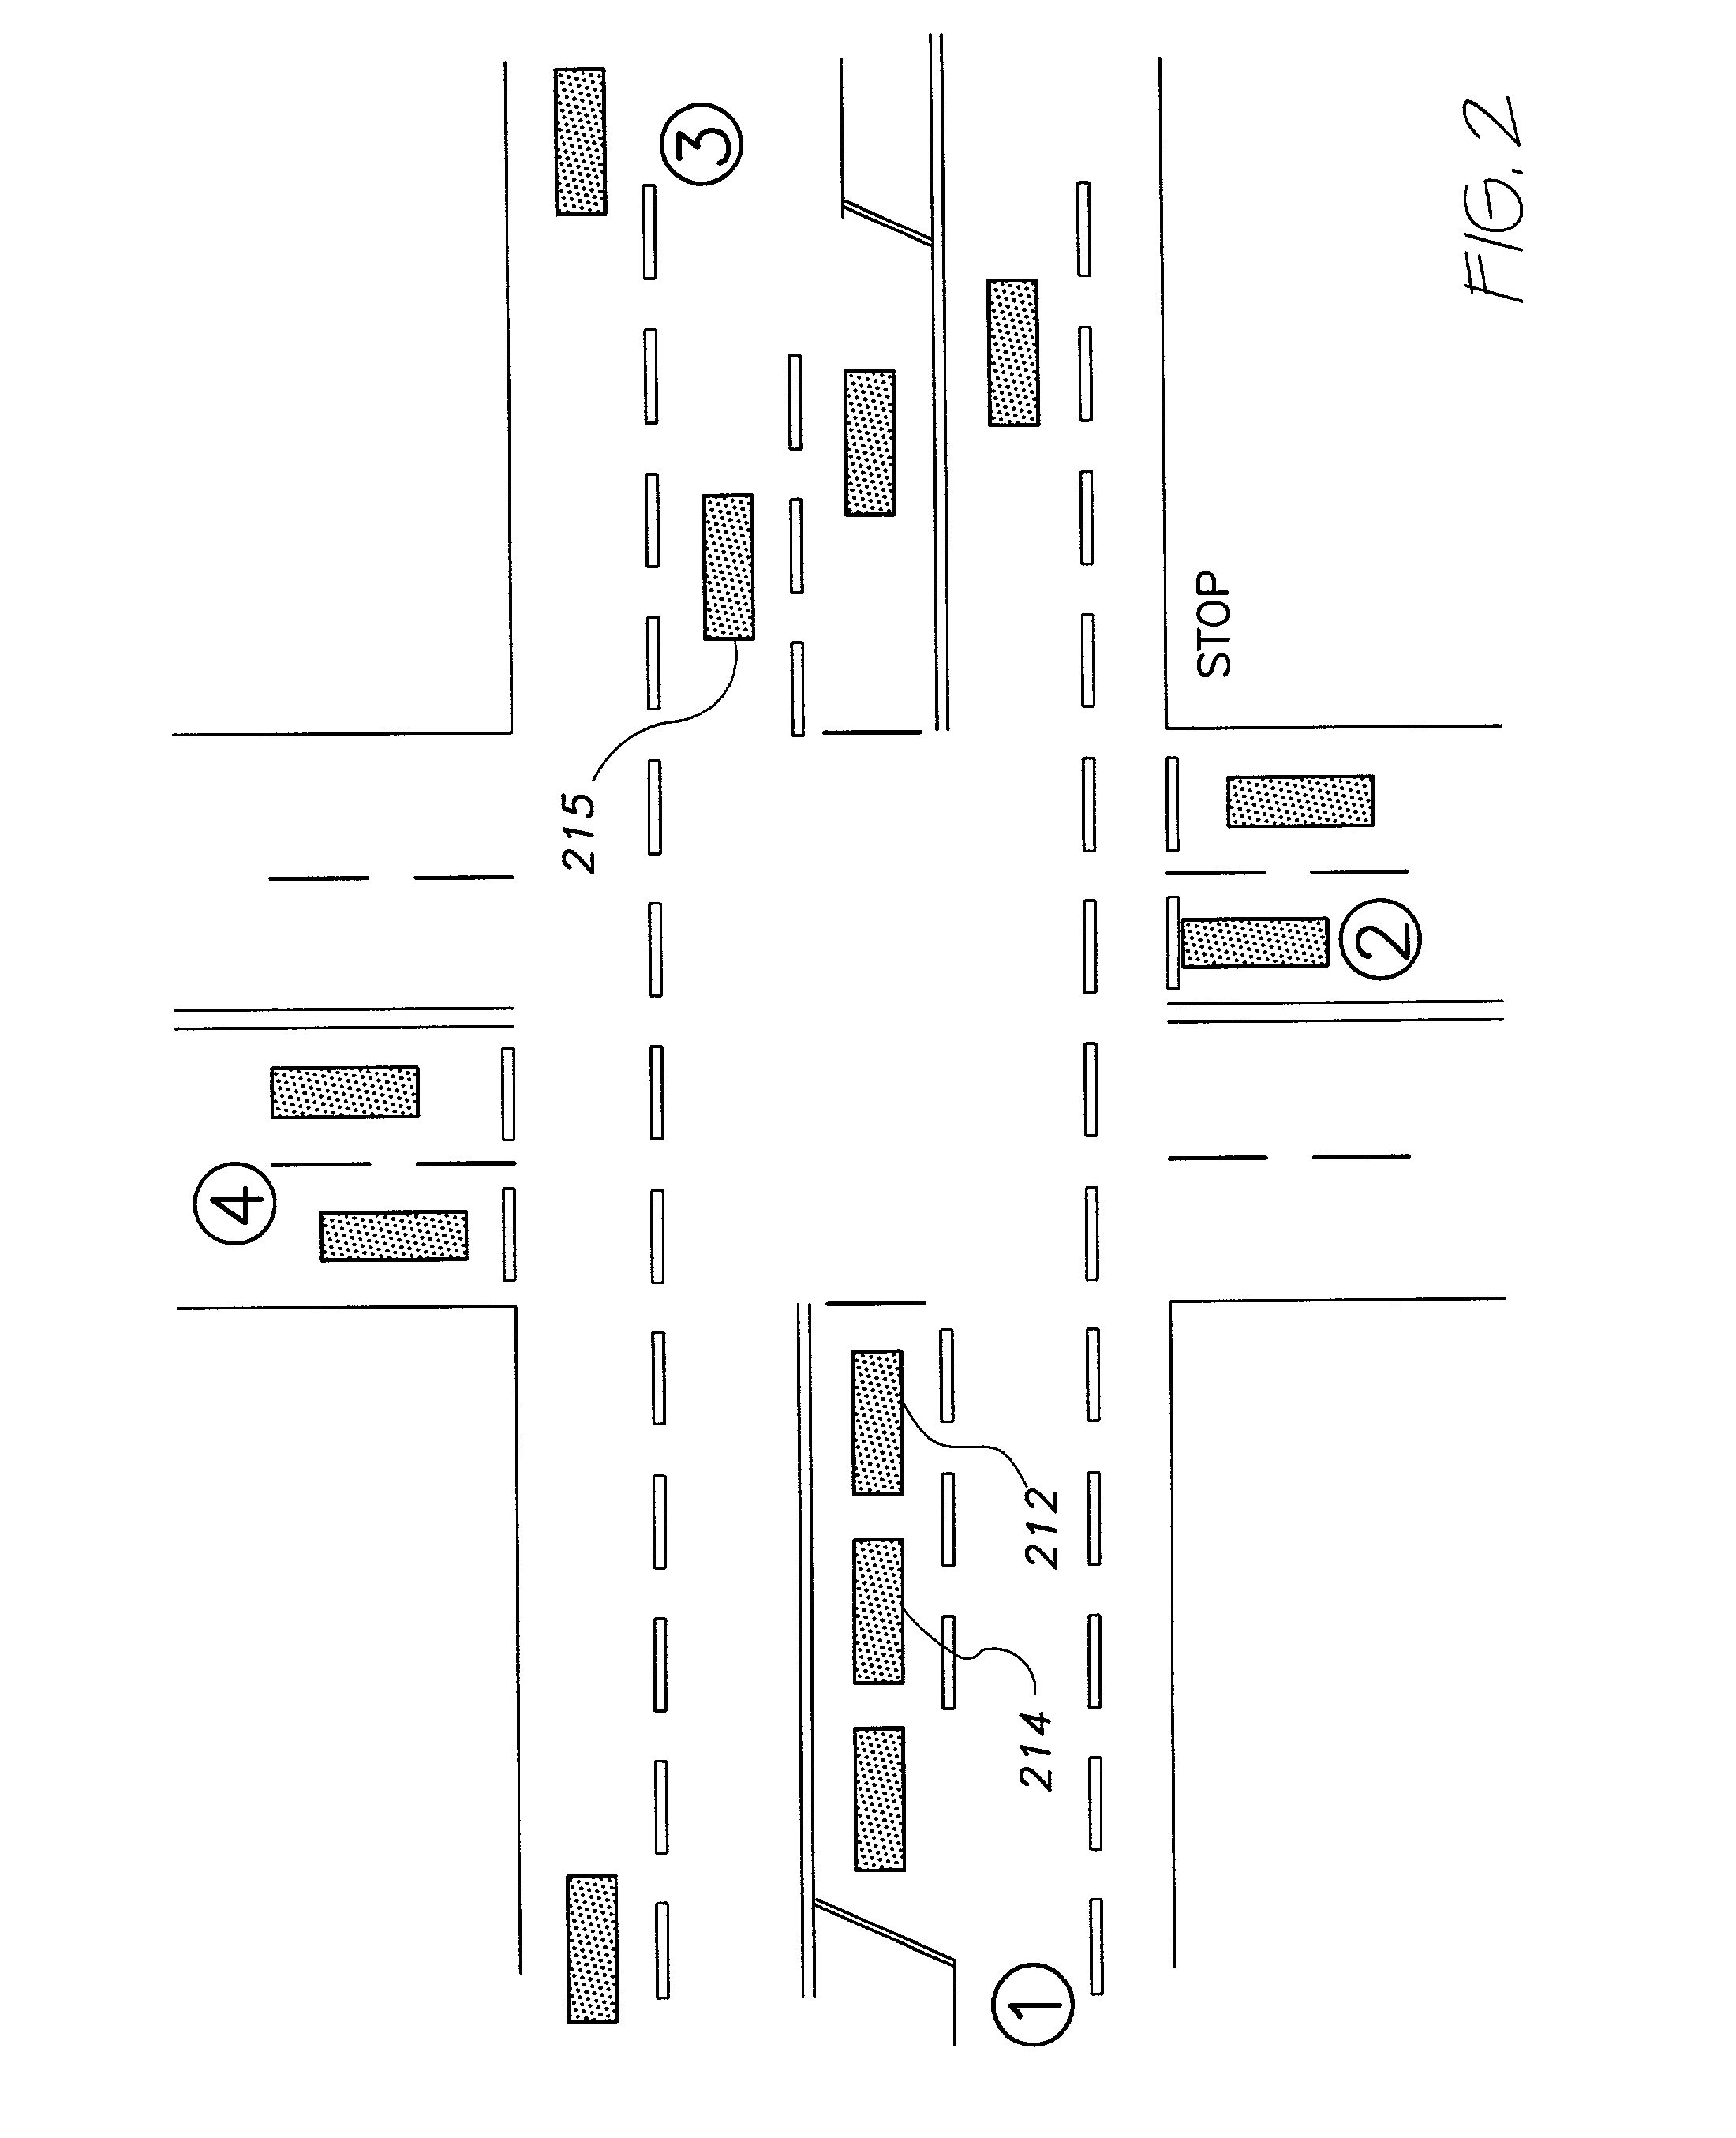
[0016] To achieve the above-mentioned object, the mathematical models and their formulations use a finite element analysis approach and break the accident models, each intersection, and each highway route into discrete elements comprised of: (a) four similarly formatted accident models (angle, rear-end, side-swipe, and fixed object) each of which use discrete elements such as lanes, turnbays, traffic control type, and traffic flow rates (based on normalizing assumptions regarding drivers, vehicles and environments) to create a new and unique statistical likelihood that two separate vehicles will be on intersecting and conflicting paths of advancing and opposing vehicles but only for a finite and discrete period of time (using prior research of the conflict exposure relationship as a function of specific intersection and other characteristics) which thereby creates the opportunity for conflict and defines a Statistically Probable Conflict Opportunity, (b) where for each of the above Statistically Probable Conflict Opportunity models, the conflict is defined as the statistical union of the probability of two assumed mutually exclusive events including 1) the probability of vehicle arrival for a particular movement, and 2) the probability of vehicle opposition to the arrival with both probabilities using the Poisson Distribution or similar statistical distribution but only during the period of time the arriving vehicle is exposed to conflict, which is a significant difference of the SPCO mathematical formulations from any prior accident and conflict modeling relationship, (c) a mathematical format which uses speed-based weightings calibrated to actual accidents to sum each of the above four probable conflict opportunity mathematical model estimates into a total summed annual conflict opportunity estimate, and from this summation to determine annual accidents using a stable linear mathematical relationship between total summed annual probable conflict opportunities (regardless of type) and total annual accidents at an intersection as a function of traffic control type {which is referred to as the Access Management Accident (AMA) Model}, (d) a surrogate exposure-based accident mathematical model for use with Fixed Object (single vehicle) annual accidents to simplify Fixed Object annual accident estimation in lieu of measuring the location and type of each physical feature adjacent to each intersection approach or roadway, (e) mathematical models created from prior research to estimate annual fatality and personal injury involvement given the speed of operation and annual accident involvements at an intersection, (f) mathematical comparisons of annual accident quantity with prior research of quantity-based hazard definitions, (g) mathematical comparisons of annual personal injury and fatality (quality / severity) involvement with a user defined severity-based hazard definition which, with the above hazard quantity indicator, can be used to examine and / or design hazard levels at individual intersections, and (h) summing estimated future fatality and injury involvement from multiple intersections to form a composite severity measure for a highway route, which, with normalizing national accident statistics for each state, can be used with prior research to provide nationally comparable mathematical comparisons of highway route, and even Statewide hazard levels, for existing and / or projected future conditions as affected by changes in traffic volumes, geometries and / or traffic control devices.
[0026] And it is an objective of the invention to provide improved elements and arrangements thereof in an apparatus for the purposes described which is inexpensive, dependable, stable and fully effective in accomplishing its intended purposes.

Problems solved by technology

But neither of these methods are sensitive to the myriad of complexities which affect accident occurrence including the quantity of traffic volumes and their peaking characteristics throughout the day, week and year; the character of the horizontal geometry including the presence of left and / or right turn bays, turning radii, acceleration / deceleration lanes, and median separation from opposing traffic; or the type of traffic controls including no control, yield, two-way stop, all-way stop, or signalized control including the intricate nuances of traffic signal phasing and timings, or the combined effects of roadway and intersection capacity which promote or reduce accidents.
In Access Management (designing the spacing of access openings as affected by the character of each access), the problem of reasonably predicting accident expectancies becomes even more complex than the open roadway because of the differences from one access opening to the next given their relative proximity, where the resultant accident expectancies varies depending on the traffic volumes at each independently operating access opening.
After all, it is highly unlikely that any one intersection would produce delay results which replicate exactly the delay which the Highway Capacity Manual or Webster's models predict.
U.S. Pat. No. 5,270,708 issued to Kamishima on Dec. 14, 1993, discloses one such model including a position and orientation sensor which forecasts the possibility of occurrence of an accident based on pre-existing accident histories and reiterates throughout that "past traffic accident data" is stored, extracted and used to discriminate the potential for accidents ahead based on vehicle proximity to an individual accident location, but this model has no capability for forecasting future accidents based on volume, geometric or traffic control changes to the road ahead.
For example, Dickinson et al. published an article in May 1990 entitled An Evaluation of Microwave Vehicle Detection at Traffic Signal Controlled Intersections that discusses monitoring traffic flow however, does not provide any traffic safety models or predictions.

Method used


Image

  • Traffic safety prediction model
  • Traffic safety prediction model
  • Traffic safety prediction model

Examples


Embodiment Construction

[0040] The following abbreviations are used throughout the specification:

[0041] AADT--Annual Average Daily Traffic

[0042] ADT--Average Daily Traffic

[0043] AASHTO--American Association of State Highway and Transportation Officials

[0044] AMA--Access Management Accident Model (the mathematical form of the present invention comprising the conversion of summed SPCO models into annual accidents)

[0045] FHWA--Federal Highway Administration

[0046] HCM--Highway Capacity Manual

[0047] ISLOS--Intersection Safety Level of Service

[0048] LOS--Level of Service

[0049] MEV--Million Entering Vehicles

[0050] MPO--Metropolitan Planning Organization

[0051] MUTCD--Manual of Uniform Traffic Control Devices

[0052] MVM--Million Vehicle Miles

[0053] RSLOS--Roadway Safety Level of Service

[0054] SLOS--Safety Level of Service

[0055] SMP--Safety Management Program

[0056] SPCO--Statistically Probable Conflict Opportunity

[0057] TRAF-SAFE--The Traffic Safety Computer Program (the combined software program which includes the S...


PUM


Abstract

A Traffic Safety prediction Computer Program (TRAF-SAFE) and sub-models for predicting the number of accidents, injuries and fatalities expected annually at an intersection or series of intersections based on the particular intersection and roadway features. A finite analysis approach to an intersection is used to break the intersection into discrete elements such as lanes, turnbays, stop control signals, and traffic flow rates. The total annual expected accidents can then be calculated as a summation of the interrelation of the individual elements. A Poisson's distribution is used to statistically estimate the likelihood of the individual vehicles occurring within a discrete time frame being investigated. The conflict probabilities between various permutations of the traffic flow is then calculated and summed to determine the number of conflicts for the intersection or roadway. The conflicts are then converted to expected accidents, and the accident level is converted to injury involvements and Safety Levels of Service for the intersection and roadway.

Description

[0001] This application is a continuation-in-part of application Ser. No. 09 / 139,636 filed on Aug. 25, 1998, which is a continuation-in-part of application Ser. No. 08 / 689,651 filed on Aug. 9, 1996, now U.S. Pat. No. 5,798,949, which is a continuation-in-part of application Ser. No. 08 / 372,336 filed on Jan. 13, 1995, now abandoned.I. BACKGROUND OF THE INVENTION[0002] A. Field of the Invention[0003] The present invention relates to the formulation of mathematical annual accidental and severity prediction models for a variety of applications where conflicts are generated as with human conflict, environmental (possibly weather) conflicts and more specifically in this application with vehicle conflicts for highway intersections and roadway segments, and to the statistical format for each of the submodels which estimate annual angle probable conflict opportunities, annual rear-end probable conflict opportunities, annual side-swipe probable conflict opportunities, and annual fixed object ...

Claims


Application Information

Patent Timeline
IPC IPC(8): G08G1/01G08G1/16
CPCG08G1/164G08G1/0104
Inventor KAUB, ALAN R.
Owner KAUB ALAN R
Learn More