Interactive display with improved visualization for product comparison, selection, and methods of operation

a technology of interactive display and product comparison, applied in the field of interactive display, can solve the problems of insufficient "look & feel" of visualization techniques on the world wide web for many users engaging in electronic commerce, difficult comparison, and inability to make all possible shopping alternatives availabl

Inactive Publication Date: 2003-06-05
IBM CORP
View PDF9 Cites 39 Cited by
  • Summary
  • Abstract
  • Description
  • Claims
  • Application Information

AI Technical Summary

Benefits of technology

[0019] These and other objects, features and advantages are achieved in an information network including an interactive display and method of operation which provides improved visualization to allow a user to select and organize product information by categories and attributes for on-line comparison and selection of a product in an electronic commerce environment. The information network further includes at least one knowledge site containing product and attribute information for access by a user through the interactive display. A processor is coupled to the display and a storage disk. The processor includes a Java operating system; an application program for processing product information by categories in terms of products and attributes, and a browser enabling a user to access and interact with the knowledge site through Java applets. The disk contains product information by category; each category received from the knowledge site in the form of HTML files and HTML parameters. The user accesses a knowledge site through a screen provided by the browser. The screen includes a primary category selection area; a secondary category selection area; an active table area; an Y value area for products; an Y value area for extra products; an X area for product attributes; and an X value area for extra product attributes. After accessing the knowledge site for product selection and comparison using the browser, the user selects a product category from the screen. All product categories, elements and attributes are displayed on the screen. A subcategory is selected which limits the display in the active area to the selected subcategory in a highlighted state. Additional subcategories can be added to or deleted from the current selection set. An element can be added to the active table by moving the mouse over the elements in the product overflow areas and selecting the element of interest. A similar interaction is possible for attributes. Selecting an attribute not only moves the attribute to the front of the attribute list in a highlighted state, but also sorts the active table area by that attribute. Products and their attributes can be removed from the active table area. The screen allows a user to choose products or elements on one screen axis (Y), and choose the characteristics or attributes of the products on a second screen axis (X). The desired products and attributes can then be compared. As the user interacts with the interface, the products and attributes animate while reorganizing their screen locations. A physical-based model is used for the motion of the animated elements. The animation provides a smooth movement and illustrates the continuous relationship of the elements in the table to each other. A user will better understand the new state of the display by seeing how the display context changes from one state to the next according to the user's interaction with the display.

Problems solved by technology

Currently, visualization techniques on the World Wide Web have insufficient "look & feel" for many users engaging in electronic commerce.
While shopping on the web, many users feel that all possible shopping alternatives are not made available to them.
Moreover, the comparison of one item with another item of the same type is not available, or, if available, is visualized in a manner which makes comparison difficult.
Another pervasive problem with graphical user interfaces occurs after users interact with a system.
Often, the users lose their context with new information, because the information appears too quickly or instantaneously replaces the information that came before.
Essentially, the users become lost in the data.

Method used


Image

  • Interactive display with improved visualization for product comparison, selection, and methods of operation
  • Interactive display with improved visualization for product comparison, selection, and methods of operation
  • Interactive display with improved visualization for product comparison, selection, and methods of operation

Examples


Embodiment Construction

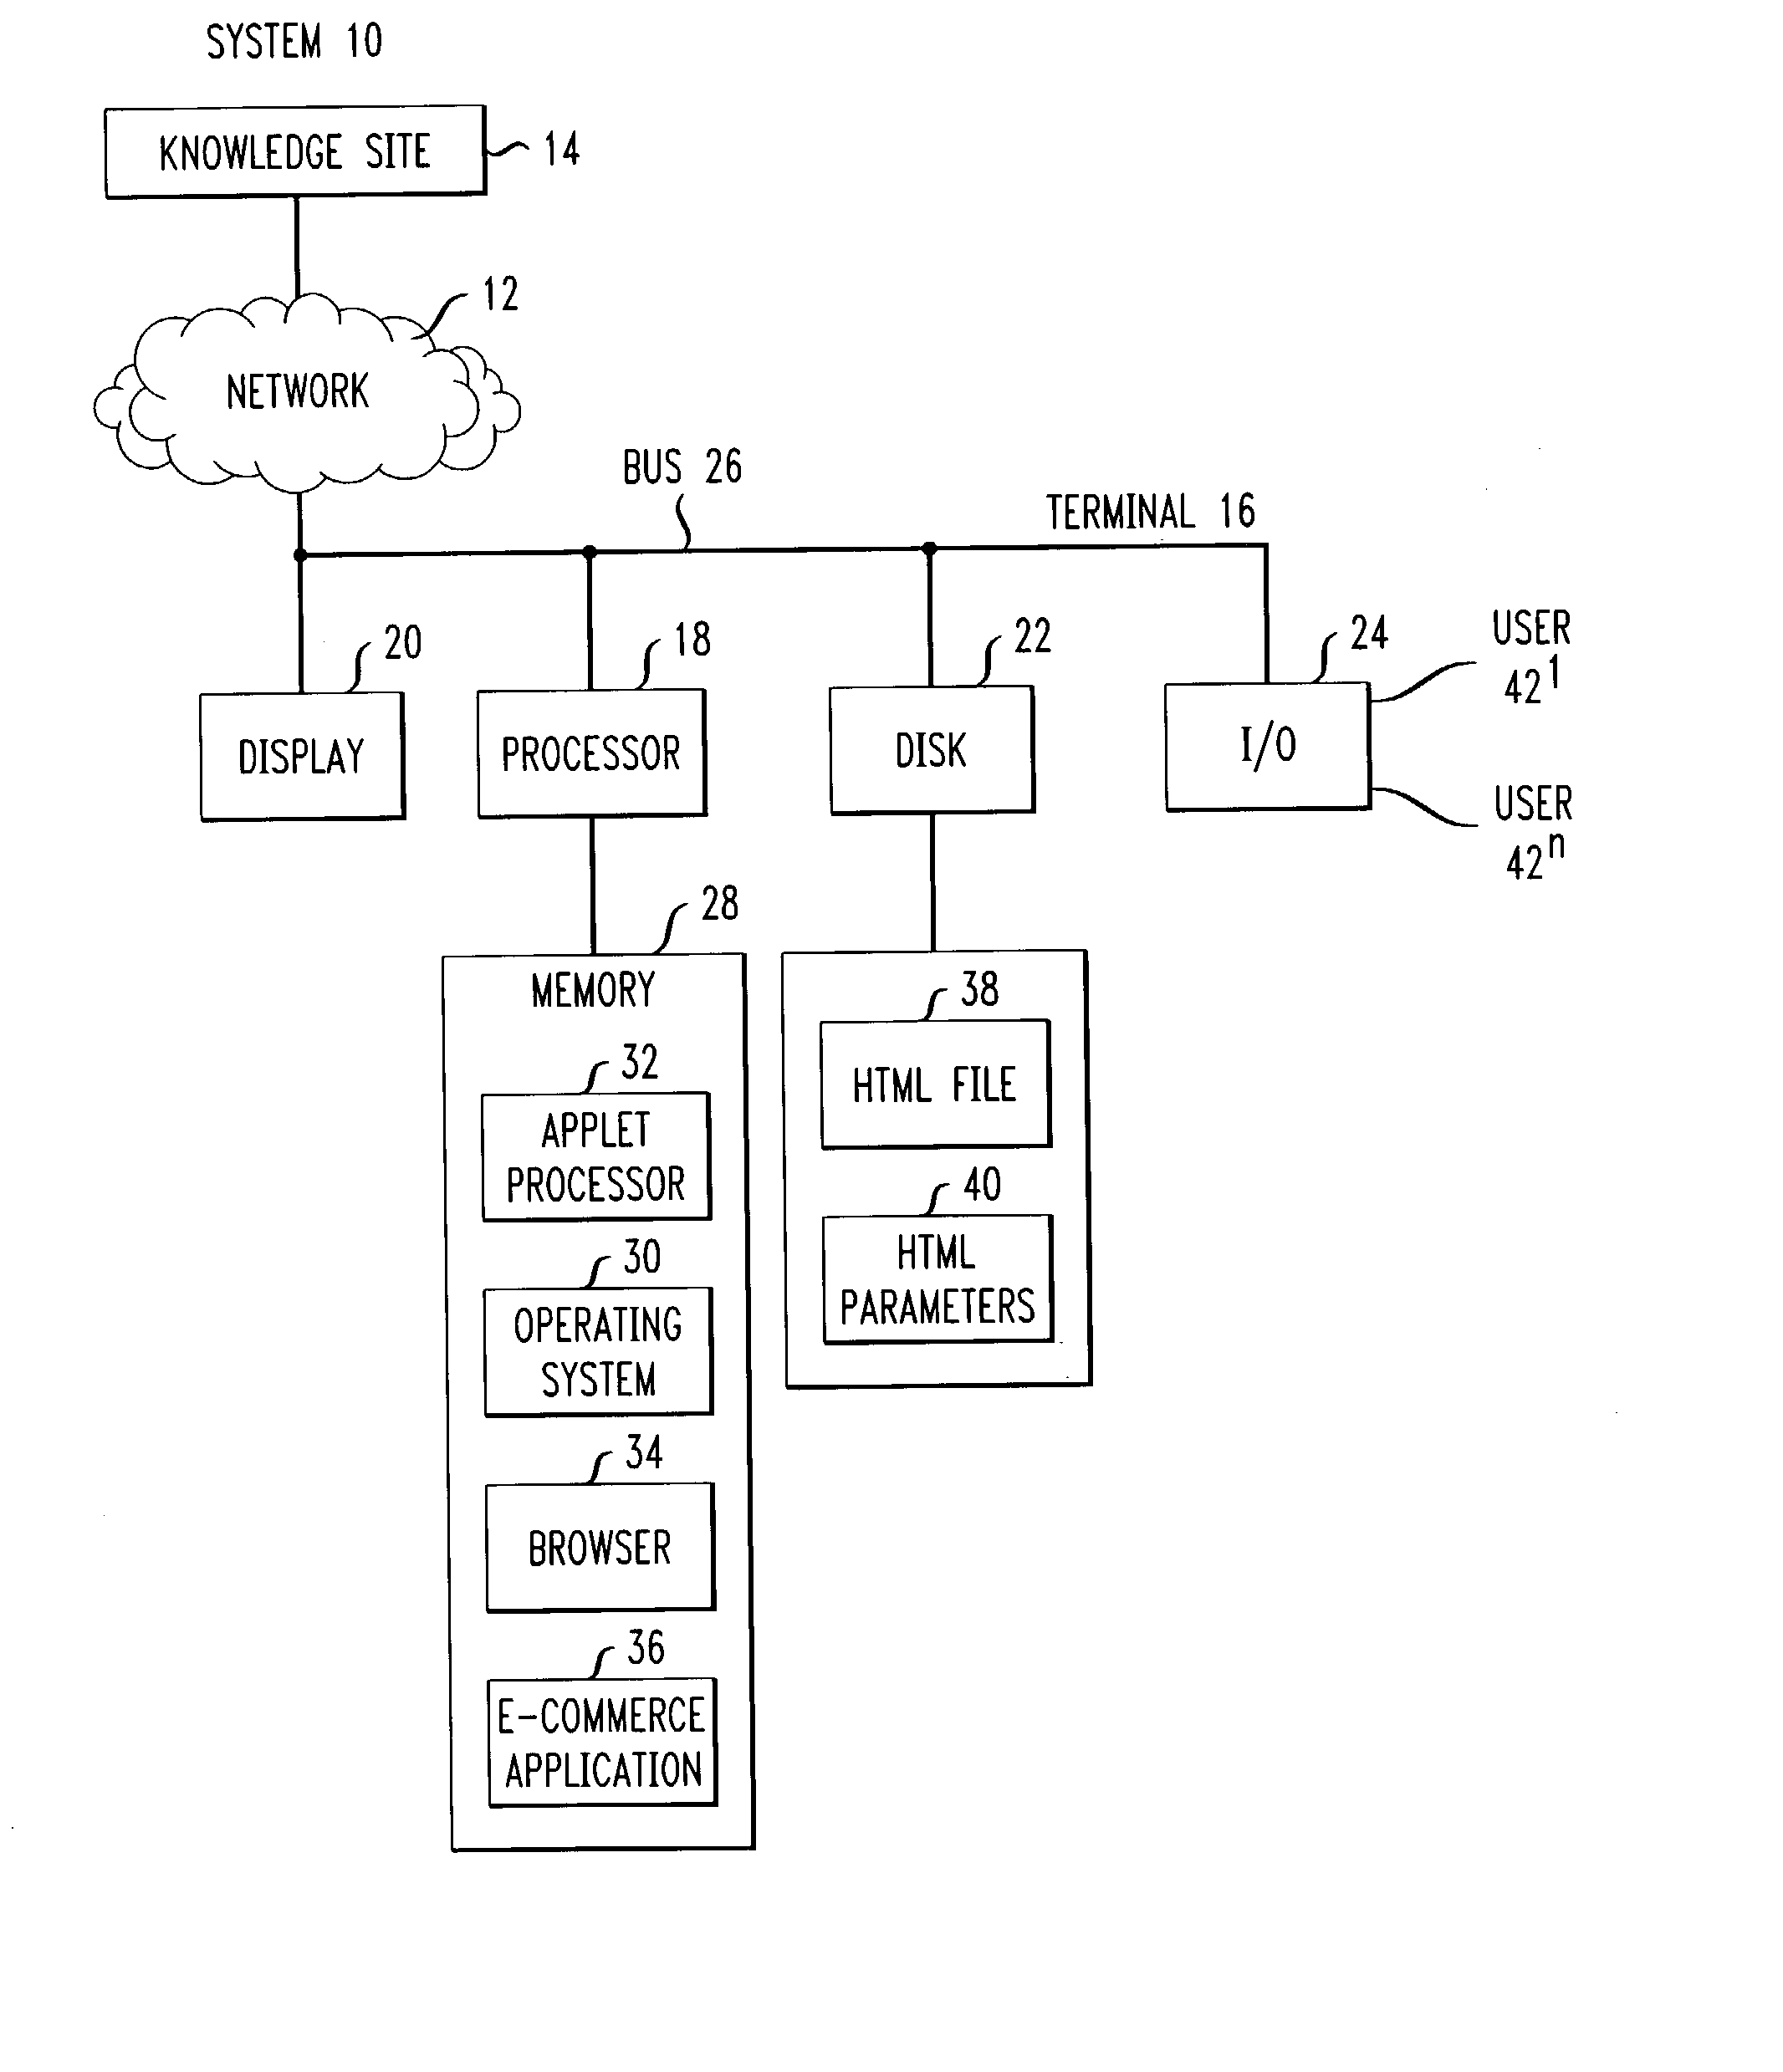
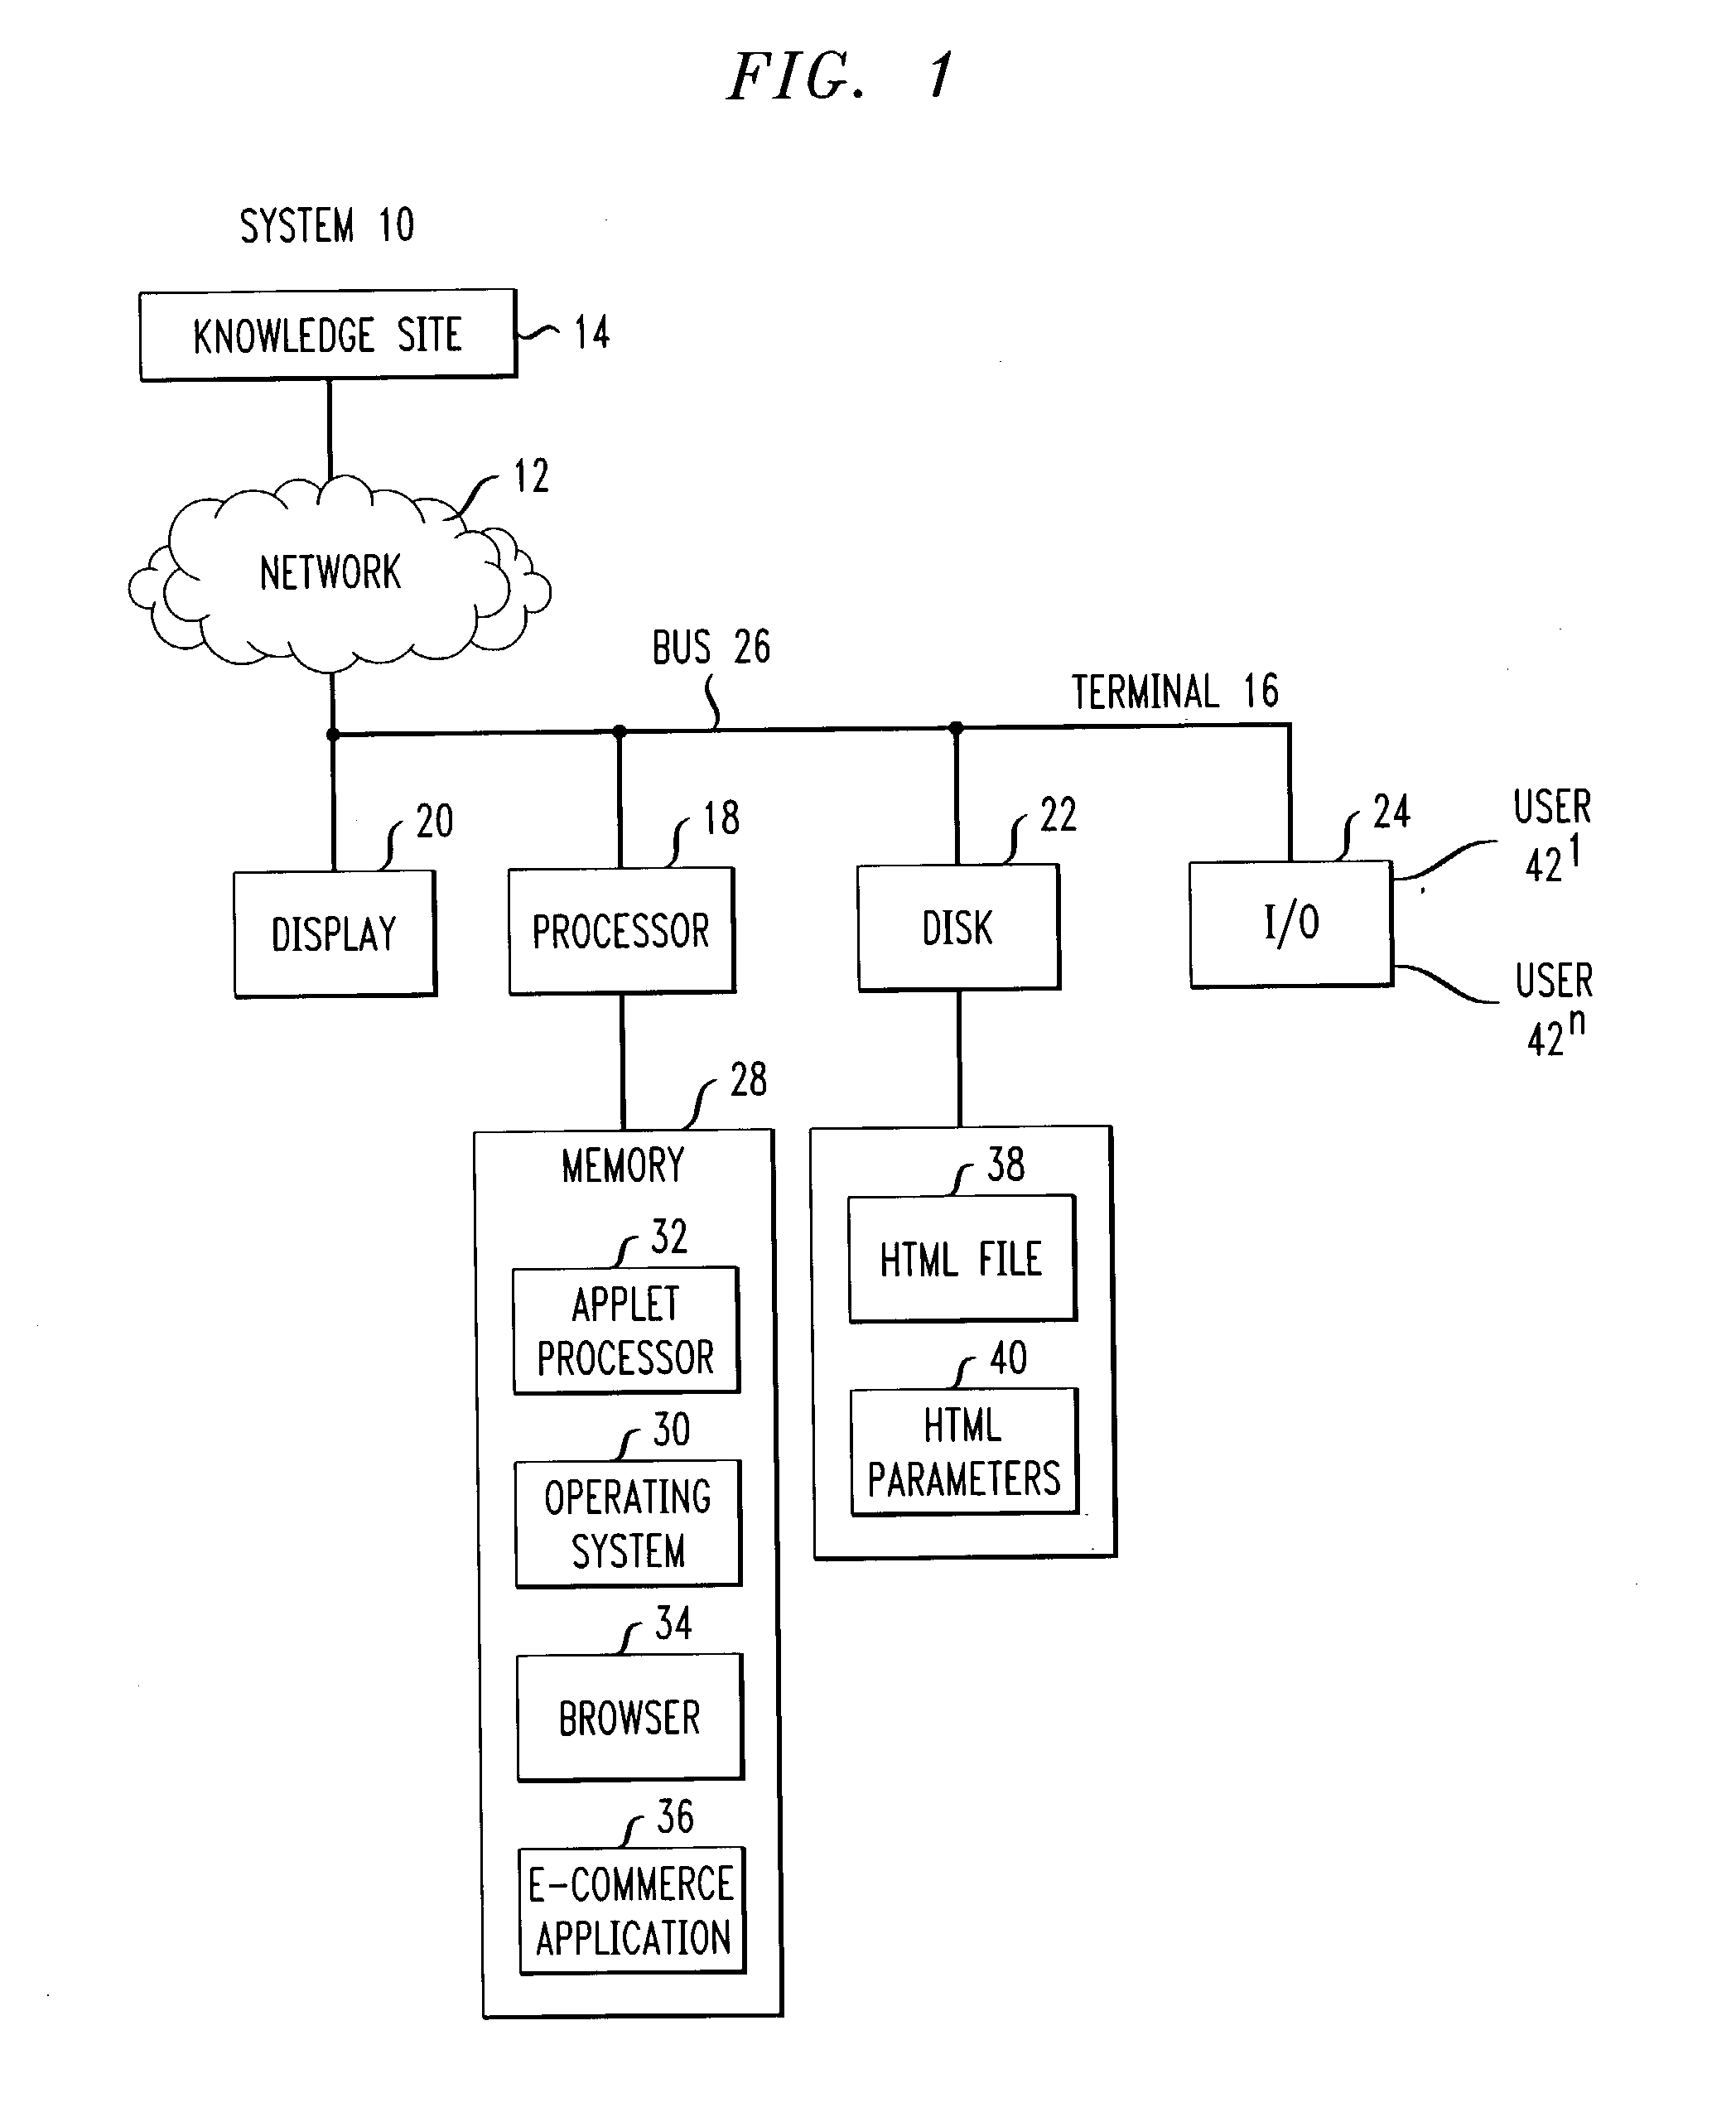
[0026] In FIG. 1 an electronic commerce system 10 includes a network 12, a knowledge site 14 in the network for providing knowledge for merchandising and the like to one or more terminals 16. One of the terminals is shown in FIG. 1 for accessing the site 14 to obtain information or purchase available products. The terminal includes a processor 18 coupled to a display 20; a disk 22 and an I / O 24 through a bus 26. The processor is coupled to a memory 28 including stored program instructions for an operating system 30, e.g., O / S2 or Windows98; a Java Virtual Machine or applet processor 32; a browser 34; and an e-commerce application 36 embedded in the browser. The e-commerce application interacts with the knowledge site in the display and selection of a product as presented in the screens to be described in connection with FIGS. 3-5. The disk 22 contains product information by category received from the knowledge site in the form of HTML files 38 and related HTML parameters 40. The I / O...


PUM


Abstract

In an information network, an interactive display allows a user to choose products or elements on one screen axis (Y) and compare their characteristics or attributes on a second screen axis (X), thereby aiding a user to select a product from all available information according to the user's individual requirements. The information network includes at least one knowledge site containing product information for access by a user through a terminal. The terminal includes a processor coupled to an interactive display and a storage disk. The processor includes a Java operating system; an application program for processing product information by categories in terms of elements and attributes, and a browser enabling a user to access and interact with the knowledge site through Java applets. The disk contains product information by category received from the knowledge site and transformed into the form of HTML parameters within HTML files.

Description

[0001] This application is a continuation of the pending U.S. application identified by Ser. No. 09 / 472,598, filed Dec. 27, 1999, the disclosure of which is incorporated by reference herein.[0002] 1. Field of the Invention[0003] This invention relates to interactive display systems and methods of operation. More particularly, the invention relates to an interactive display with improved visualization for product comparisons, selection and methods of operation.[0004] 2. Description of Prior Art:[0005] Currently, visualization techniques on the World Wide Web have insufficient "look & feel" for many users engaging in electronic commerce. While shopping on the web, many users feel that all possible shopping alternatives are not made available to them. Moreover, the comparison of one item with another item of the same type is not available, or, if available, is visualized in a manner which makes comparison difficult.[0006] Another pervasive problem with graphical user interfaces occurs ...

Claims


Application Information

Patent Timeline
Patent Type & Authority Applications(United States)
IPC IPC(8): G06F17/30G06Q30/02
CPCG06Q30/02G06F17/30893G06F16/972
Inventor TIONGSON, PHILIP R.WEITZMAN, LOUIS M.WU, JESSICA
Owner IBM CORP
Why Eureka
Try Eureka