Functional coverage analysis systems and methods for verification test suites

a functional coverage analysis and verification test technology, applied in the field of digital design methods and systems, can solve the problems of increasing the difficulty of gauging when verification should be considered to be completed, the occasion is non-intuitive and significantly time-consuming, and the functional tools are primitive and limited in many ways

Inactive Publication Date: 2003-06-26
CIRRUS LOGIC INC
View PDF19 Cites 87 Cited by
  • Summary
  • Abstract
  • Description
  • Claims
  • Application Information

AI Technical Summary

Problems solved by technology

With increasingly complex circuits, it is more and more difficult to gauge when verification should be considered to be completed.
On the other side, while functional test tools provide a more complete view of the coverage of the actual device functionality, at present the functional tools are primitive and limited in many ways.
Further, particular tools require the user either to instrument the entire HDL description of the device under test, at a considerable risk of error, or to write coverage code in a separate language, which on occasion is non-intuitive and significantly time intensive.
As a result, the user is limited in coverage ability by the limitations of SQL and the user familiarity with the language.
In any case, the use of the SQL tool is limited to post-processing of information.
Gauging the completeness of simulation test suites for digital designs is further a difficult technical and practical task.
Current tools that measure the coverage provided by a particular test suite have proven inadequate for a variety of reasons.
In particular, current code coverage tools do not accurately measure the amount of device functionality exercised.
Further, some functional coverage tools currently do not allow post simulation specification of coverage metrics.
In some tools, the user is required to know a specialized query language which is unsuited for describing desired coverage metrics.
Using the analysis objects, the user specifies desired coverage metrics which would otherwise be difficult or impossible otherwise to implement, such as coverage of sequences of events and / or coverage of events that occur during the same time window of a simulation.

Method used


Image

  • Functional coverage analysis systems and methods for verification test suites
  • Functional coverage analysis systems and methods for verification test suites
  • Functional coverage analysis systems and methods for verification test suites

Examples


Embodiment Construction

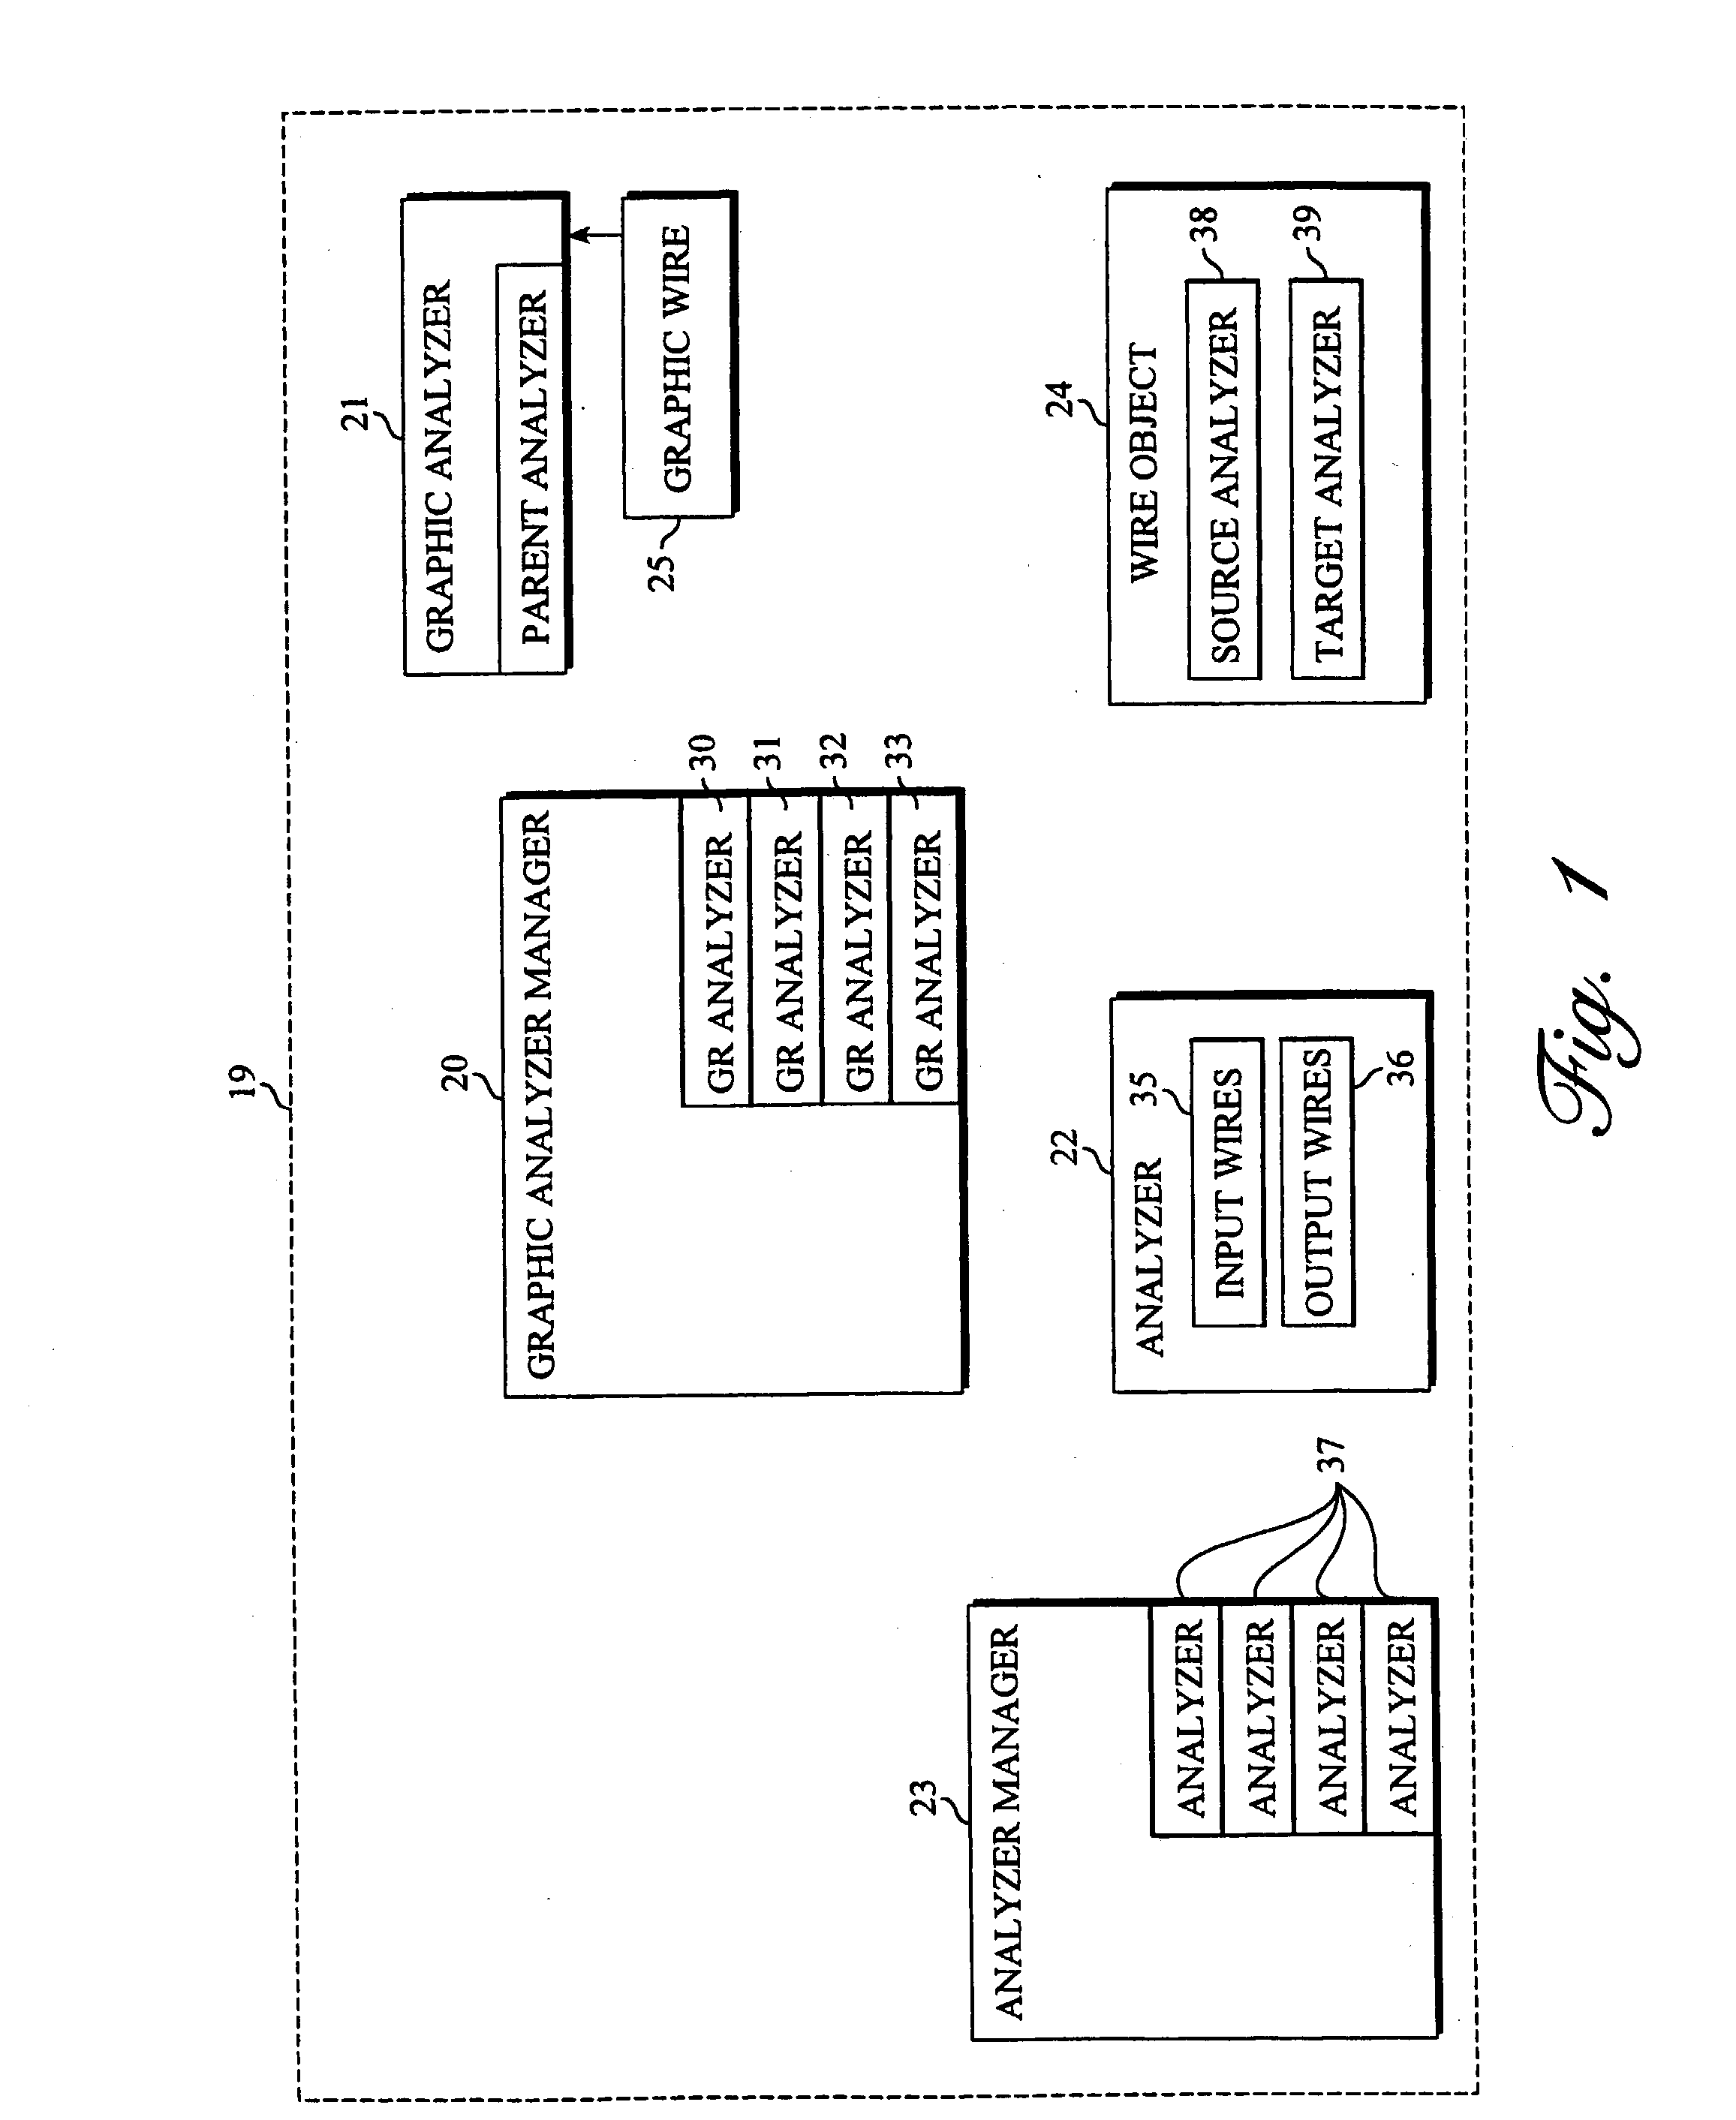
[0019] Referring now to FIG. 1, there is shown a block diagram of the architecture of a generalized wiring system 19 for a data flow functional coverage tool, according to the present invention. The wiring system 19 is used in the graphical user interface 3 to implement a data flow functional coverage tool according to the present invention, which is conveniently capable of adaptation or modification according to the needs of the design test engineer. The wiring system 19 includes the following objects which are part of the architecture of the present invention. In particular, the wiring system 19 includes a graphic analyzer manager 20, a plurality of graphic analyzers 21, any number of analyzers 22, an analyzer manager 23, any number of wire objects 24, and any number of graphic wire objects 25. The graphic analyzer manager 23 includes a plurality of graphic analyzers 30-31. The graphic analyzer 21 includes a reference to a parent analyzer 34. The analyzer object 22 includes refere...


PUM


Abstract

Coverage metrics are expressed with an intuitive graphical interface based upon data flow. Coverage analysis and presentation objects are integrated to produce coverage results which enable device functionality in a device under test to be modeled as objects, subject to event occurrence. Event objects are introspected at run-time, allowing the user to determine the event object's attributes with specification of coverage metrics subject to a selected combination of the event object's attributes. The event objects are serialized into permanent storage, allowing the user to specify and execute new coverage metrics at any time after simulation. Operations used to describe coverage metrics are modeled as analysis objects. Such analysis objects accept event objects as inputs, using a predetermined, well-defined interface. The combination of event objects and analysis objects allows coverage metrics to be specified in a simple data flow manner. With such a coverage metric, the user attaches or wires (metaphorically) the analysis objects together in a visual builder environment. Using the analysis objects, the user specifies desired coverage metrics, such as coverage of sequences of events and/or coverage of events that occur during the same time window of a simulation. The display functionality of the coverage tool is expandable because the presentation objects use the same event object interface as the analysis operator objects. Coverage metrics are subject to specification either before or after event occurrence. The user specifies coverage metrics using an intuitive graphical interface based upon data flow, without any specific programming language skills being necessary. Functional events in the device under test are treated as event objects. Each event object may be passed to selected analysis tools chosen by the user, such as analyzers, logic gates, and coincidence counters.

Description

CROSS-REFERENCE TO RELATED PATENT APPLICATIONS[0001] This patent application is related to the following additional patent applications which are hereby expressly referenced and incorporated hereinto in their entirety by reference: patent application Ser. No. ______, patent application Ser. No. ______ and patent application Ser. No. ______, having respective titles "Systems And Methods For Generating Interchangable Device Event Description Databases For Use in a Functional Coverage Tool That Is Portable Between Designs", "Systems And Methods For Manipulating Configuration Events in a Dataflow Functional Coverage Tool For a Verification Test Suite", and "Systems and Methods for Allowing Graphical User Connection of Coverage Analyzer Operators in a Data Flow Functional Coverage Tool", with the same filing date as the present patent application, and the same inventorship.[0002] 1. Field of the Invention[0003] This application relates to digital design methods and systems and more parti...

Claims


Application Information

Patent Timeline
Patent Type & Authority Applications(United States)
IPC IPC(8): G01R31/3183G06F17/50
CPCG01R31/318314G06F17/5022G01R31/318357G01R31/31835G06F30/33
Inventor CARTER, HAMILTON B.
Owner CIRRUS LOGIC INC
Why Eureka
Try Eureka