Cloud cover assessment: VNIR-SWIR

a cloud cover and image technology, applied in the field of image processing, can solve the problems of skewing analysis, reducing contrast, affecting the accuracy of image analysis, etc., and achieve the effect of not imposing an unreasonable operational computing workload and computational simplicity

Inactive Publication Date: 2005-05-26
THE BOEING CO
View PDF12 Cites 18 Cited by
  • Summary
  • Abstract
  • Description
  • Claims
  • Application Information

AI Technical Summary

Benefits of technology

[0008] Embodiments of the present invention can be used to determine the presence of clouds without involving thermal infrared detecting equipment. Embodiments of the present invention use spectral and spatial tests applied to pixel-level spectral measurements to determine the presence of

Problems solved by technology

Overhead imaging studies of a surface below may be hampered by the presence of cloud formations.
Potentially worse in some cases is the presence of thinner cloud formations that do not entirely occlude the surface, but may reduce the contrast of surface features and change the derived surface spectral reflectance signature with resulting impact on information products such as spectral vegetation indices.
Presence of thin cloud formations, such as cirrus clouds, can skew the analysis of such surface features by causing researchers to confuse presence of cloud features for features or

Method used


Image

  • Cloud cover assessment: VNIR-SWIR
  • Cloud cover assessment: VNIR-SWIR
  • Cloud cover assessment: VNIR-SWIR

Examples


first embodiment

[0024]FIG. 3 shows a routine 300 for classifying data points as cloud points or non-cloud points. The routine 300 begins at a block 302, and a next point of top of atmosphere, visible, near-infrared, and short-wavelength infrared data is submitted for processing at a block 304. At a block 306, a comparison of the ρC1 to a cirrus-band threshold cloud value is made. If ρC1 exceeds the threshold value, the data point is classified as a cloud point at a block 308. If not, the routine 300 proceeds to a next block to make a further comparison of whether the data point represents a cloud point or a non-cloud point.

[0025] In one particular embodiment, the ρC1 comparison at the block 306 is made at a wavelength of 1.88 μm. At this wavelength, the reflectance has been determined to be more reliable than at slightly lower wavelengths. Of course, in alternate embodiments, ρC1 may be tested at wavelengths other than 1.88 μm, such as at 1.38 μm or other cirrus bands.

[0026] If the comparison of ρ...

second embodiment

[0040]FIG. 4 shows a routine 400 for classifying data points as cloud points or non-cloud points. The routine 400 begins at a block 402, and a next point of top of atmosphere visible, near-infrared, and short-wavelength infrared data is submitted for processing at a block 404. At a block 406, a comparison of the ρC1 to a cirrus-band threshold cloud value is made. If ρC1 exceeds the cloud threshold value, the data point is classified as a cloud point at a block 408. If not, the routine 400 proceeds to a next block to make a further comparison of whether the data point represents a cloud point or a non-cloud point.

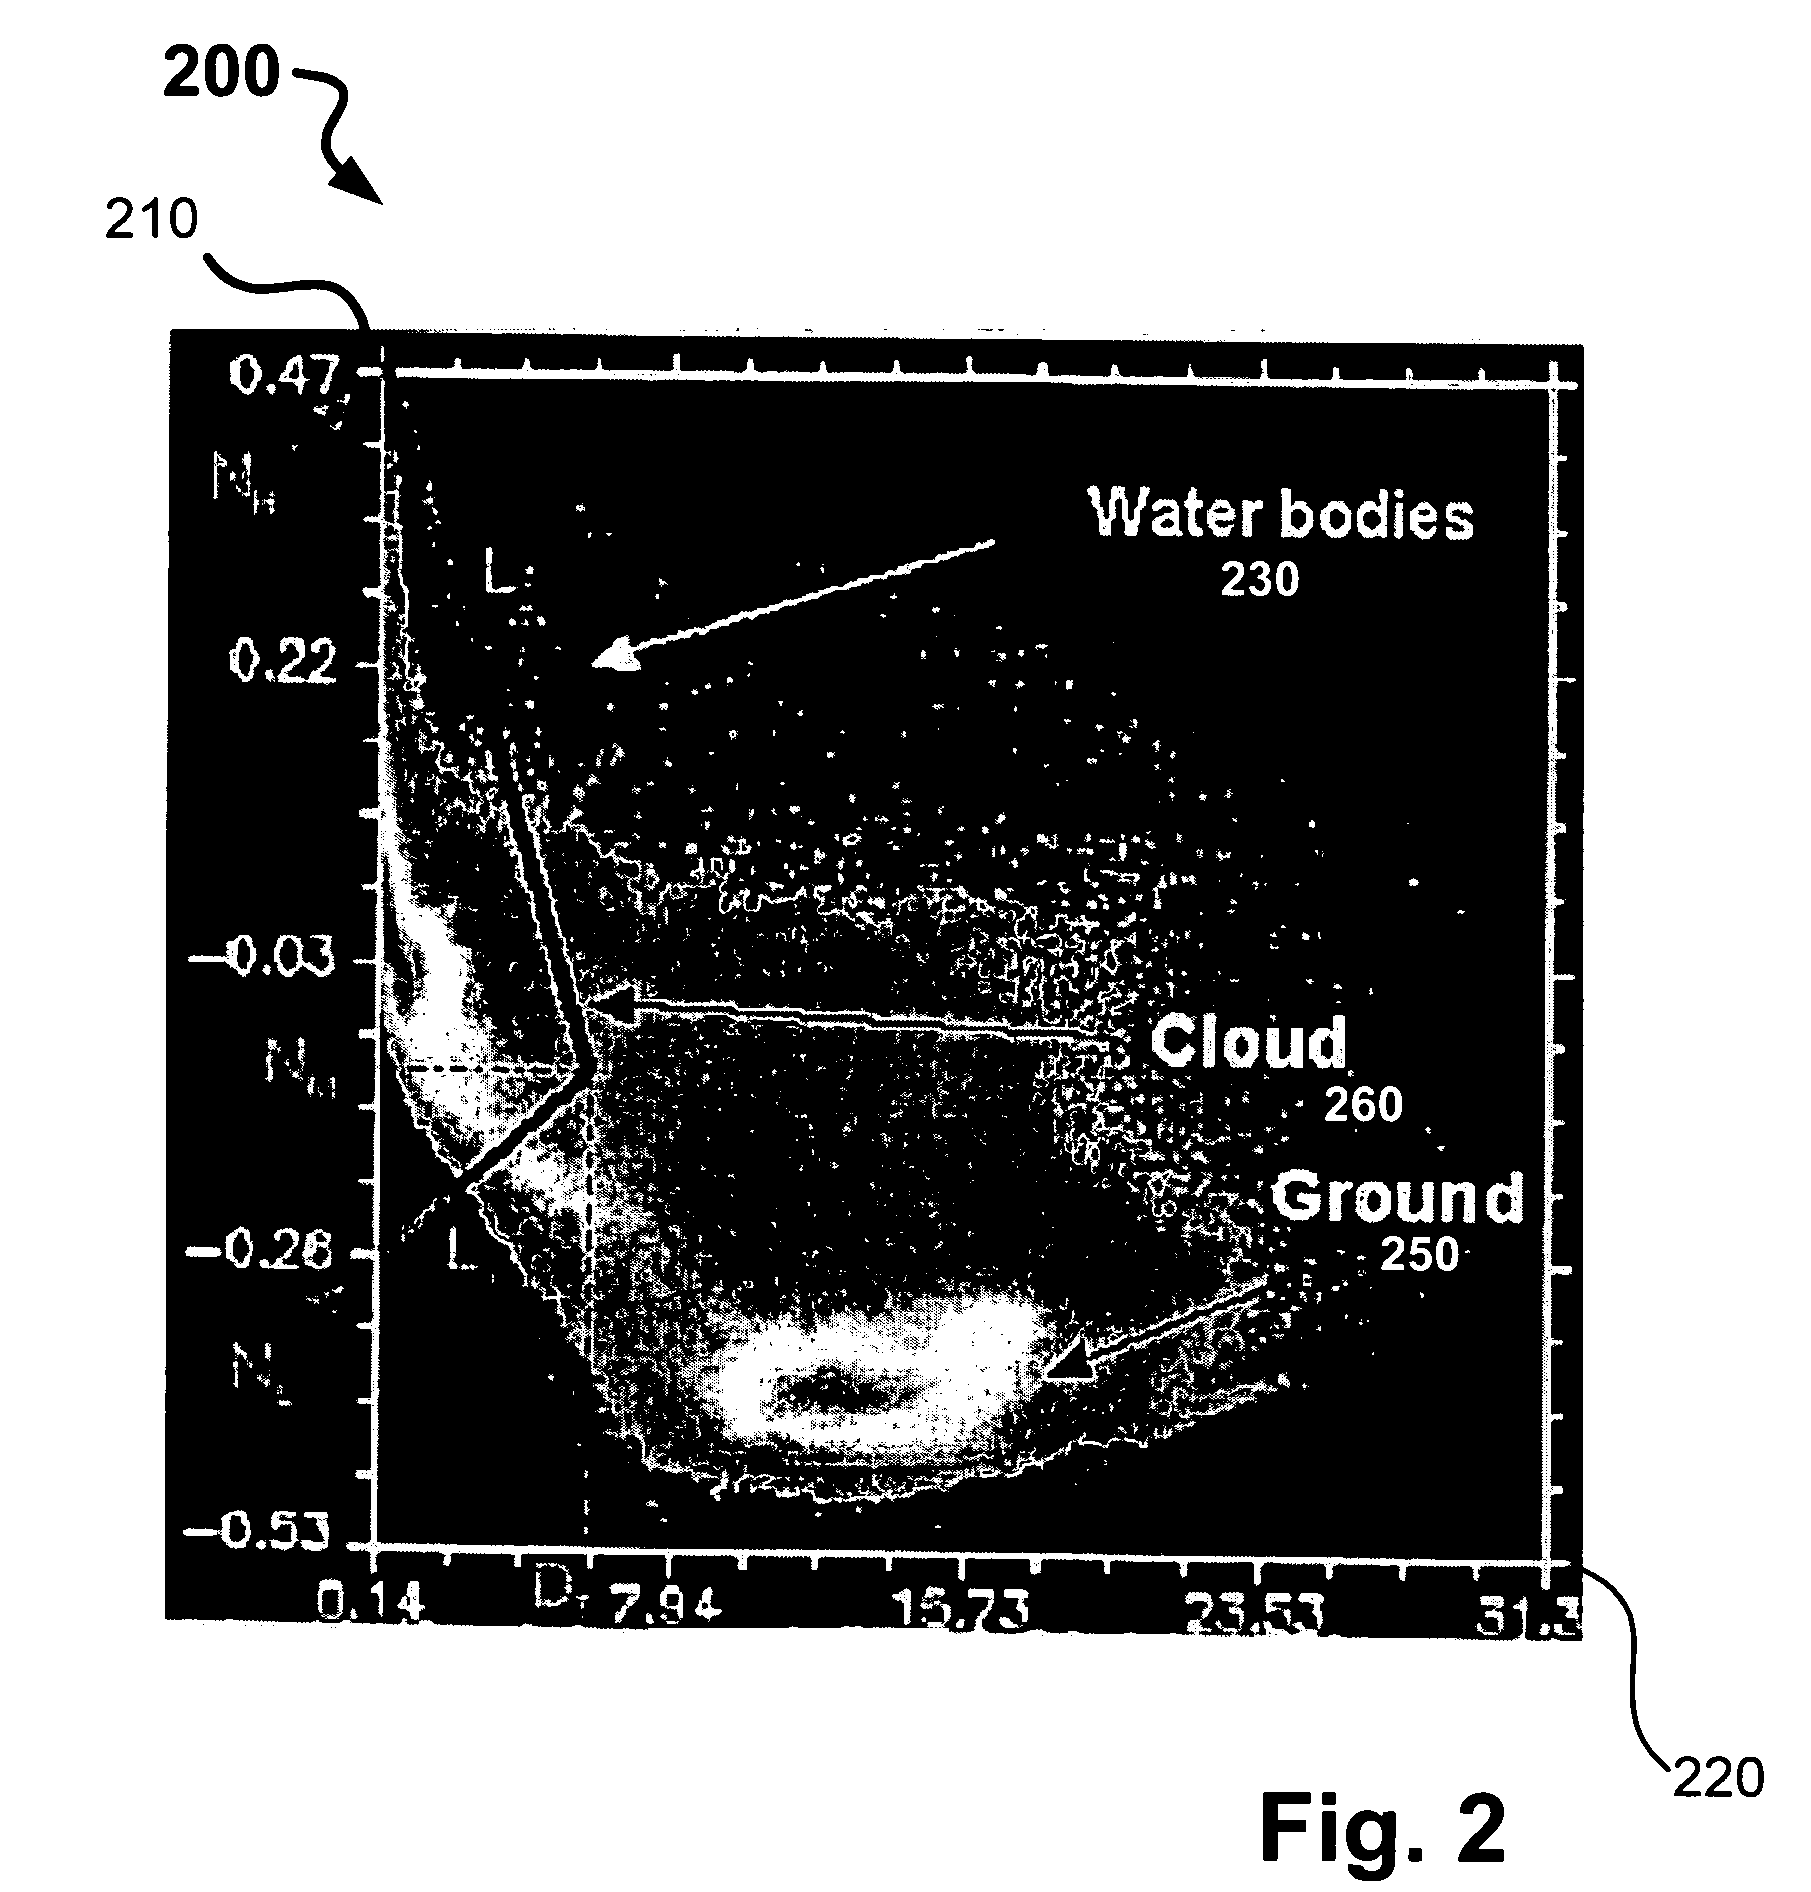
[0041] If the comparison of the data point at the block 406 does not result in the data point being identified as a cloud point at the block 408, then at a block 410 the NDSI is compared to an NDSI minimum threshold value and an NDSI maximum threshold value. The NDSI thresholds are set according to empirical analysis of NDSI data such as that shown in FIG. 2. Unlike the rout...


PUM


Abstract

Methods, a computer-readable medium, and a system are provided for determining whether a data point indicates a presence of a cloud using visible near-infrared data and short wavelength infrared data. A first comparison of a cirrus-band reflectance of the data point with a threshold cirrus-band reflectance value is made, classifying the data point as a cloud point if the cirrus-band reflectance of the data point exceeds the threshold cirrus-band reflectance value. When the comparing of the cirrus-band reflectance of the data point with the threshold cirrus-band reflectance value does not classify the data point as a cloud point, a further analysis is performed, including performing a second or more comparisons of additional cloud indicators derived from at least one of the visible, near-infrared, and short wavelength infrared data with related empirically-derived, landcover-dependent thresholds for classifying the data point as a cloud point or a non-cloud point.

Description

FIELD OF THE INVENTION [0001] This invention relates generally to image processing and, more specifically, to detection of cloud cover in high-altitude and / or orbital overhead imaging data. BACKGROUND OF THE INVENTION [0002] Overhead imaging studies of a surface below may be hampered by the presence of cloud formations. Understandably, thick clouds between an observation point and the area of interest under observation can conceal objects or features in the area of interest. Potentially worse in some cases is the presence of thinner cloud formations that do not entirely occlude the surface, but may reduce the contrast of surface features and change the derived surface spectral reflectance signature with resulting impact on information products such as spectral vegetation indices. Presence of thin cloud formations, such as cirrus clouds, can skew the analysis of such surface features by causing researchers to confuse presence of cloud features for features or changes in the surface r...

Claims


Application Information

Patent Timeline
IPC IPC(8): G01W1/00G06V20/13G06F19/00
CPCG06K9/0063G06V20/13
Inventor BORIGHT, ARTHUR L.SLUDER, JOHN C.
Owner THE BOEING CO
Why Eureka
Try Eureka