Method and mechanism for debugging a series of related events within a computer system

Active Publication Date: 2005-07-21
ORACLE INT CORP
View PDF79 Cites 33 Cited by
  • Summary
  • Abstract
  • Description
  • Claims
  • Application Information

AI Technical Summary

Benefits of technology

[0004] Diagnosing problems using multiple trace logs often involves a manual process of repeatedly inspecting different sets of the trace logs in various orders to map the sequence and execution of events in the application code. This manual process attempts to correlate events in the system(s) with the application code to construct likely execution scenarios that identify root causes of actual or potential execution problems. Even in a modestly distributed system of a few nodes, this manual process comprises a significantly complex task, very much limited by the capacity of a human mind to comprehend and concurrently analyze many event scenarios across multiple threads on multiple nodes. Therefore, analyzing traces to diagnose applications in parallel and/or distributed systems and/or single node systems is often a time consuming and difficult exercise fraught with the potential for human limitations to render the diagnosis process unsuccessful. In many cases, the complexity of manual trace analysis causes the programmer to overlook or misdiagnose the real significance of events captured in the trace logs. With the increasing proliferation of more powerful computer systems capable of greater execution loads across more nodes, the scope of this problem can only increase.
[0005] An improved approach to diagnosing computer systems and applications uses trace messages that are materialized in a markup language syntax. Hyperlinks can be placed in the trace messages to facilitate navigation between sets of related traces. One method to generate trace messages having markup language syntax is to first generate trace strings from an application having a known set of fixed formats, in which the process for extracting information to create a new version of the trace in a markup language syntax is driven by knowledge of the position and existence of specific data in the trace

Problems solved by technology

Even in a modestly distributed system of a few nodes, this manual process comprises a significantly complex task, very much limited by the capacity of a human mind to comprehend and concurrently analyze many event scenarios across multiple threads on multiple nodes.
Therefore, analyzing traces to diagnose applications in parallel and/or distributed systems and/or single node systems is often a time consuming and difficult exe

Method used


Image

  • Method and mechanism for debugging a series of related events within a computer system
  • Method and mechanism for debugging a series of related events within a computer system
  • Method and mechanism for debugging a series of related events within a computer system

Examples


Embodiment Construction

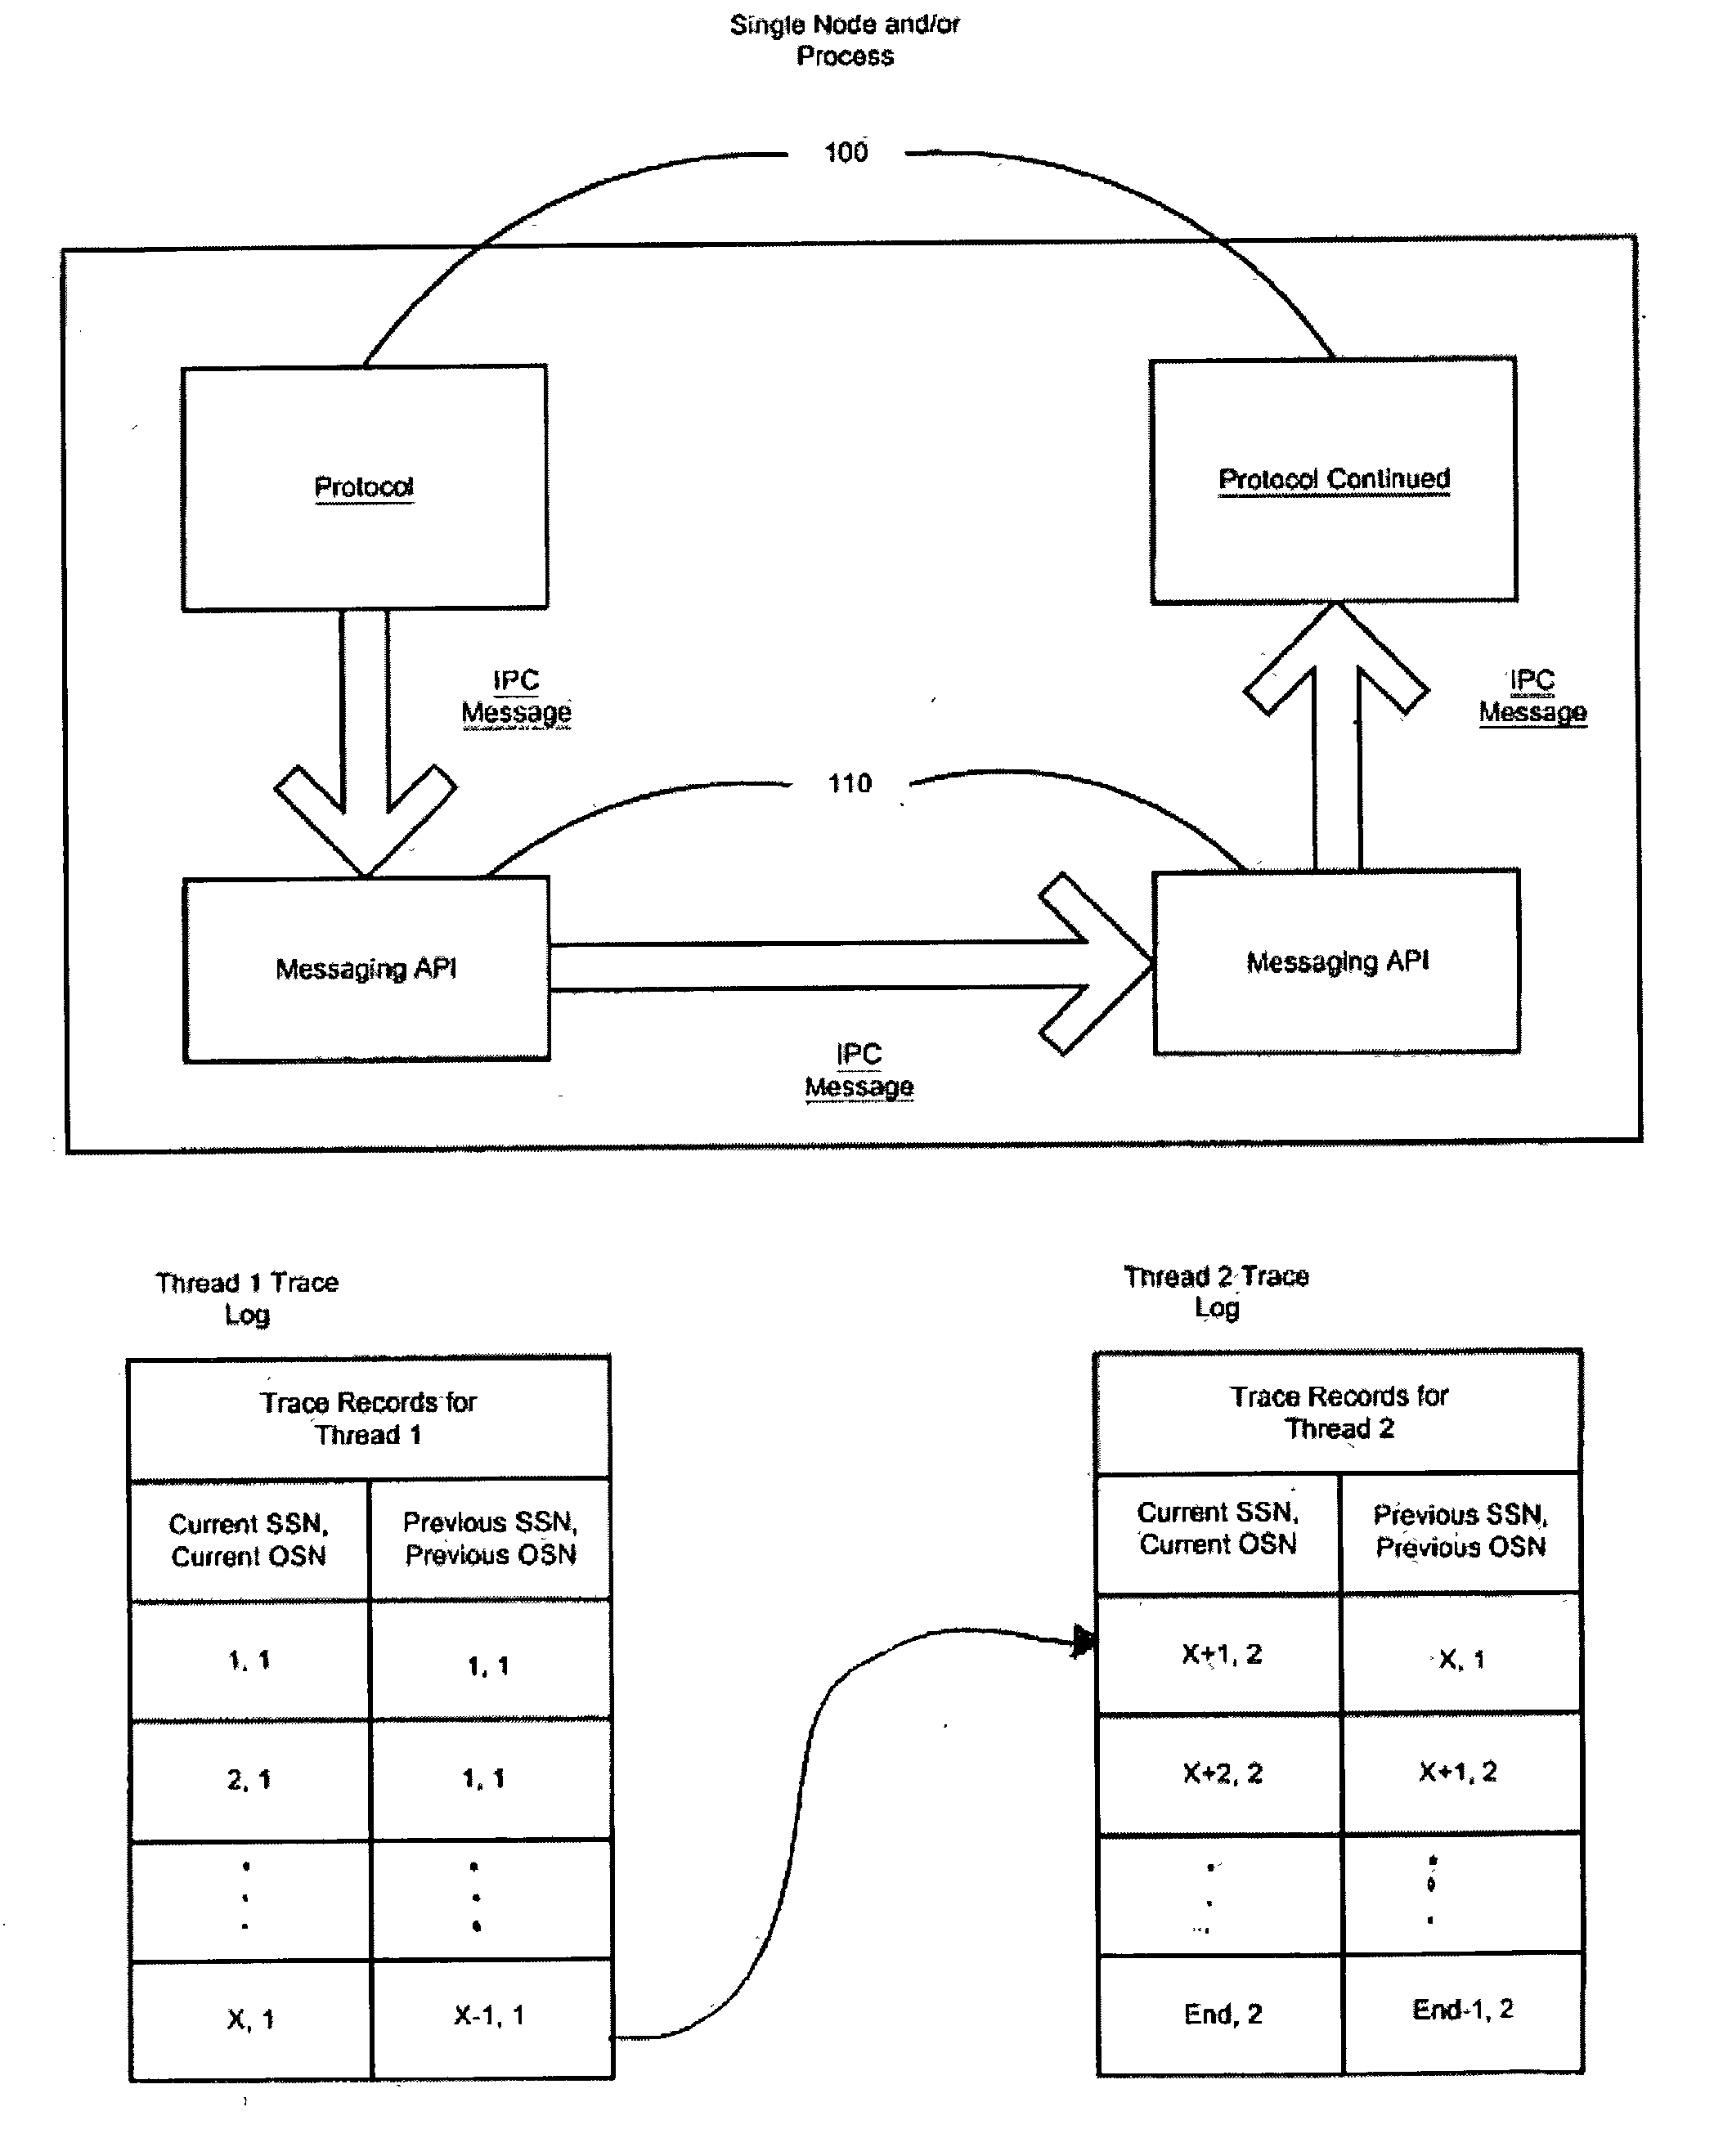
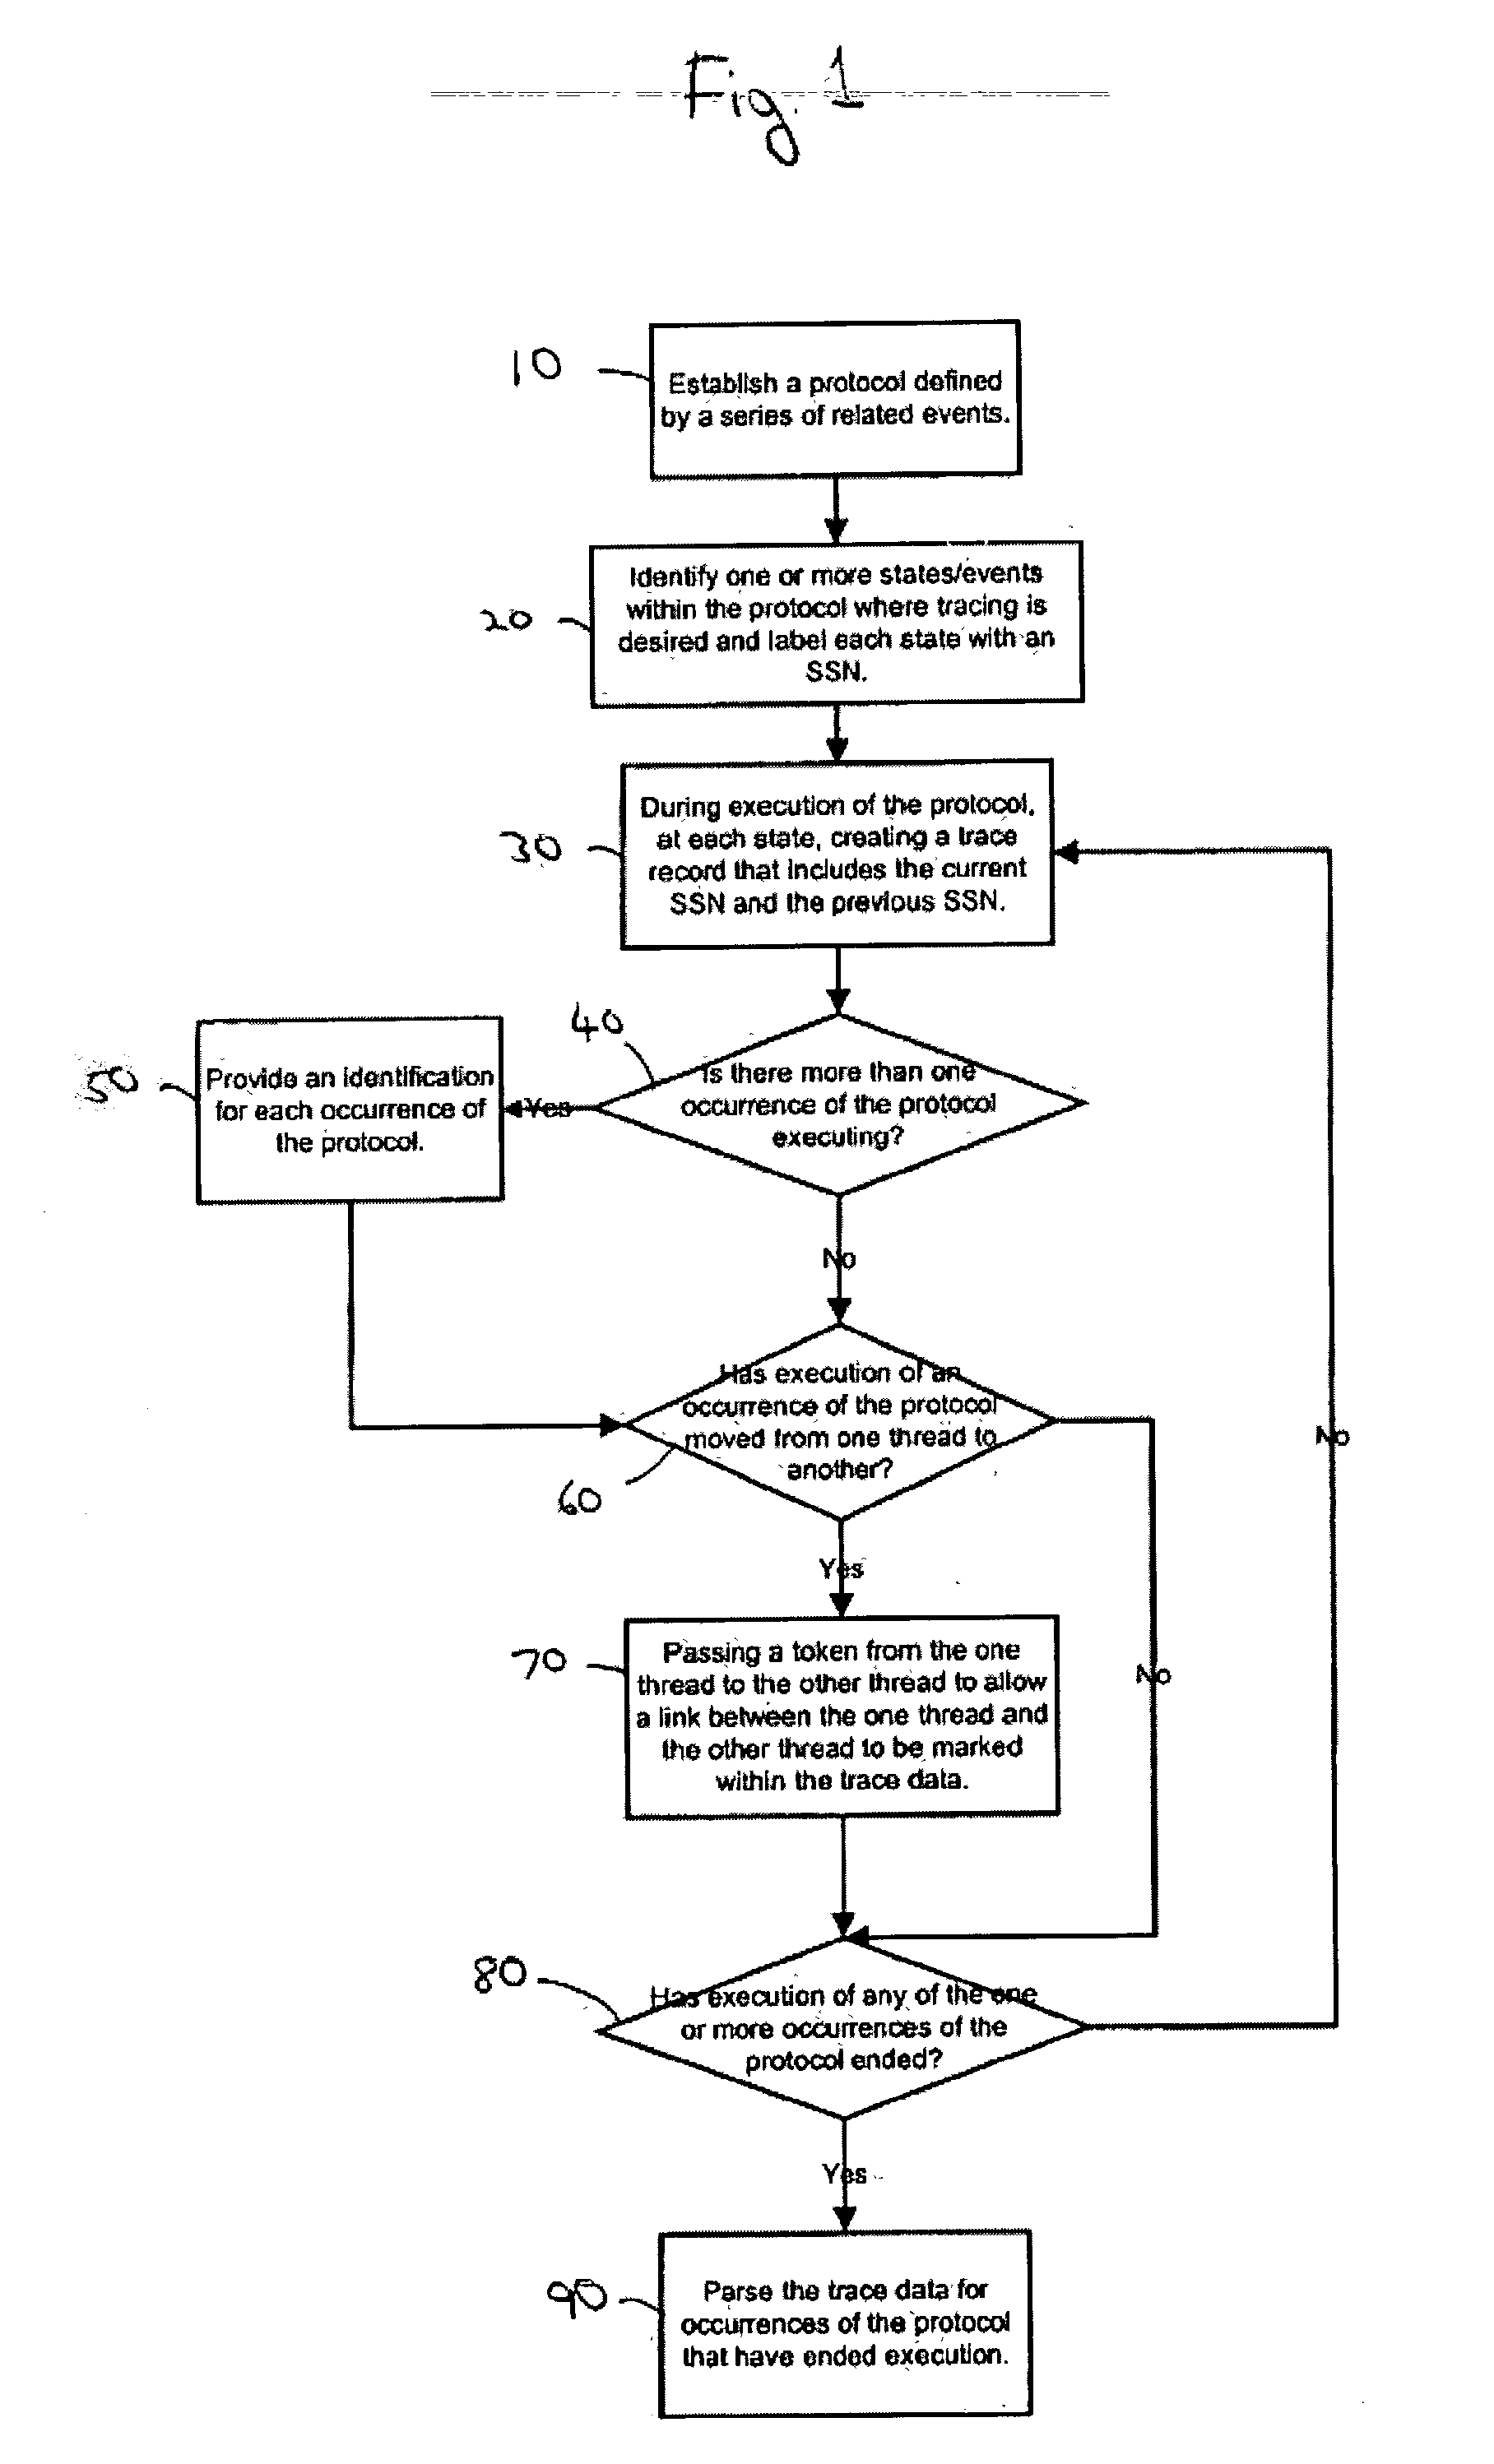
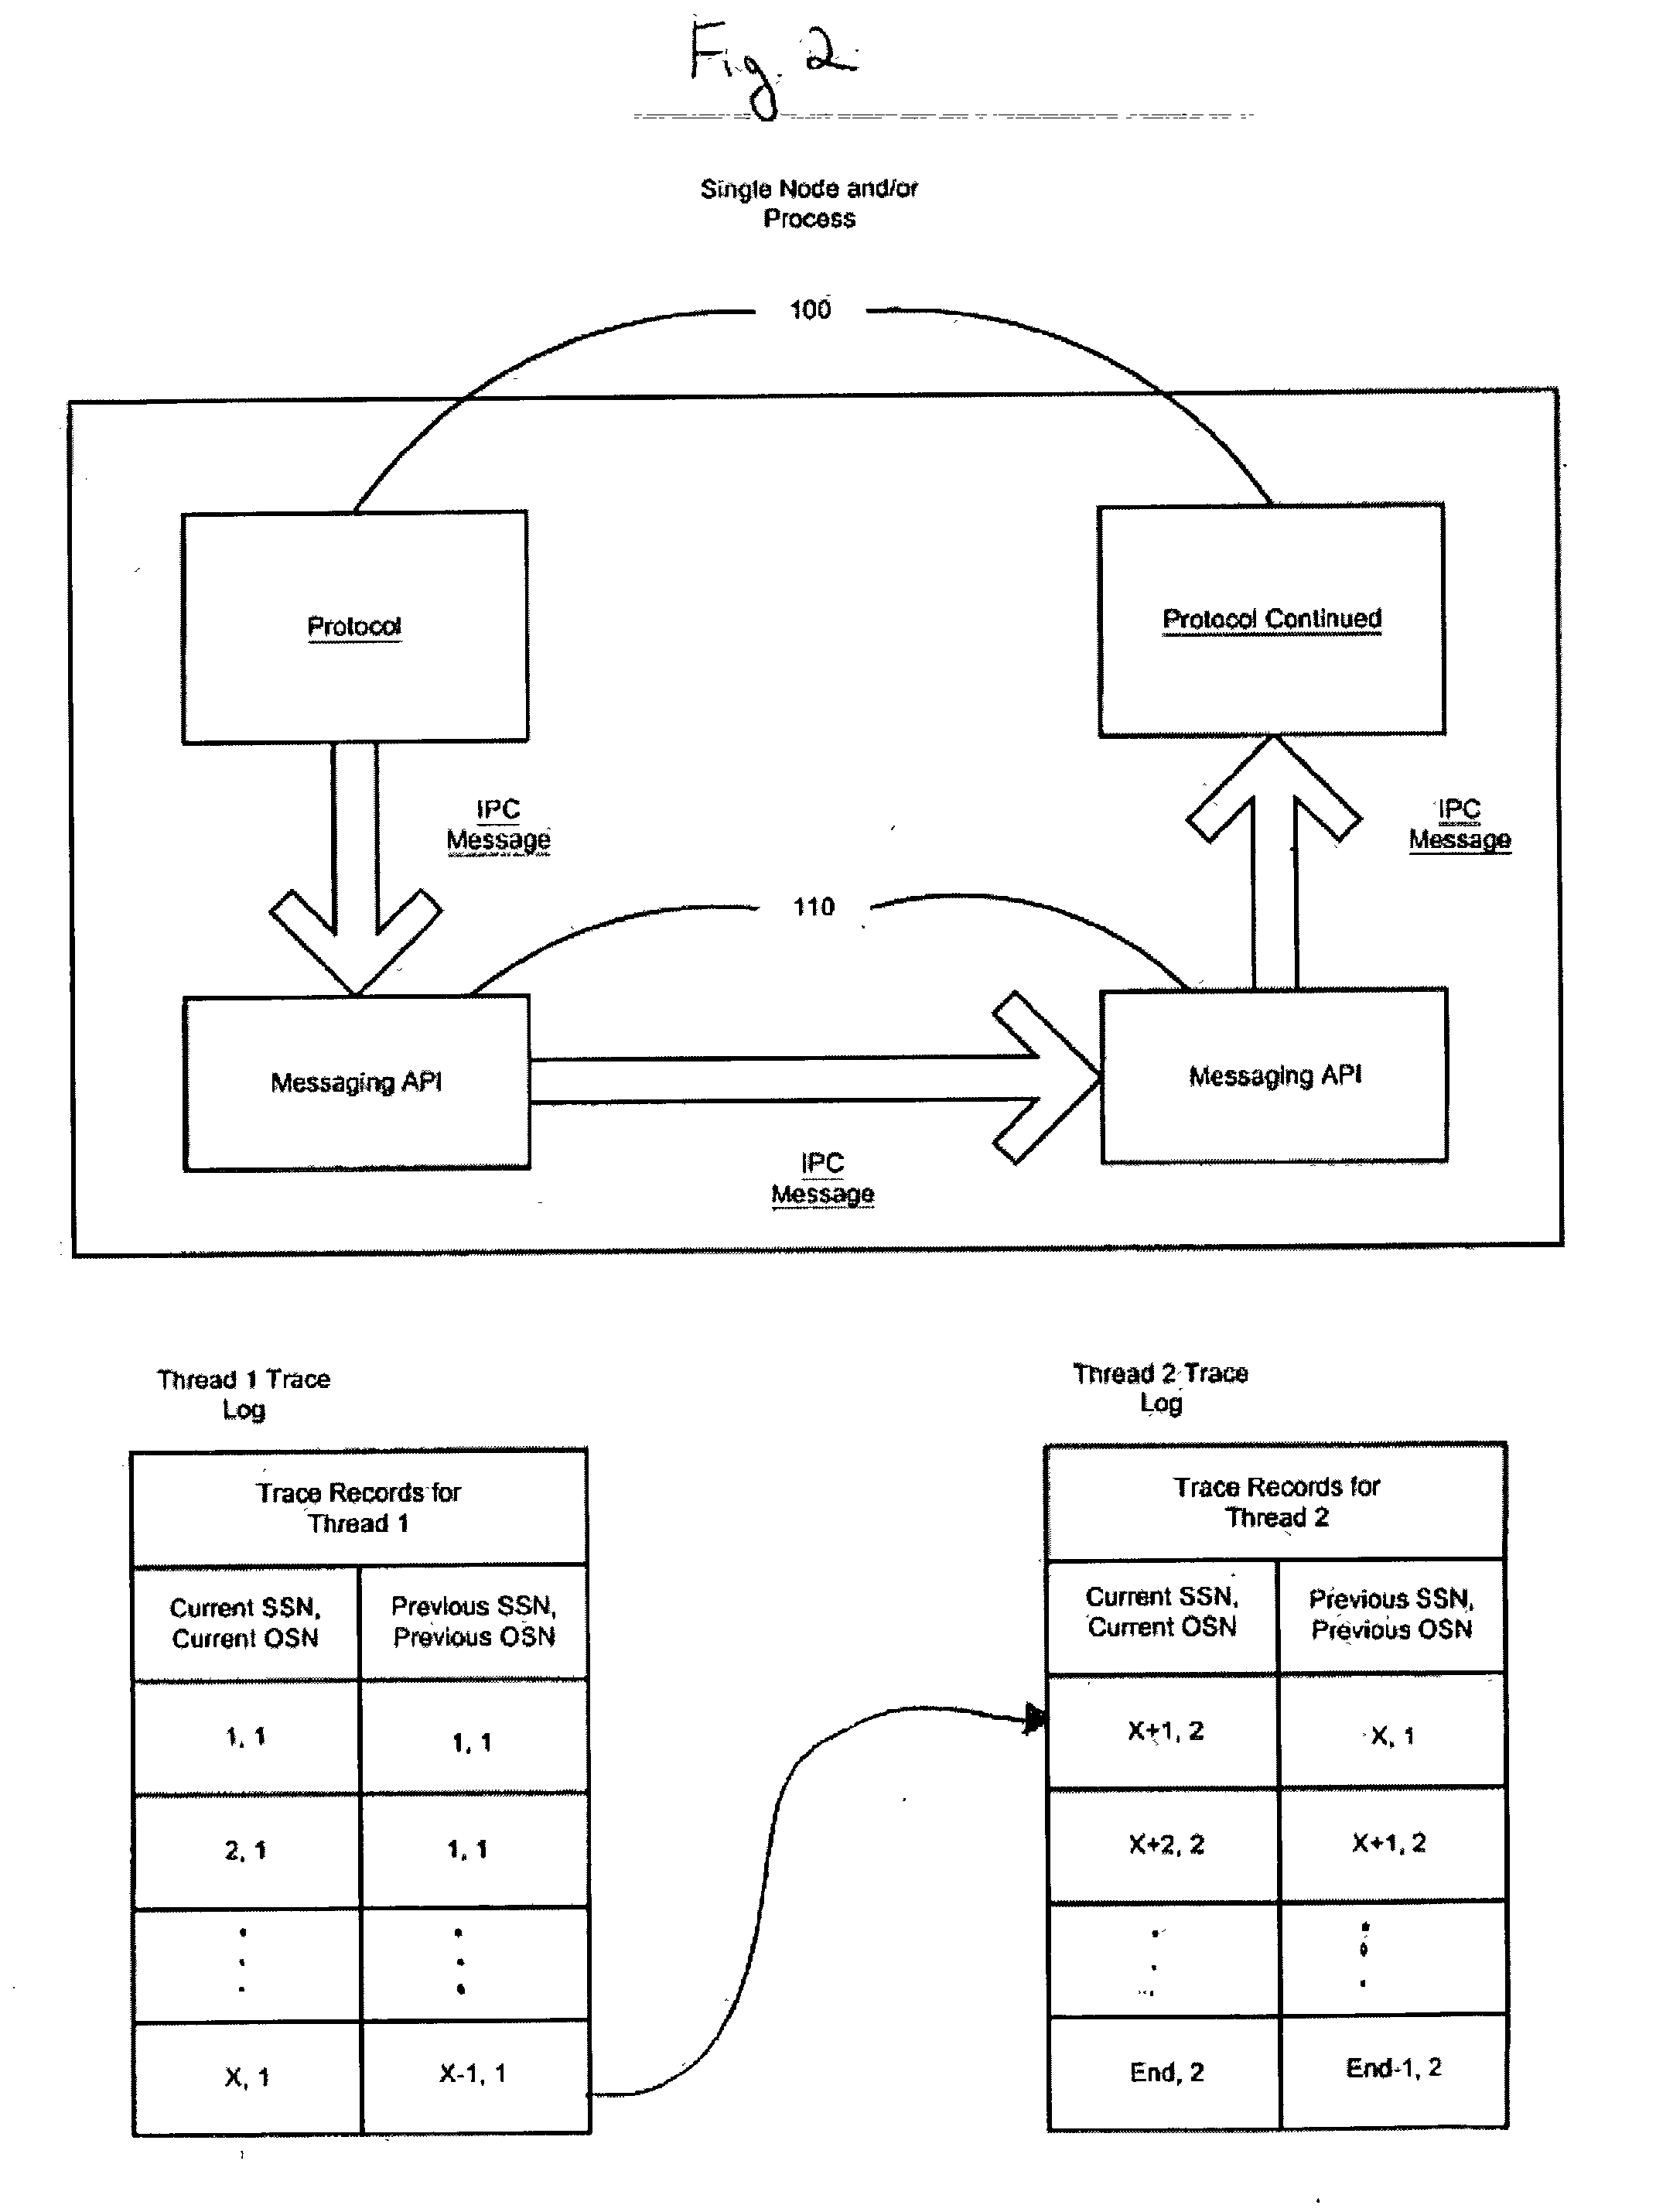
[0015] The present invention is disclosed in a number of different embodiments as methods and mechanisms for debugging a series of related events within a computer system. Some of the embodiments described are directed to one or more series of related events that span across multiple processes and / or multiple nodes. However, the principles presented here are applicable to any series of related events, including a series of related events within a single process and / or single node, and thus the scope of the invention is not to be limited to the exact embodiments shown herein.

[0016] Many computer applications execute one or more series of related events that span across multiple threads, processes, and / or nodes. For example, a computer application may be developed to query multiple databases residing on multiple nodes. The application may execute one or more queries that span across one or more of the multiple databases. When tracing such related events, trace data may be generated i...


PUM


Abstract

The present invention provides a method and mechanism for debugging a series of related events within a computer system. According to an embodiment, when tracing a series of related events that span across a plurality of threads, a token may be passed from one thread to another, thereby allowing a link between the threads to be marked within the one or more traces. The token may be passed via a messaging API, such as a network layer API or a shared resource. With this aspect of the invention, sufficient information will be provided within the one or more traces to allow all the related trace data to be linked together.

Description

BACKGROUND AND SUMMARY [0001] Tracing is an approach for logging the state of computer applications at different points during its course of execution. Tracing is normally implemented by inserting statements in the computer application code that outputs status / state messages (“traces”) as the statements are encountered during the execution of the code. Statements to generate traces are purposely placed in the computer application code to generate traces corresponding to activities of interest performed by specific sections of the code. The generated trace messages can be collected and stored during the execution of the application to form a trace log. [0002] Programmers often use tracing and trace logs to diagnose problems or errors that arise during the execution of a computer application. When such a problem or error is encountered, trace logs are analyzed to correlate trace messages with the application code to determine the sequence, origin, and effects of different events in th...

Claims


Application Information

Patent Timeline
IPC IPC(8): G06F9/46
CPCG06F11/3636G06F9/546
Inventor SRIVASTAVA, ALOK KUMARLAM, IVAN TINLUNGKUMAR, SUNIL
Owner ORACLE INT CORP
Why Eureka
Try Eureka