

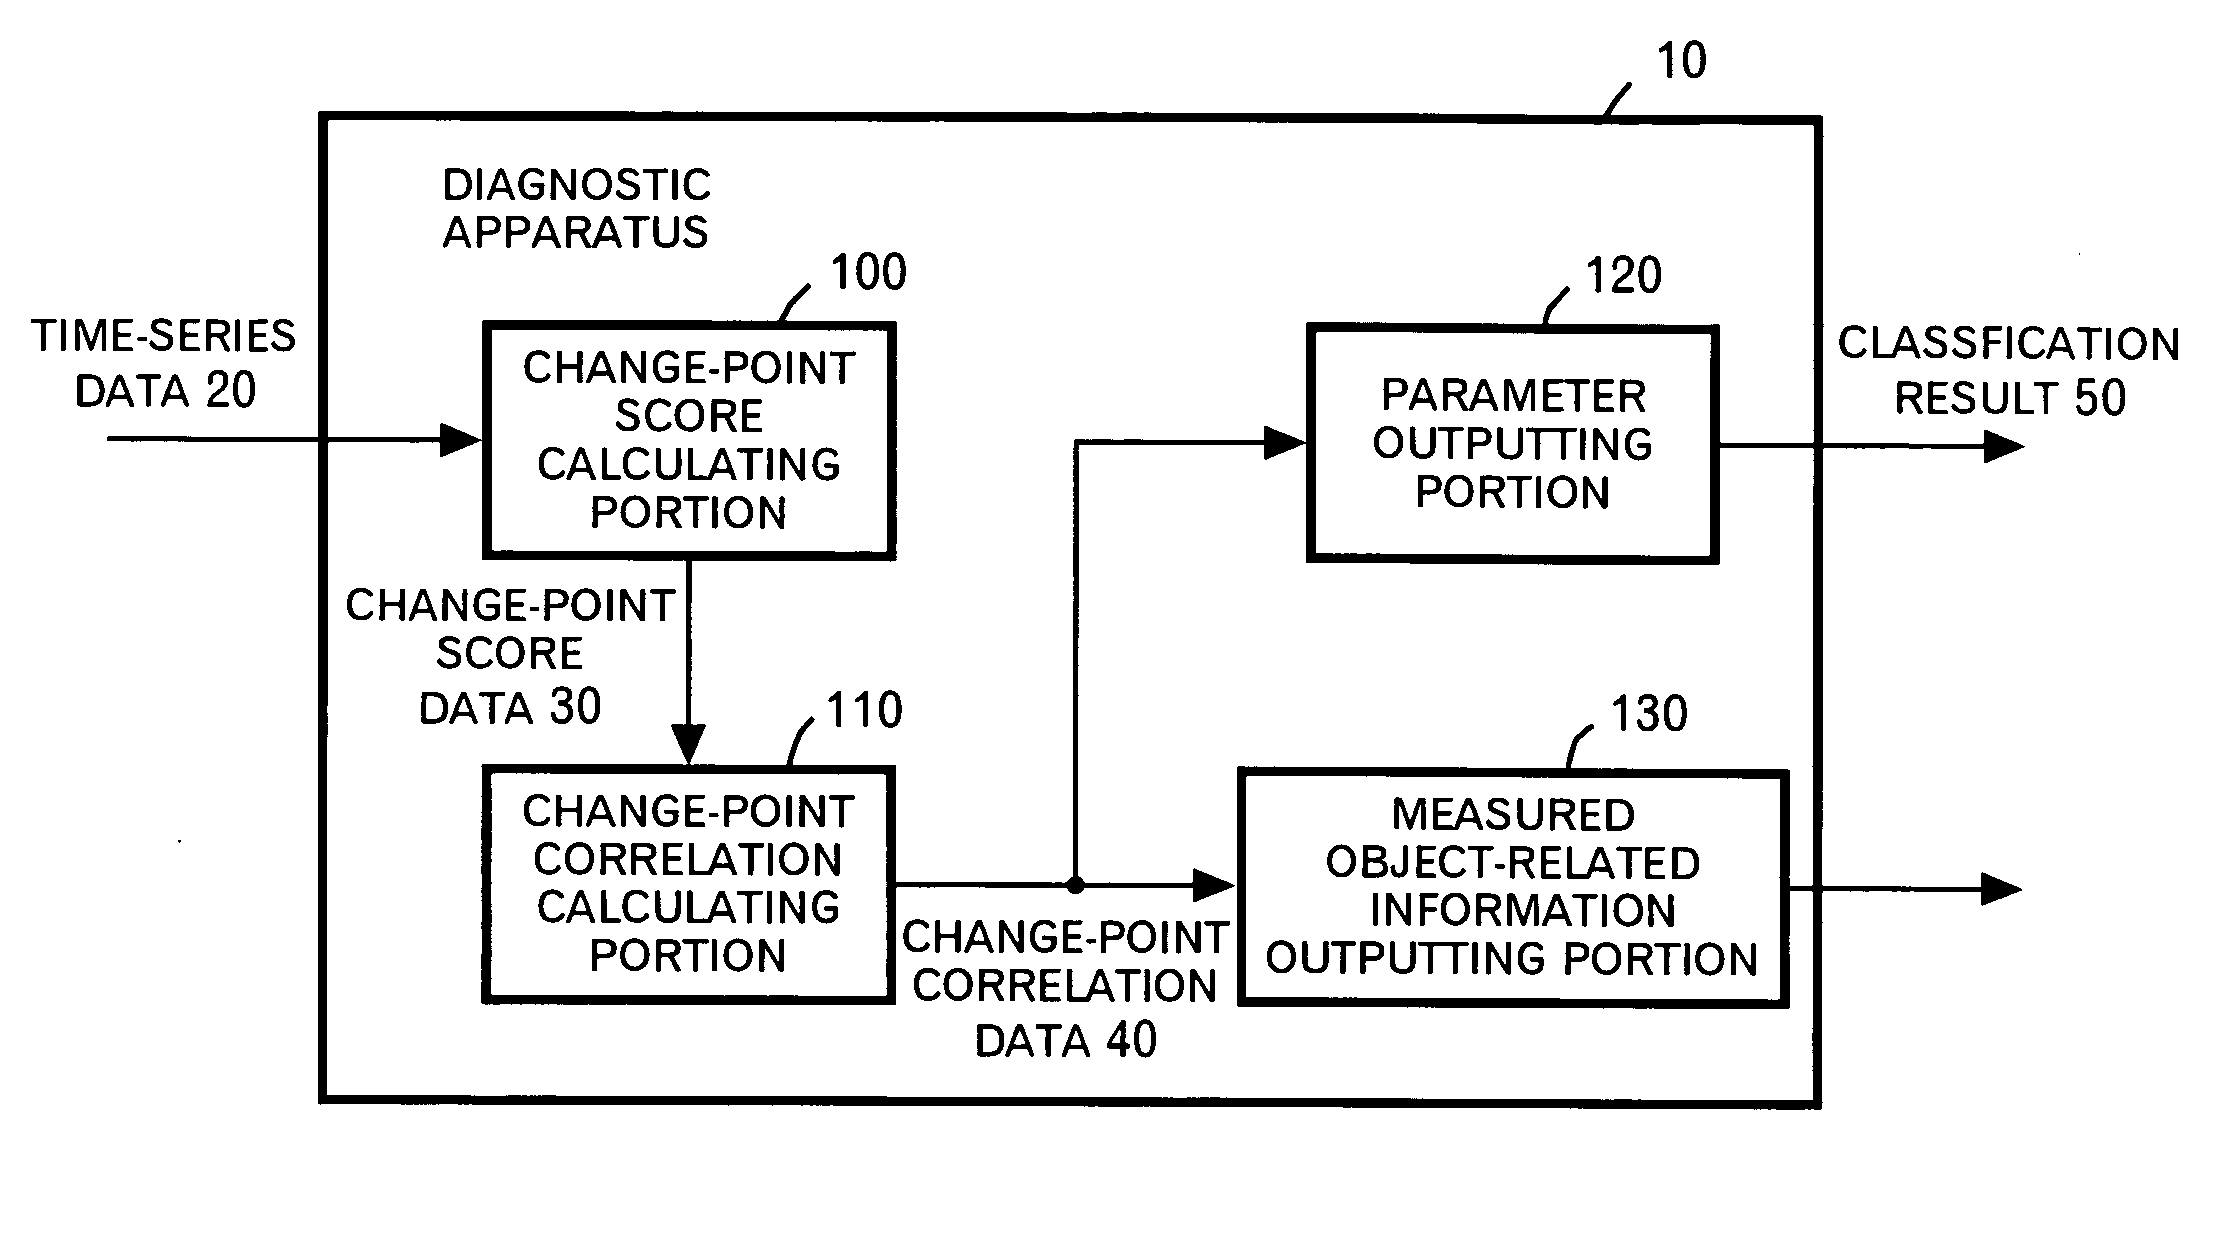
Diagnostic data detection and control
a technology for diagnostic data and control, applied in the direction of program control, total factory control, instruments, etc., can solve the problems of limit the repair made by an engineer at a repair plant, complicated control, and difficulty
- Summary
- Abstract
- Description
- Claims
- Application Information
AI Technical Summary
Benefits of technology
Problems solved by technology
Method used
Image

Examples
application example 1
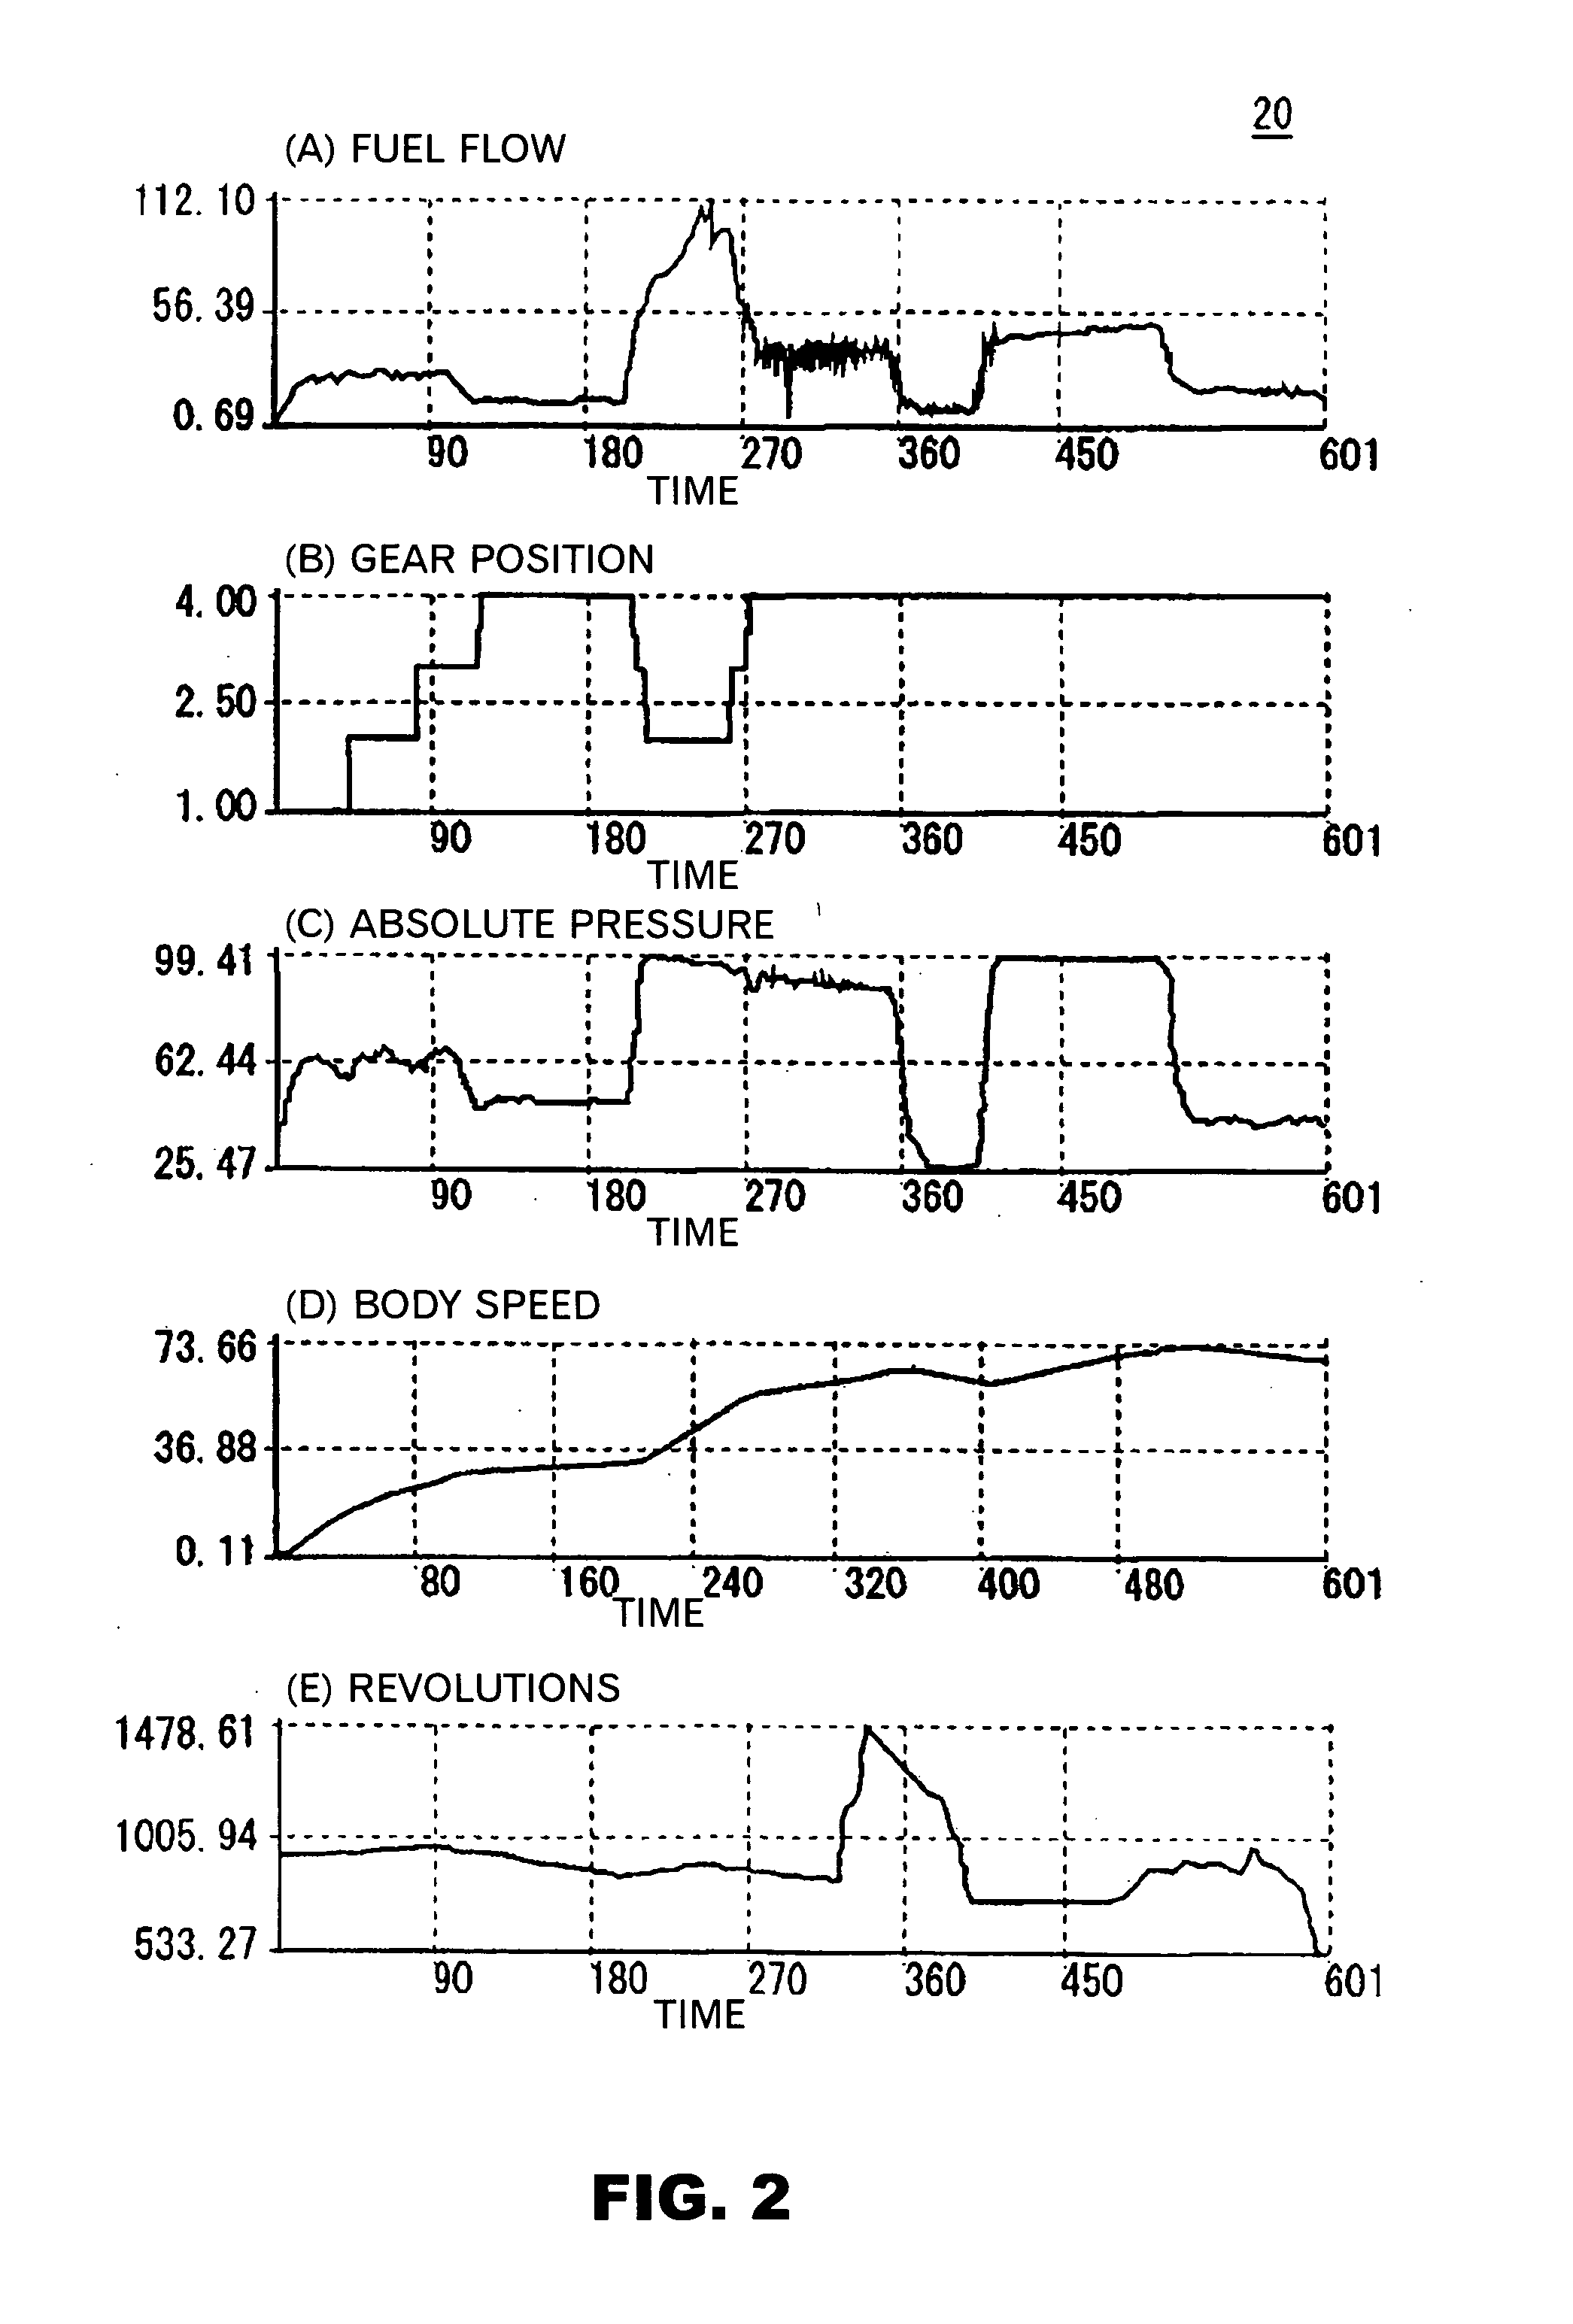
[0110] To begin with, the first application example will be described by using FIGS. 10 to 13. An object of the first application example is to diagnose the cause of the trouble in the case where the trouble that “the beat occurs to the revolutions” arises to a certain automobile.
[0111] In this example, the beat occurs to the revolutions of the engine, and so the parameter strongly associated with the revolutions of the engine should be selected and the portion to be measured of the parameter should be intensively checked and repaired. However, it is not easy to properly select the parameter strongly associated with the revolutions of the engine out of an enormous number of the measured parameters.
[0112] The automobile in recent years operates a program for detecting the trouble occurring to each portion thereof, and records identification data on the detected trouble in a memory. By way of example, an SAE code which is the identification data on various kinds of trouble is set up...
application example 2
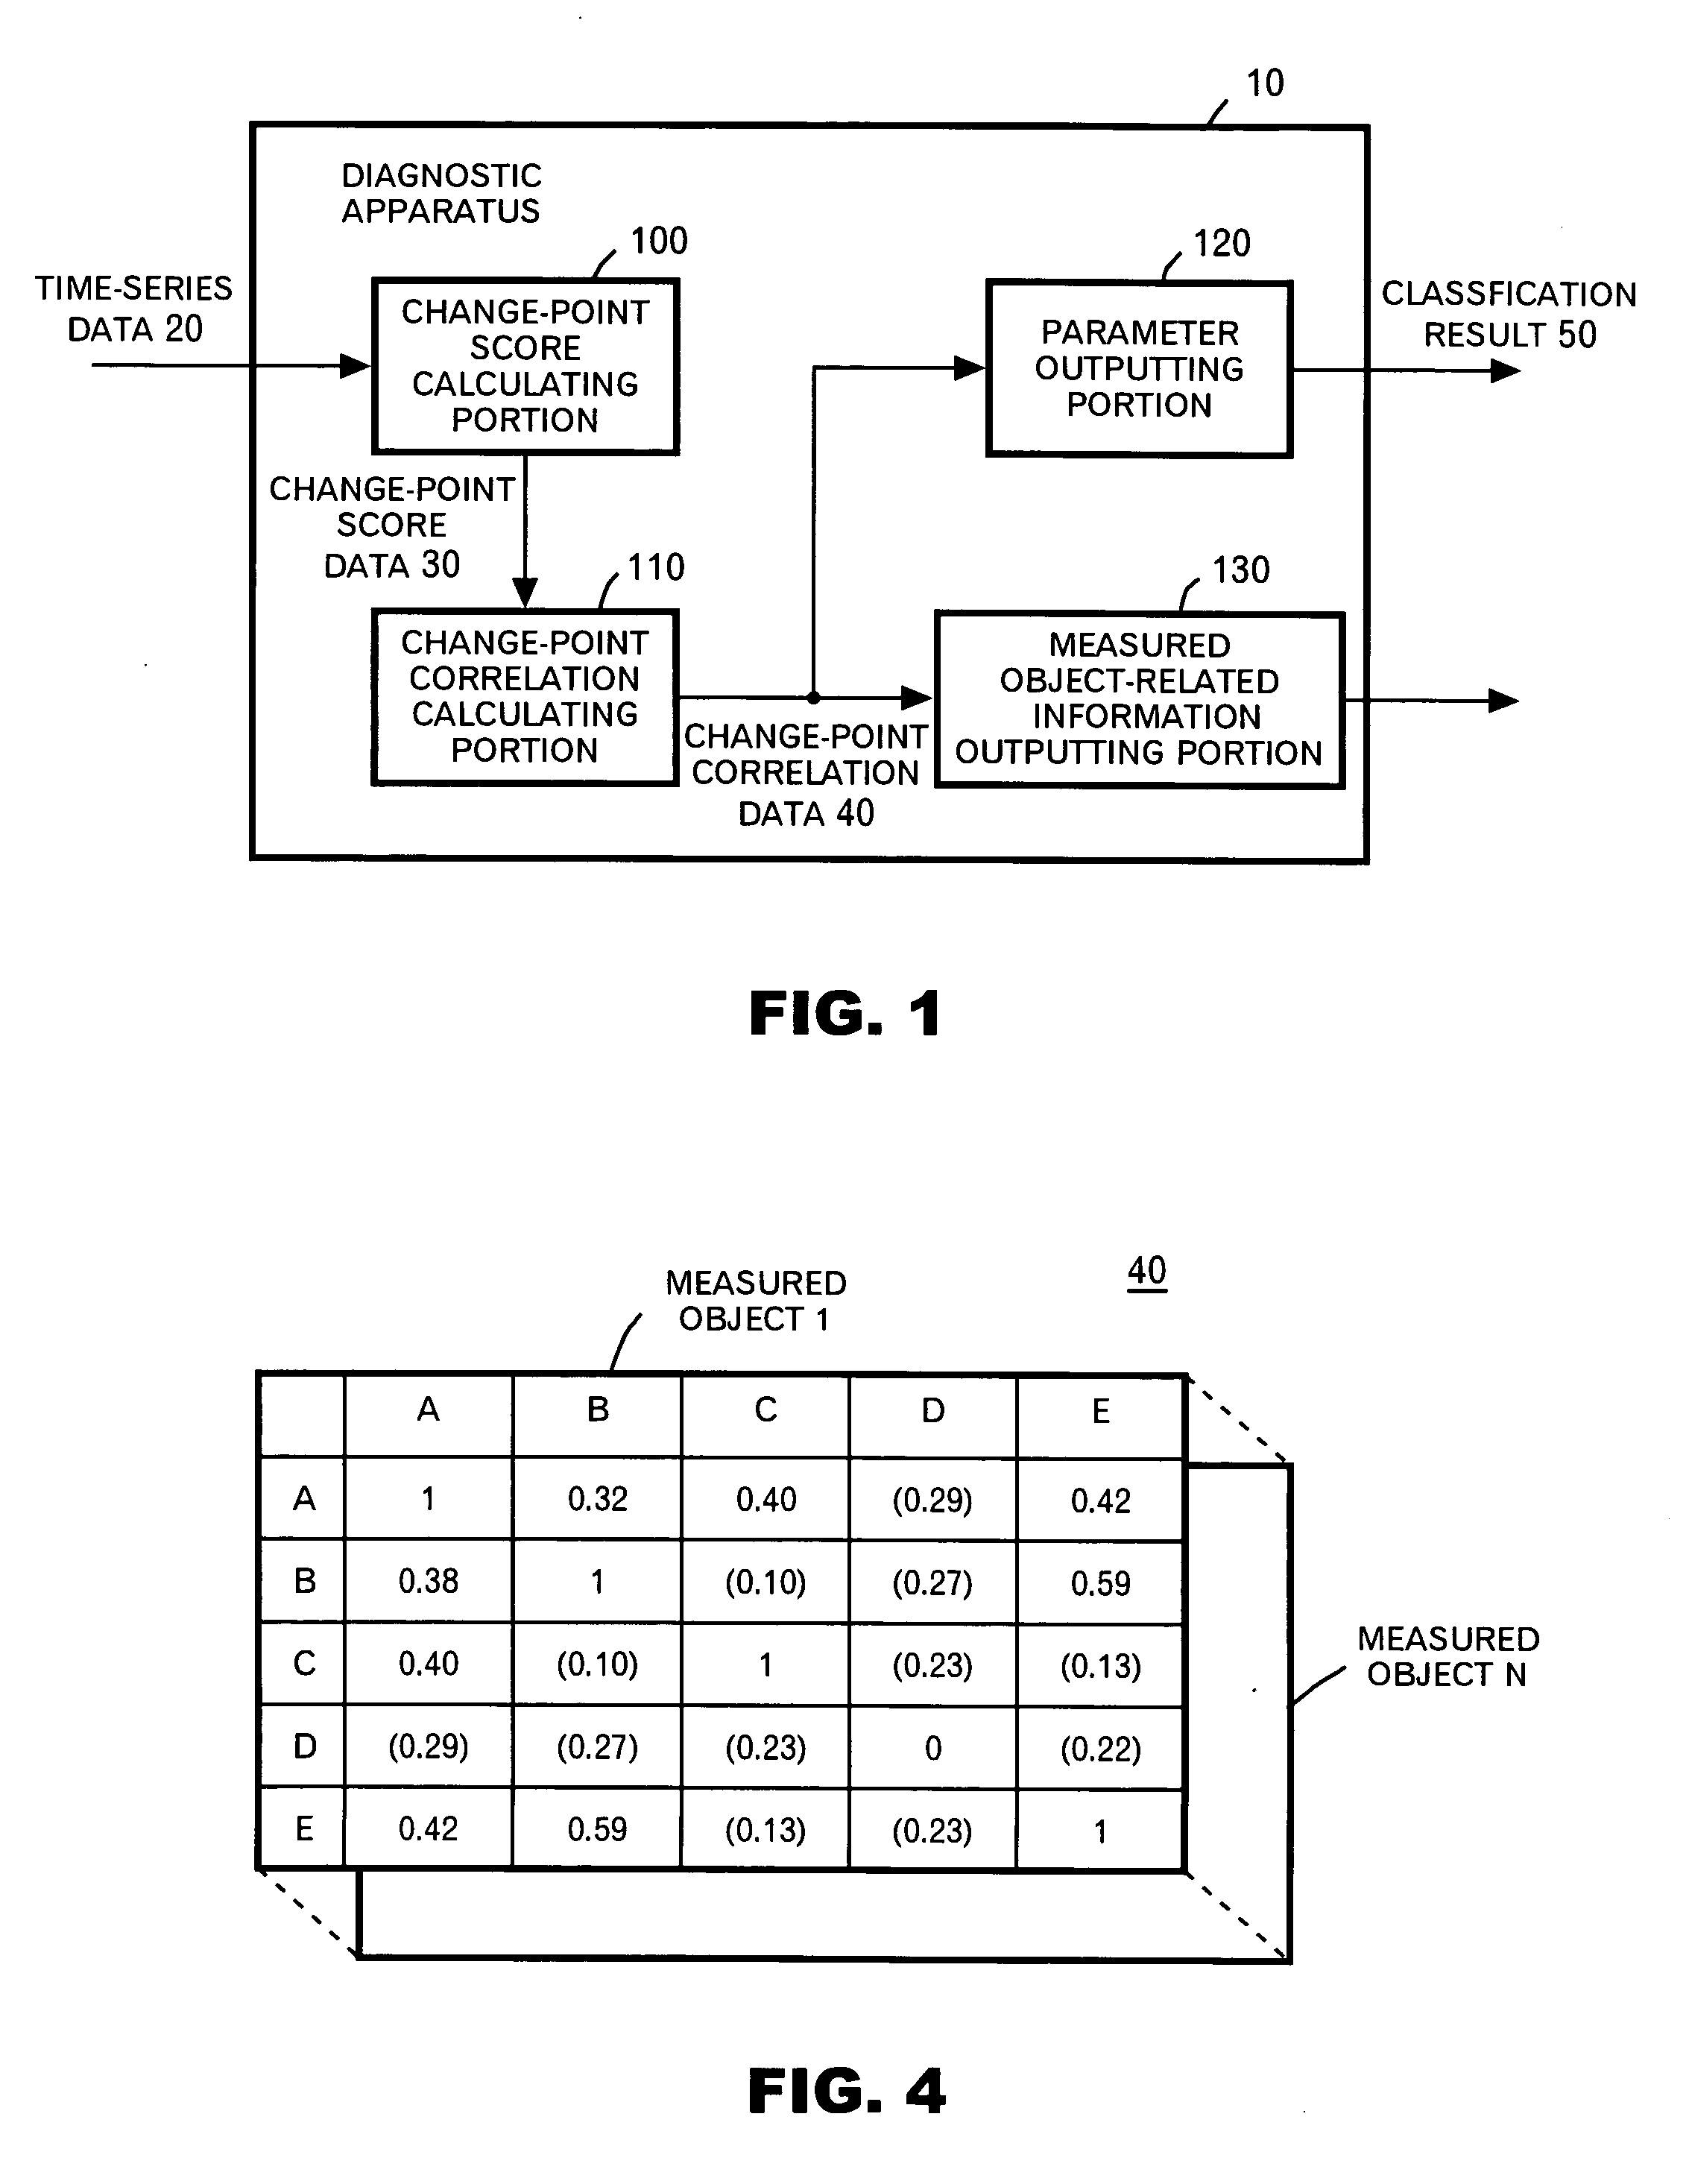
[0146] Subsequently, a second application example will be described by using FIGS. 14 and 15. The second application example shows a detailed example of the process of having the parameters classified by the parameter outputting portion 120 by using the distance between the parameters calculated by the change-point correlation calculating portion 110.
[0147]FIG. 14 shows an example of an operation flow of the process of the parameter outputting portion 120 in the second application example. In this example, the parameter outputting portion 120 uses K-means for grouping the vertices from the graph on which the distance between the vertices is determined. First, the parameter outputting portion 120 selects the parameter to be a seed of a group for each group based on the instruction from the user (S1300). And the parameter outputting portion 120 seeks the distances of all the parameters belonging to each group from a certain reference parameter so as to calculate the average thereof (...
application example 3
[0151] Subsequently, a third application example will be described by using FIGS. 16 and 17. The third application example shows another example of the process of having the parameters classified by the measured object-related information outputting portion 130 by using the distance between the parameters calculated by the change-point correlation calculating portion 110.
[0152]FIG. 16 shows an example of the operation flow of the process of the parameter outputting portion 120 in the third application example. As an initialization process, the parameter outputting portion 120 generates the group to which only that parameter belongs as to each parameter (S1600). And the parameter outputting portion 120 detects a set of groups of the shortest distance and merges these groups so as to cause the parameters belonging to these groups to belong to a new group (S1610).
[0153] The parameter outputting portion 120 calculates the distances between the newly merged group and the other groups (...
PUM
 Abstract
Description
Claims
Application Information