Method for using statistical analysis to monitor and analyze performance of new network infrastructure or software applications for deployment thereof

Inactive Publication Date: 2005-12-15
K5 SYST
View PDF9 Cites 141 Cited by
  • Summary
  • Abstract
  • Description
  • Claims
  • Application Information

AI Technical Summary

Benefits of technology

[0026] The invention provides methods for using statistical analysis to monitor p

Problems solved by technology

Furthermore, the production environments into which these software applications are being deployed have also increased in complexity and are often interlinked and inter-related with other ‘shared’ components.
For example, roughly half of all software patches and updates within enterprise environments fail when being applied and require some form IT operator intervention.
The issues are even worse when dealing with large scale applications that are designed and written by many different people, and when operating environments need to support large numbers of live users and transactions.
The core of the problem is rooted in the software release decision itself and the tradeoff that is made between the risks of downtime and application vulnerability.
All changes to the software code can have un-intended consequences to other applications or infrastructure components.
Thus far, the inability to quantify that risk in the deployment of software means that most decisions are made blindly, oftentimes with significant implications.
The problem is: how much testing is enough?
Ultimately, the complication is that the testing environments are simply different from production environments.
Furthermore, as i

Method used


Image

  • Method for using statistical analysis to monitor and analyze performance of new network infrastructure or software applications for deployment thereof
  • Method for using statistical analysis to monitor and analyze performance of new network infrastructure or software applications for deployment thereof
  • Method for using statistical analysis to monitor and analyze performance of new network infrastructure or software applications for deployment thereof

Examples


Embodiment Construction

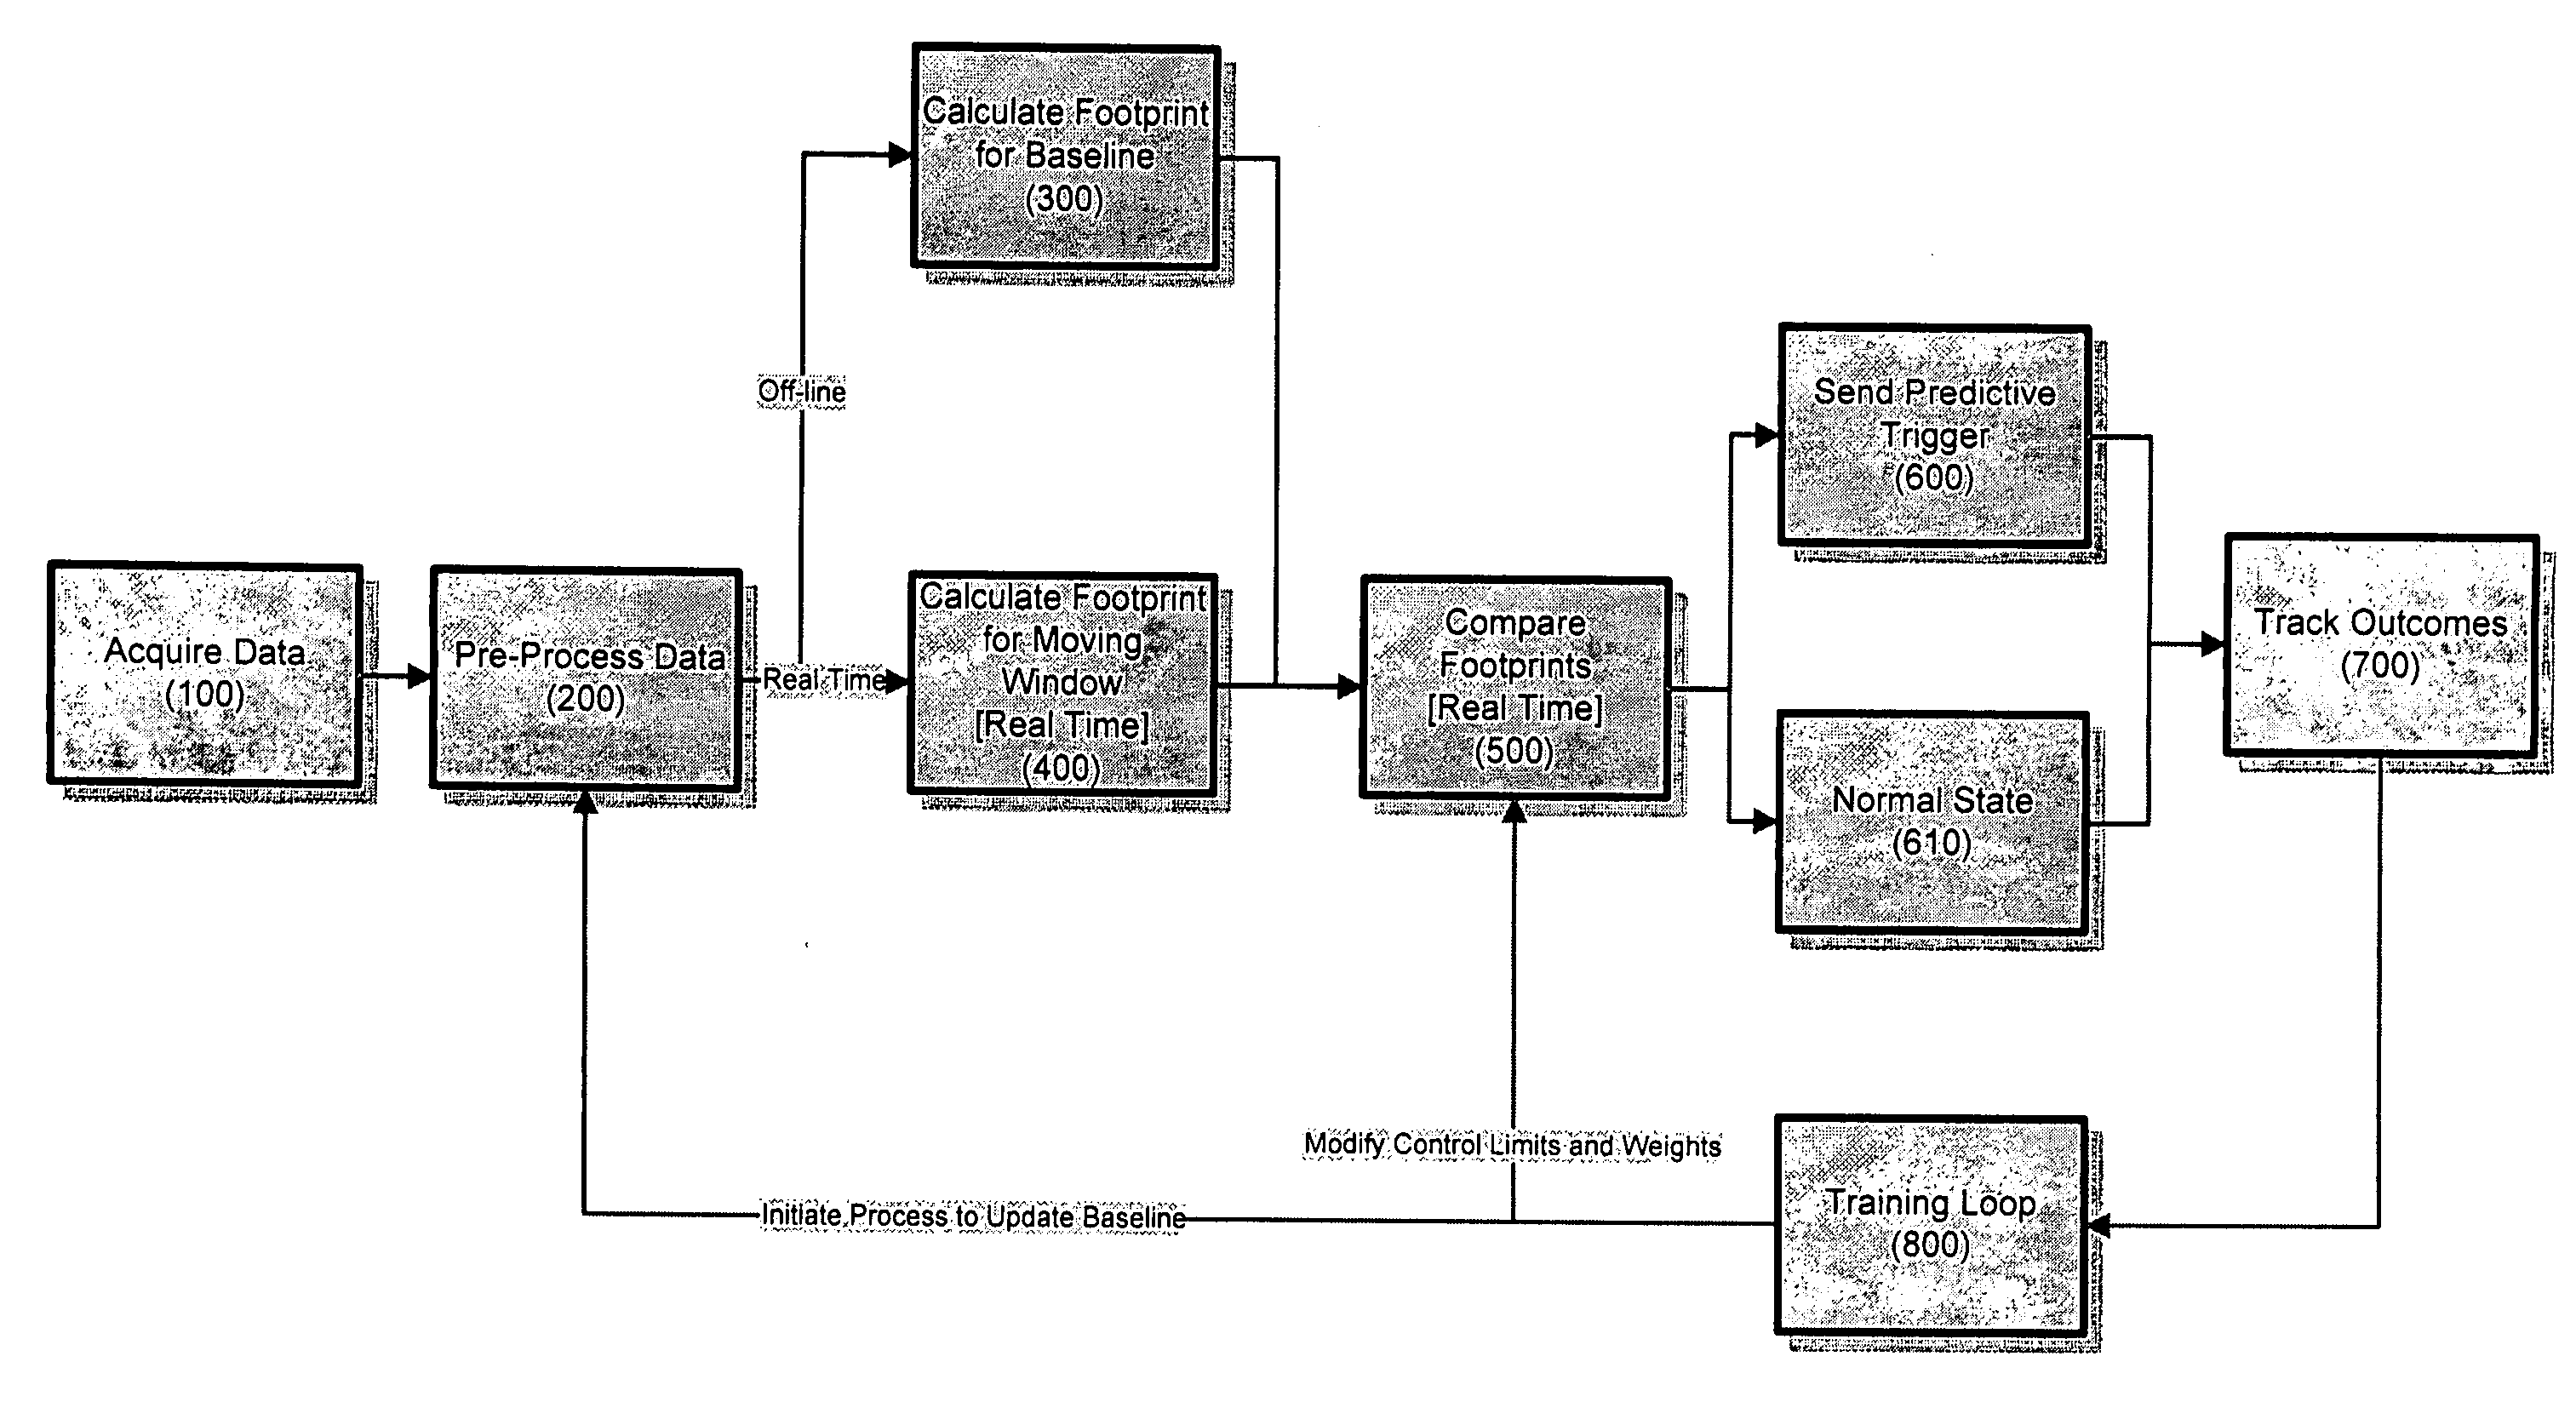
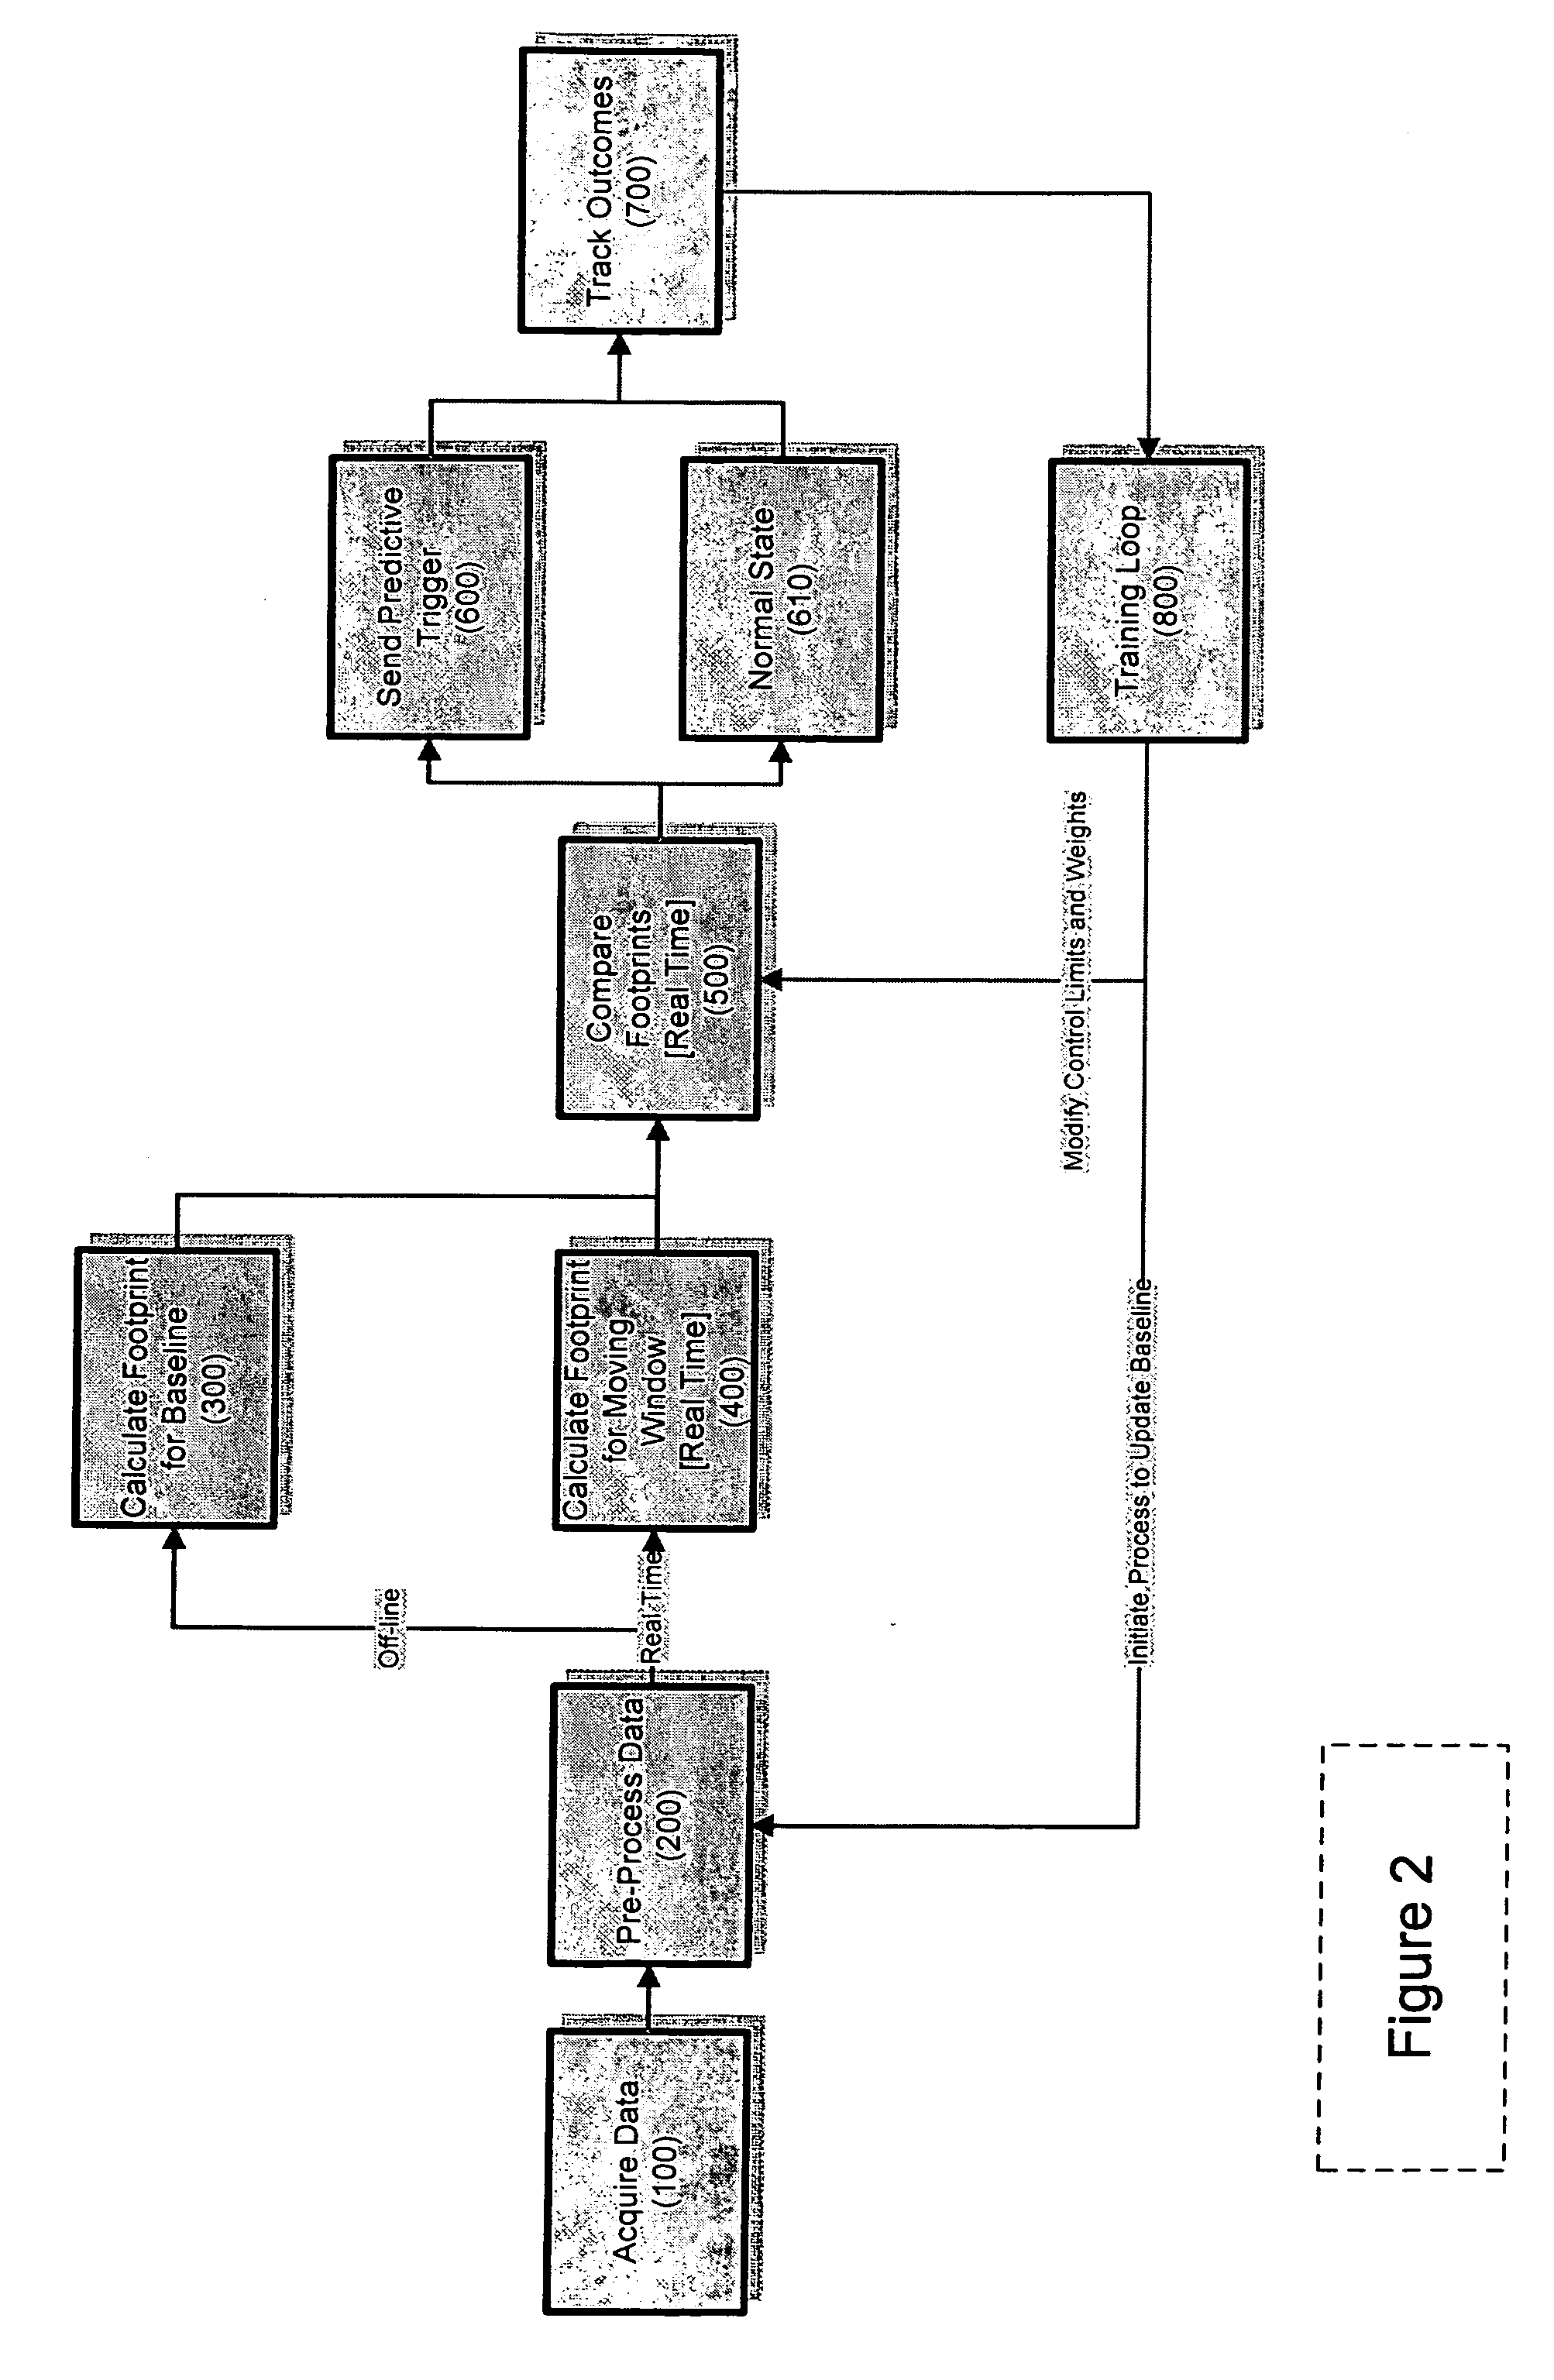
[0046] Preferred embodiments of the invention provide a method, system and computer program that simultaneously manages multiple, flexible groupings of software and infrastructure components based on real time deviations from an expected normative behavioral pattern (Footprint).

[0047] Footprint: Each Footprint is a statistical description of an expected pattern of behavior for a particular grouping of client applications and infrastructure components (Managed Unit). This Footprint is calculated using a set of mathematical and statistical techniques; it contains a set of numerical values that describe various statistical parameters. Additionally, a set of user configured and trainable weights as well as a composite control limit are also calculated and included as a part of the Footprint.

[0048] Input Data: These calculations are performed on a variety of input data for each Managed Unit. The input data can be categorized into two broad types: (a) Descriptive data such as monitored ...


PUM


Abstract

Methods for using statistical analysis to monitor performance of new network infrastructure and applications for deployment thereof. A method monitors a release of executing software applications or execution infrastructure to detect deviations in performance. A first set of time-series data is acquired from executing software applications and execution infrastructure. A first statistical description of expected behavior is derived from the first set of acquired data. A second set of time-series data is acquired from the monitored release of executing software applications and execution infrastructure. A second statistical description of behavior is derived from the second set of acquired data. The first and second statistical descriptions are compared to identify instances where the first and second statistical descriptions deviate sufficiently to indicate a statistically significant probability that an operating anomaly exists within the monitored release of executing software applications and execution infrastructure.

Description

CROSS REFERENCE TO RELATED APPLICATIONS [0001] This application claims priority under 35 U.S.C. § 19(e) to U.S. Provisional Patent Application Nos. 60 / 579,984 filed on Jun. 15, 2004, entitled Methods and Systems for Determining and Using a Software Footprint, which is incorporated herein by reference in their entirety. [0002] This application is related to the following U.S. patent applications (Ser. Nos. ______ TBA), filed on an even date herewith, entitled as follows: [0003] System and Method for Monitoring Performance of Arbitrary Groupings of Network Infrastructure and Applications; [0004] System and Method for Monitoring Performance of Network Infrastructure and Applications by Automatically Identifying System Variables or Components Constructed from Such Variables that Dominate Variance of Performance; and [0005] Method for Using Statistical Analysis to Monitor and Analyze Performance of New Network Infrastructure or Software Applications Before Deployment Thereof.BACKGROUND [...

Claims


Application Information

Patent Timeline
IPC IPC(8): G06F9/44G06F9/445H04L12/24H04L12/26
CPCG06F11/0709H04L67/22G06F11/3419G06F11/3447G06F11/3466G06F11/3495G06F2201/81G06F2201/865H04L12/2602H04L41/0213H04L41/0681H04L41/0893H04L41/142H04L41/147H04L41/5009H04L41/5032H04L41/5054H04L41/5064H04L43/00H04L43/028H04L43/065H04L43/067H04L43/16G06F11/3452G06F2201/835G06F11/0751H04L67/535
Inventor LO, KEVIN H.CHUNG, RICHARD Y.
Owner K5 SYST
Why Eureka
Try Eureka