Determination of RNA quality
a quality and rna technology, applied in the field of rna quality determination, can solve the problems of limited usefulness of ffpe samples, add to the level of rna degradation,
- Summary
- Abstract
- Description
- Claims
- Application Information
AI Technical Summary
Benefits of technology
Problems solved by technology
Method used
Image
Examples
example 1
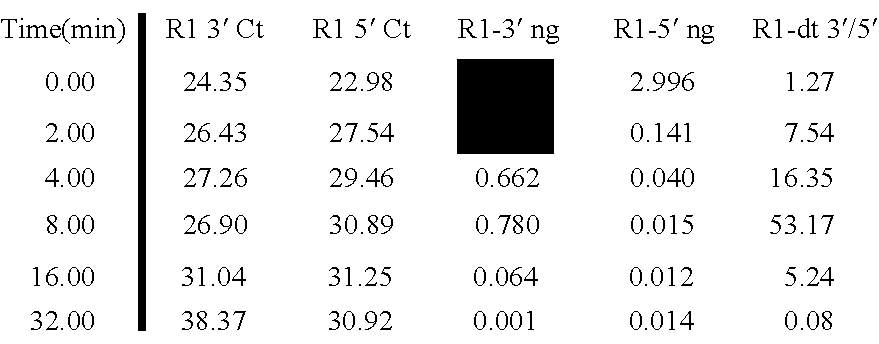
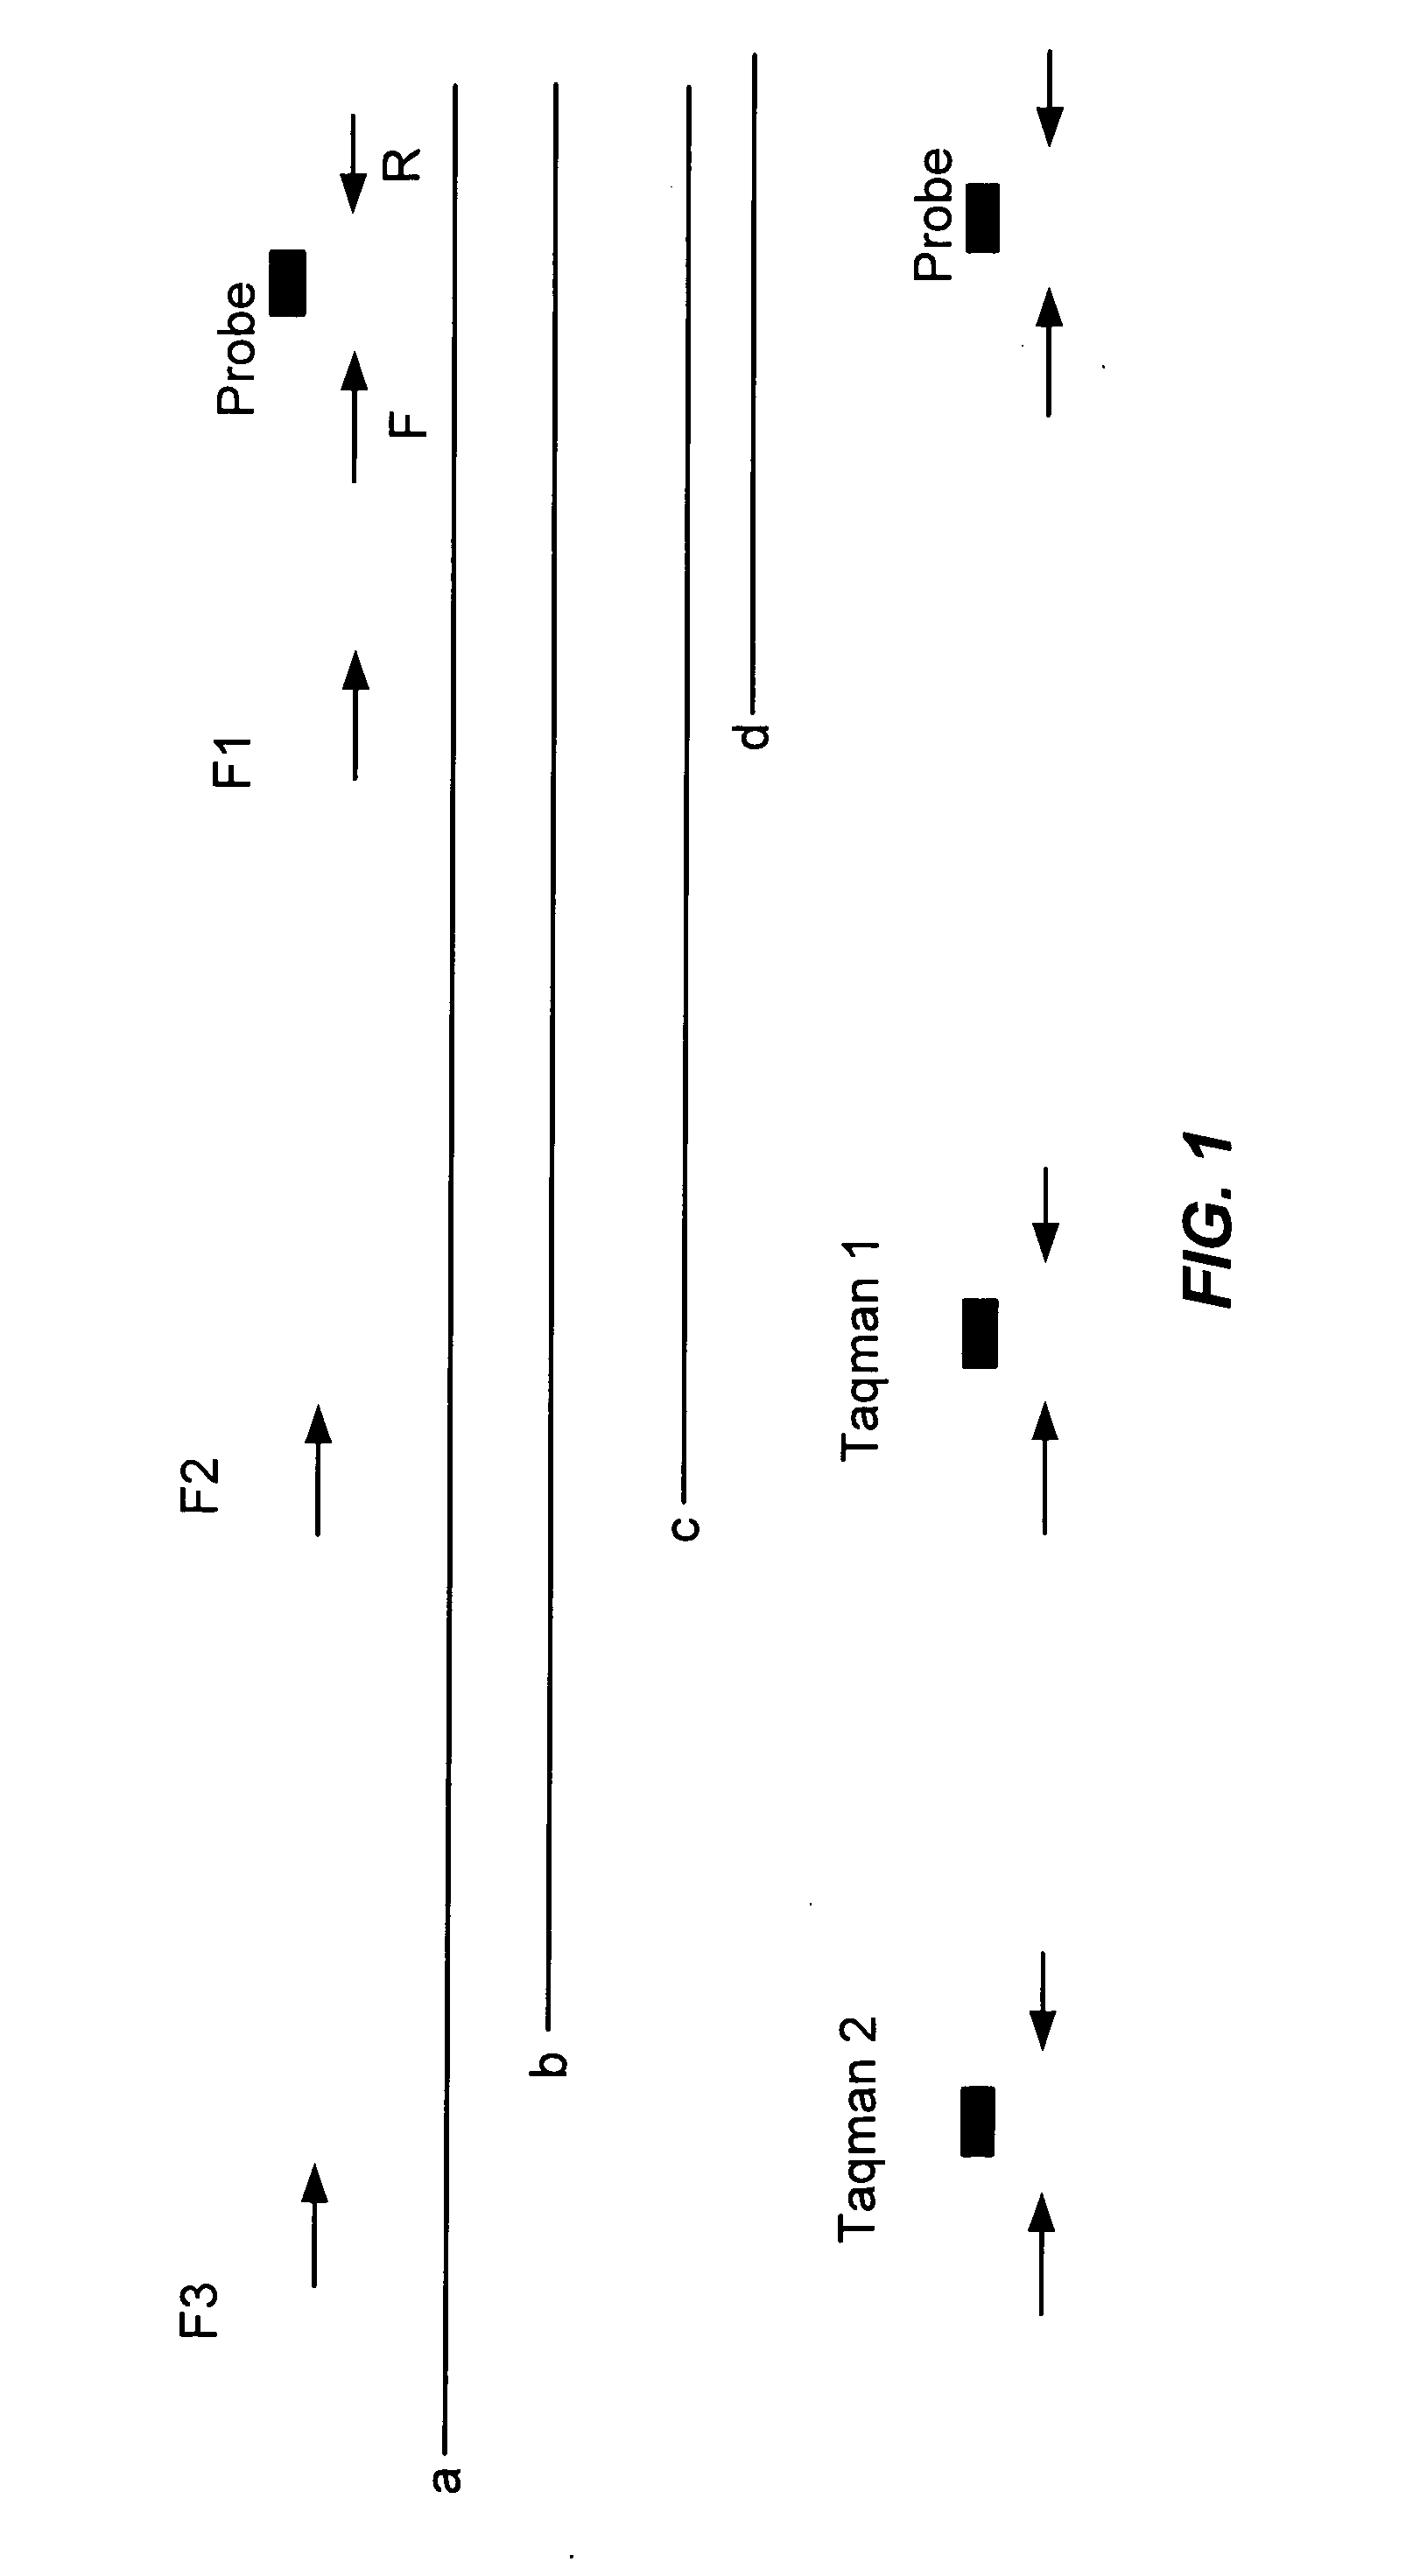
[0078] Quality assessment process Quantitative PCR was conducted based on amplicons located 100 and 400 nucleotides away from the 3′ end of the β-actin MRNA. See FIG. 2. The quantity of RNA is calculated based on Ct values from each amplicon. The ratio of the quantities of the 3′ (first) amplicon and the 5′ (second) amplicon are used as a metric for RNA quality assessment.
[0079] The 3′ to 5′ ratios of the respective amplicons from the β-actin MRNA for a variety of samples are shown in FIG. 3 in combination with the mean fluorescence intensity of signals of amplified and labeled molecules obtained from RNA in the samples and hybridized to a microarray. As FIG. 3, the higher the 3′ / 5′ ratio the more degraded the sample. This is evident in the CY5 signal (top graph) which shows that with larger 3′ / 5′ ratios (bottom graph) comes lower mean intensities of the CY5 signal on the array.
example 2
Comparisons to Bioanalyzer Profiles
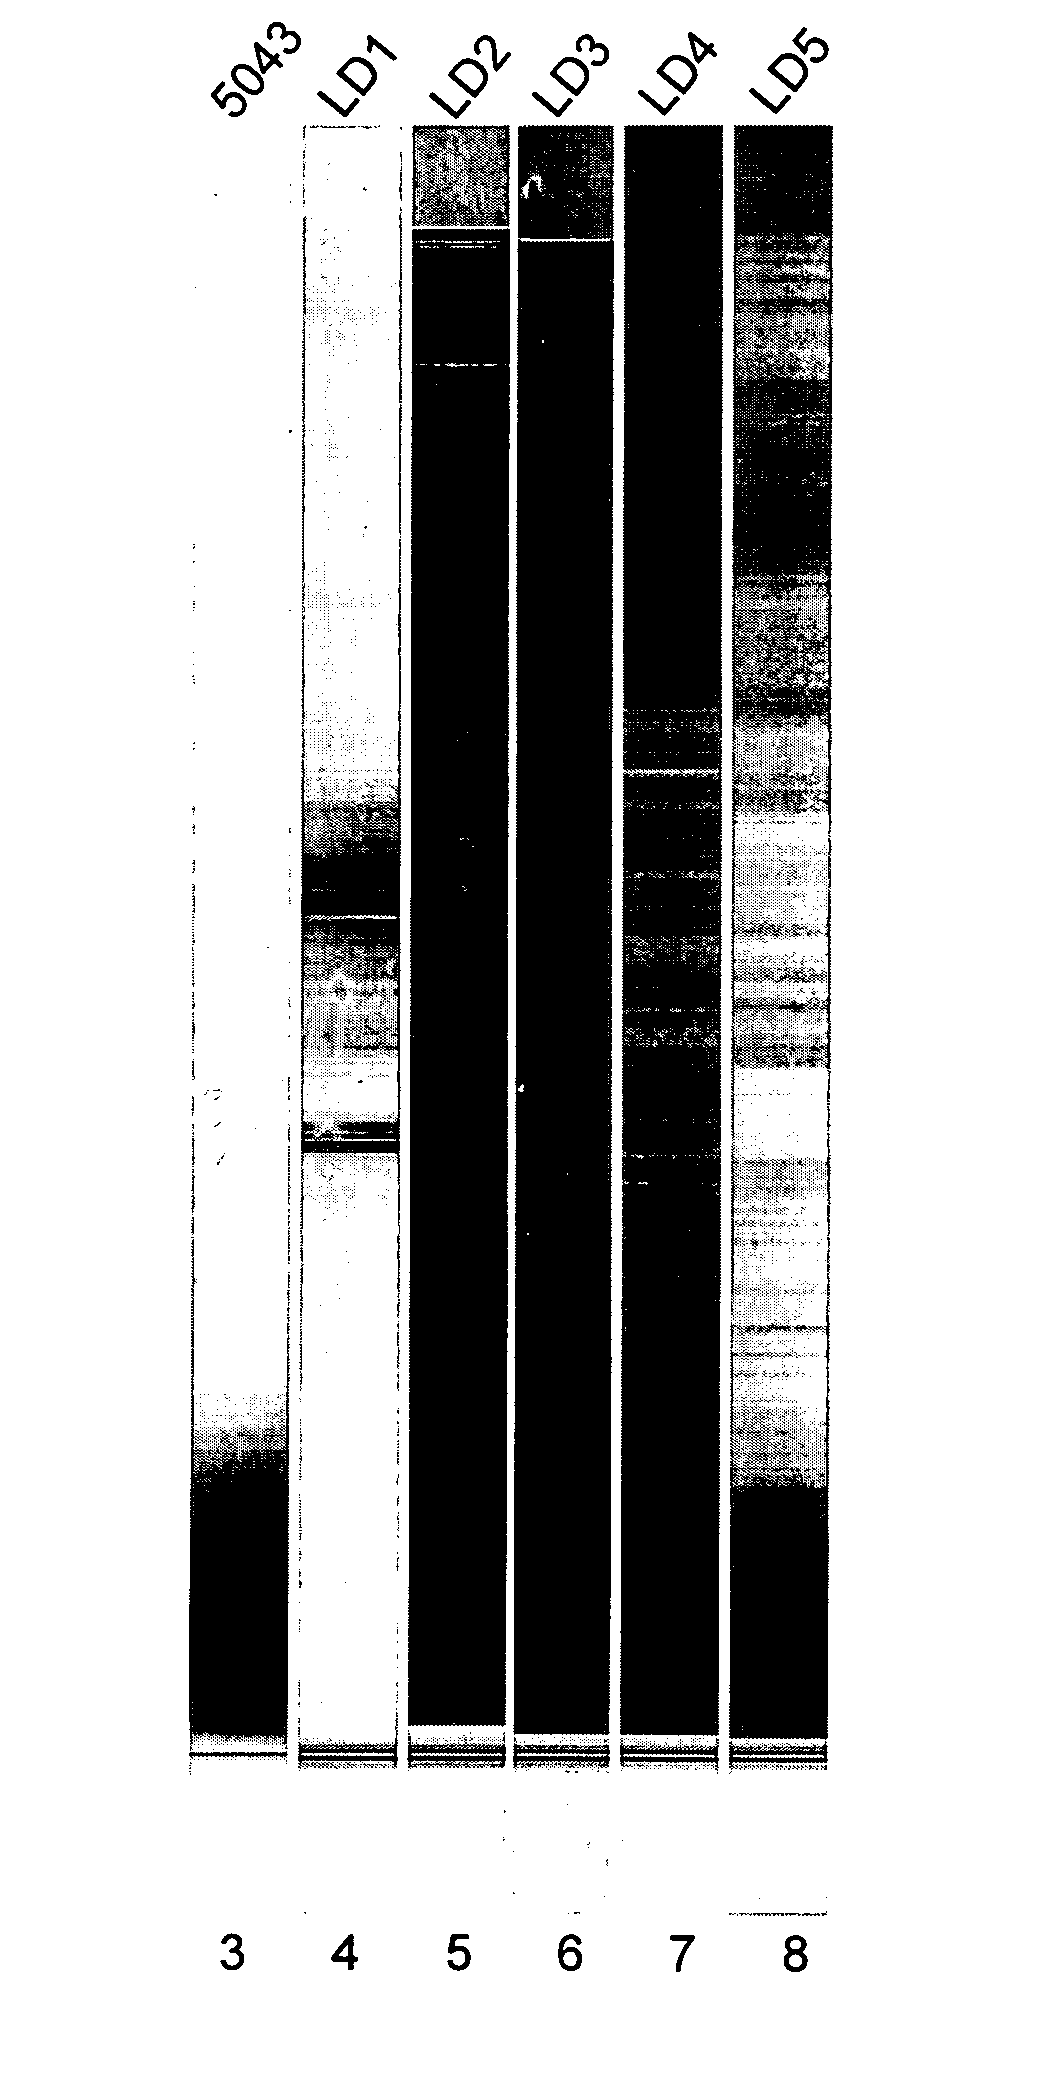
[0080] Bioanalyzer profiles of total RNA isolated from formalin-fixed and paraffin-embedded (FFPE) RNA can look very different from conventional profiles seen from good quality total RNA from frozen tissue. While it is sometimes possible to see 18S / 28S ribosomal RNA bands in FFPE RNA, it is more likely that the majority of samples will not show clear 18S / 28S peaks. It is possible however, to judge the quality of RNA from Bioanalyzer profiles in many cases (see FIG. 4 and their associated QRT-PCR results). The profiles also provide a rough estimate of the amount of RNA isolated per unit area. In certain cases, the quality of RNA may need to be confirmed using additional assays such as QRT-PCR.
[0081] The profiles in FIG. 4 are generated from 1 ng of FFPE RNA following RNA extraction isolation (using the Paradise™ Reagent System from Arcturus Bioscience, Inc.) from macro-dissected tumor area within the tissue sections. These runs were performed on a...
example 3
Exemplary Protocols Using Two cDNA Methods and Two PCR Instruments
[0085] This protocol provides a method of assessing the quality of the RNA in formalin fixed paraffin embedded (FFPE) samples. Total RNA from a 0.5 cm×0.5 cm tissue scrape was processed following the protocol provided with the Paradise™ Reagent System or the Invitrogen Superscript First-Strand Synthesis Kit. A portion of this RNA is used to perform a test according to the present invention. The test involves a reverse transcription of the total RNA followed by quantitative PCR. In addition to the sample a control RNA is also be conducted. This control sample serves as the template for a standard curve which permits quantitation of the sample material.
[0086] Two primer sets are used in this protocol. The ratio of the RNA quantity determined using two different primer sets is an indicator of the quality of RNA in the sample. The following includes protocols for use with the Light Cycler Real Time Instrument as well as...
PUM
| Property | Measurement | Unit |
|---|---|---|
| volume | aaaaa | aaaaa |
| Ct | aaaaa | aaaaa |
| β- | aaaaa | aaaaa |
Abstract
Description
Claims
Application Information
 - R&D
- Intellectual Property
- Life Sciences
- Materials
- Tech Scout
- Unparalleled Data Quality
- Higher Quality Content
- 60% Fewer Hallucinations
Browse by: Latest US Patents, China's latest patents, Technical Efficacy Thesaurus, Application Domain, Technology Topic, Popular Technical Reports.
© 2025 PatSnap. All rights reserved.Legal|Privacy policy|Modern Slavery Act Transparency Statement|Sitemap|About US| Contact US: help@patsnap.com


