Computer systems and methods for visualizing data with generation of marks

a technology of data and marks, applied in computing, instruments, electric digital data processing, etc., can solve the problems of inability to comprehend human brains easily, complex data arises, and interactive calculations that require visiting each record are not plausibl

Active Publication Date: 2006-09-14
TABLEAU SOFTWARE INC
View PDF72 Cites 194 Cited by
  • Summary
  • Abstract
  • Description
  • Claims
  • Application Information

AI Technical Summary

Benefits of technology

[0013] The present invention provides improved methods for visualizing data.

Problems solved by technology

Current challenges include the ability to provide fast ways of coping with data that exists within a complex parameter space.
Data resides in multi-dimensional spaces which harbor rich and variegated landscapes that are not only strange and convoluted, but are not readily comprehendible by the human brain.
The most complicated data arises from measurements or calculations that depend on many apparently independent variables.
One challenge with any of these databases is the extraction of meaning from the data they contain: to discover structure, find patterns, and derive causal relationships.
Often, the sheer size of these data sets complicates this task and means that interactive calculations that require visiting each record are not plausible.
It may also be infeasible for an analyst to reason about or view the entire data set at its finest level of detail.
Even when the data sets are small, however, their complexity often makes it difficult to glean meaning without aggregating the data or creating simplifying summaries.
Data comes in many forms, and the most appropriate way to display one form is not the best for another.
However, although software programs that implement such approaches are useful, they are often unsatisfactory.
However, the task of effectively visualizing large databases imposes significant demands on the human-computer interface to the visualization system.
The path of exploration is unpredictable, and analysts need to be able to easily change both the data being displayed and its visual representation.
A drawback with the formal graphical specifications of the art is that they do not provide a user with a means to control or influence the results.
Accordingly, such formal graphical specifications do not provide a satisfactory way to analyze databases.
However, these visual query tools do not provide a user with particularly significant labor savings in deciding how best to display data rapidly.

Method used


Image

  • Computer systems and methods for visualizing data with generation of marks
  • Computer systems and methods for visualizing data with generation of marks
  • Computer systems and methods for visualizing data with generation of marks

Examples


Embodiment Construction

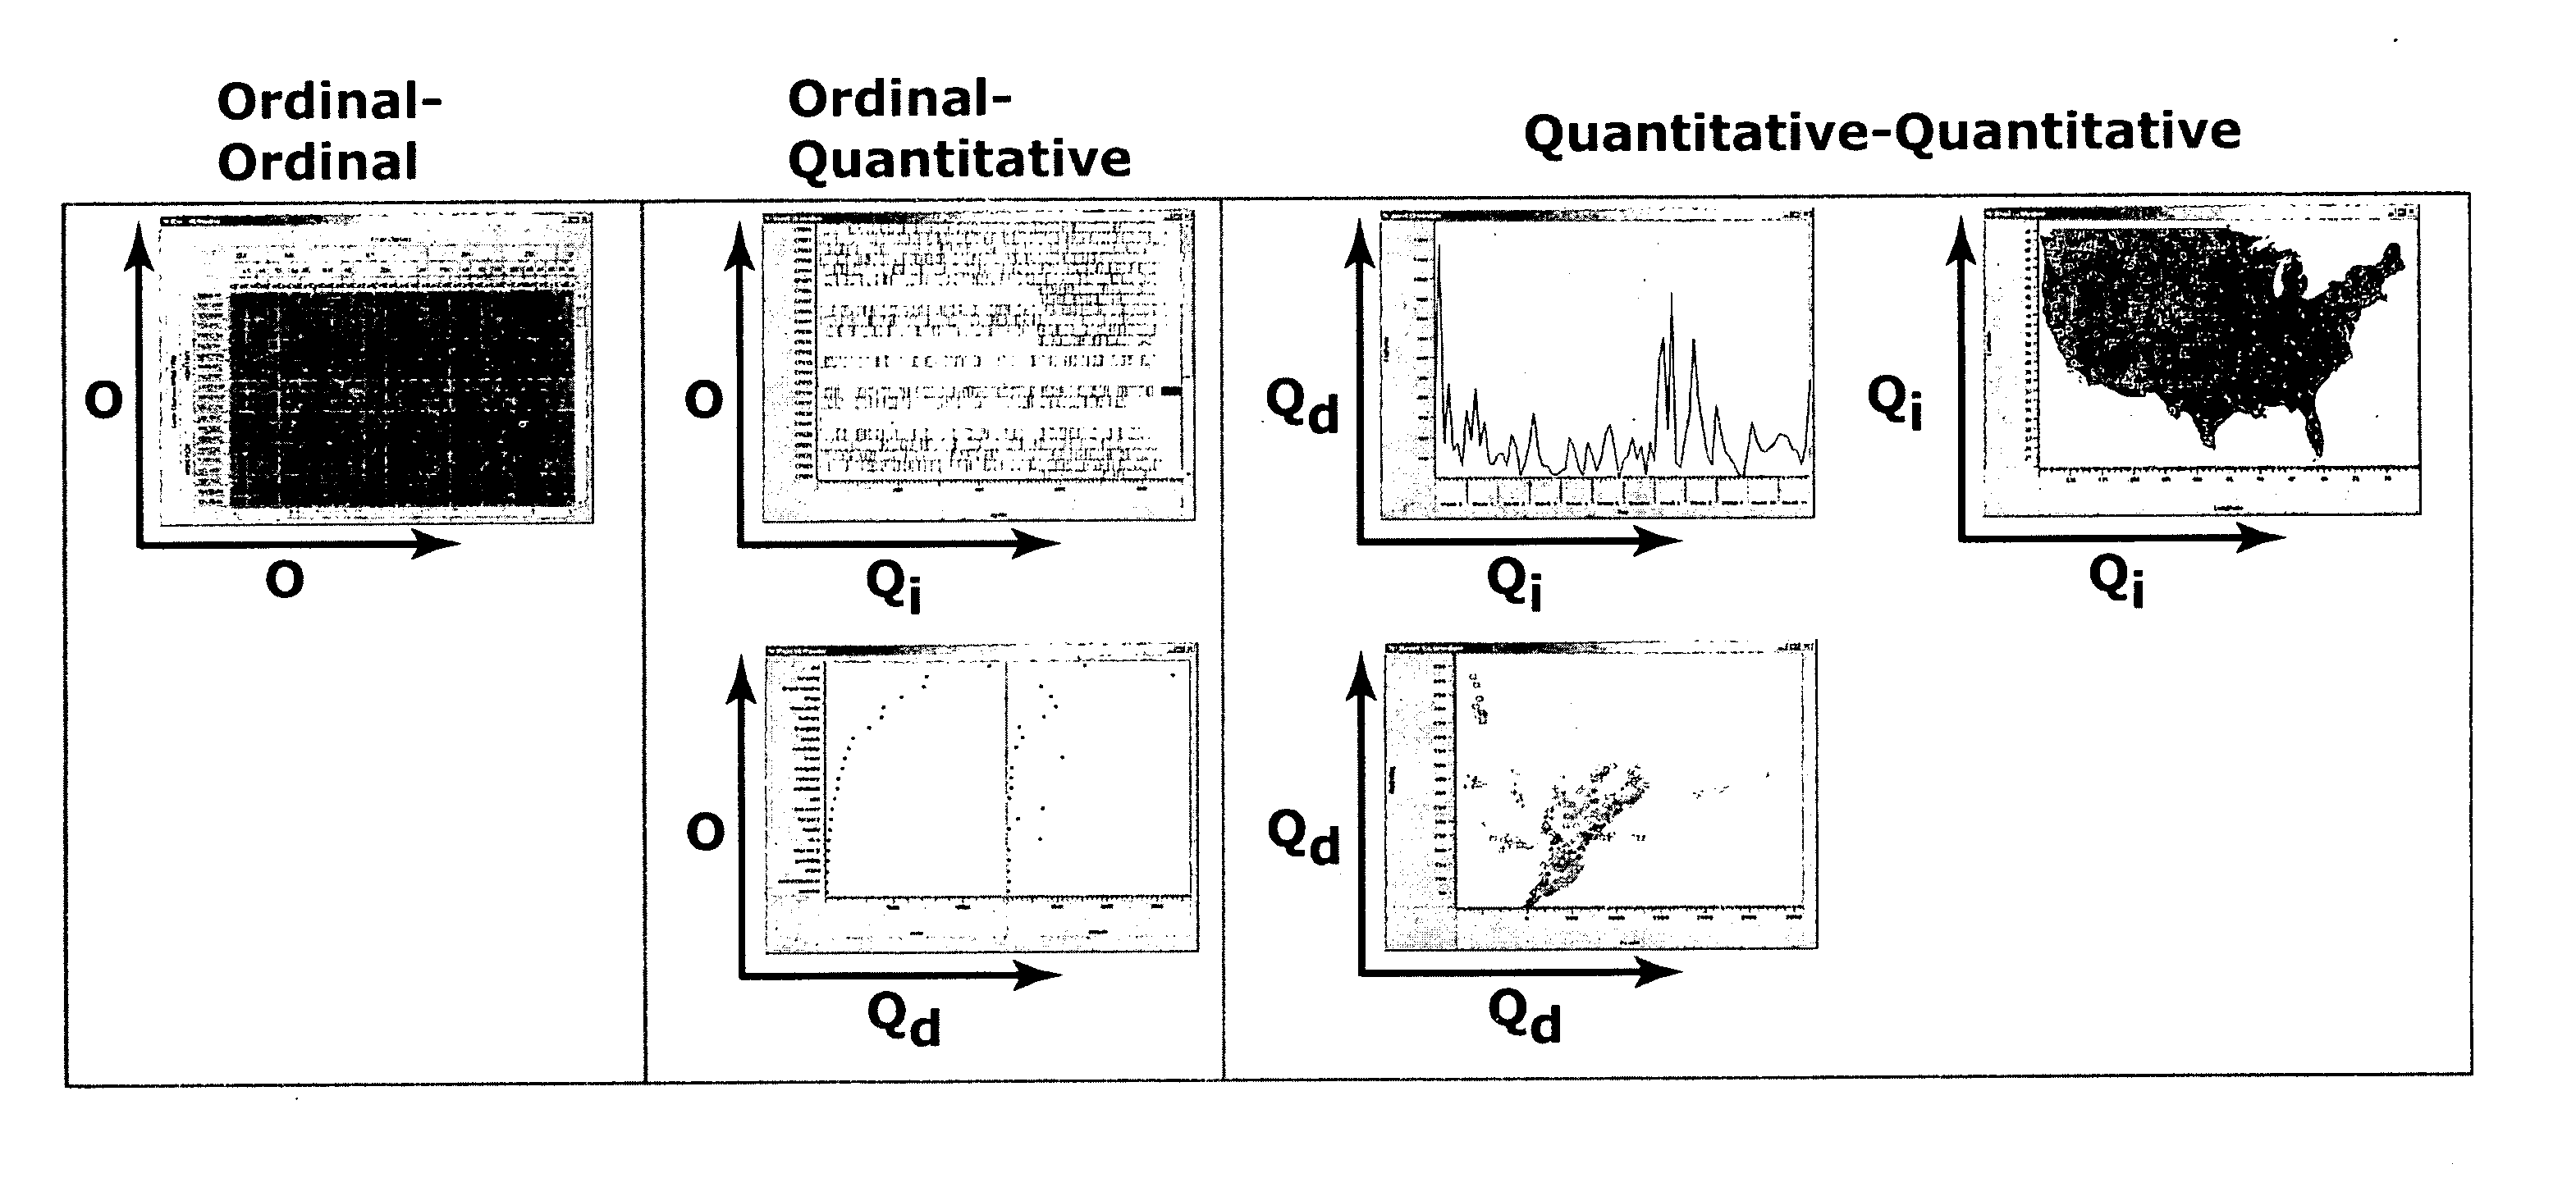
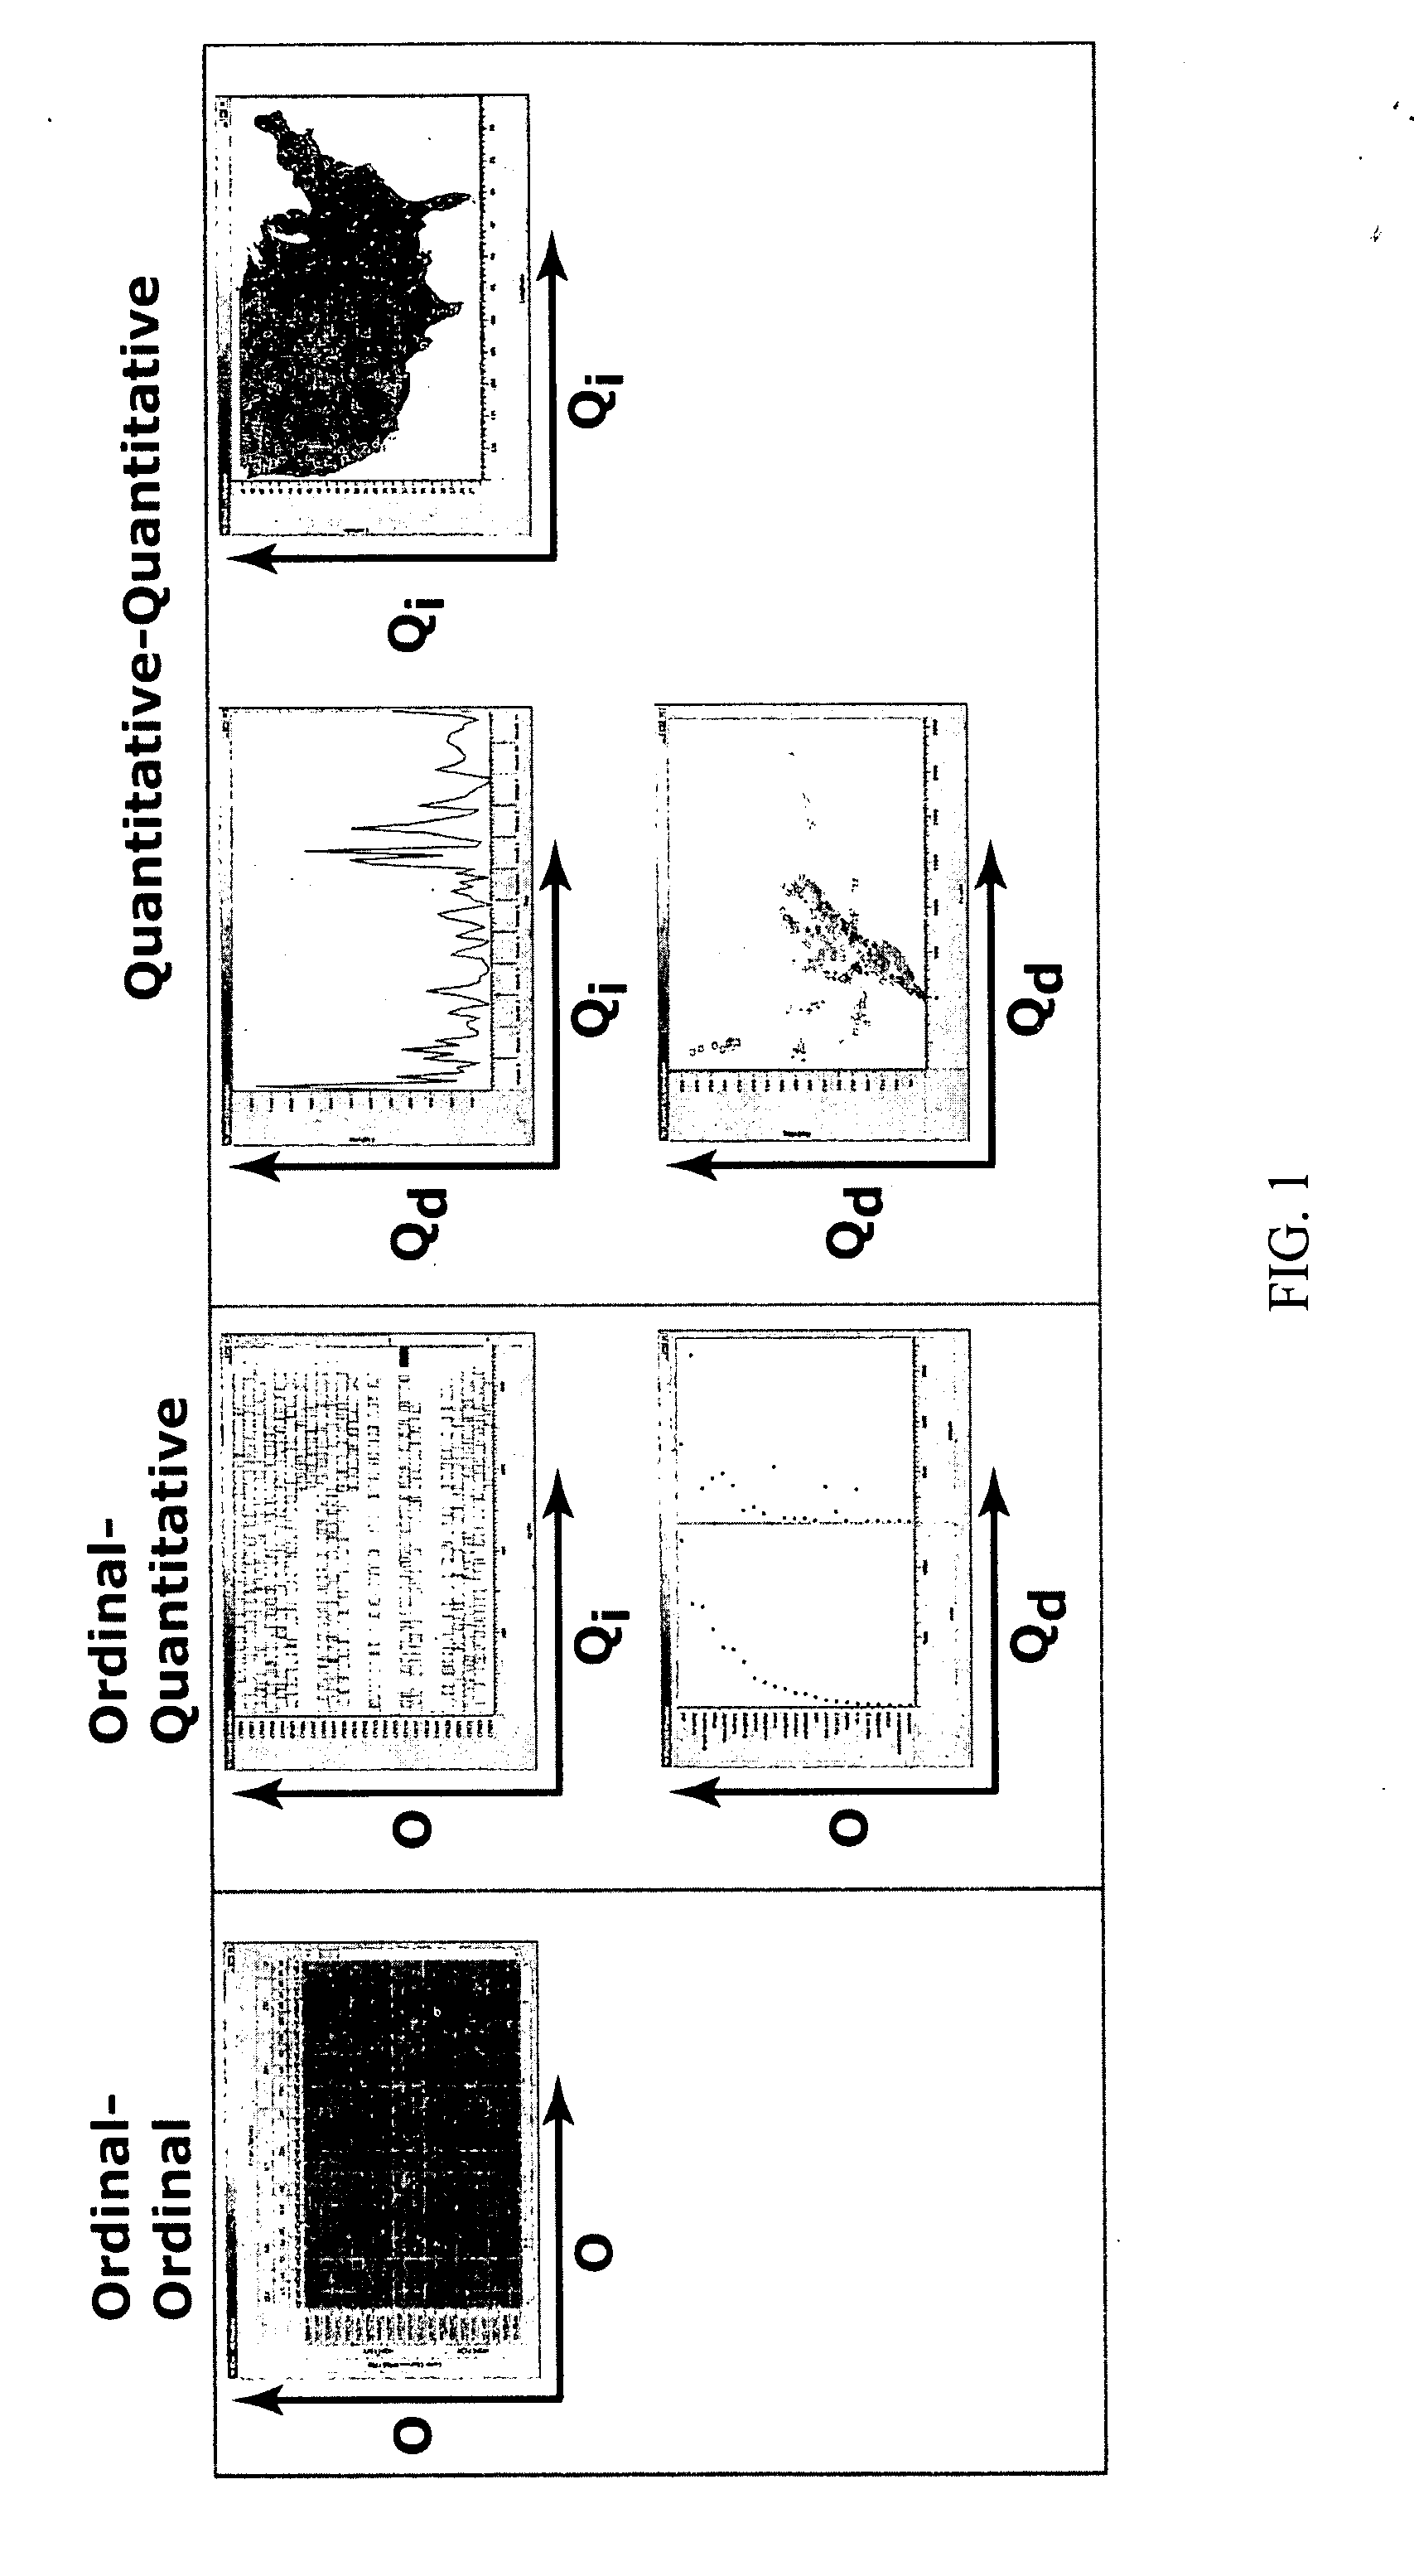
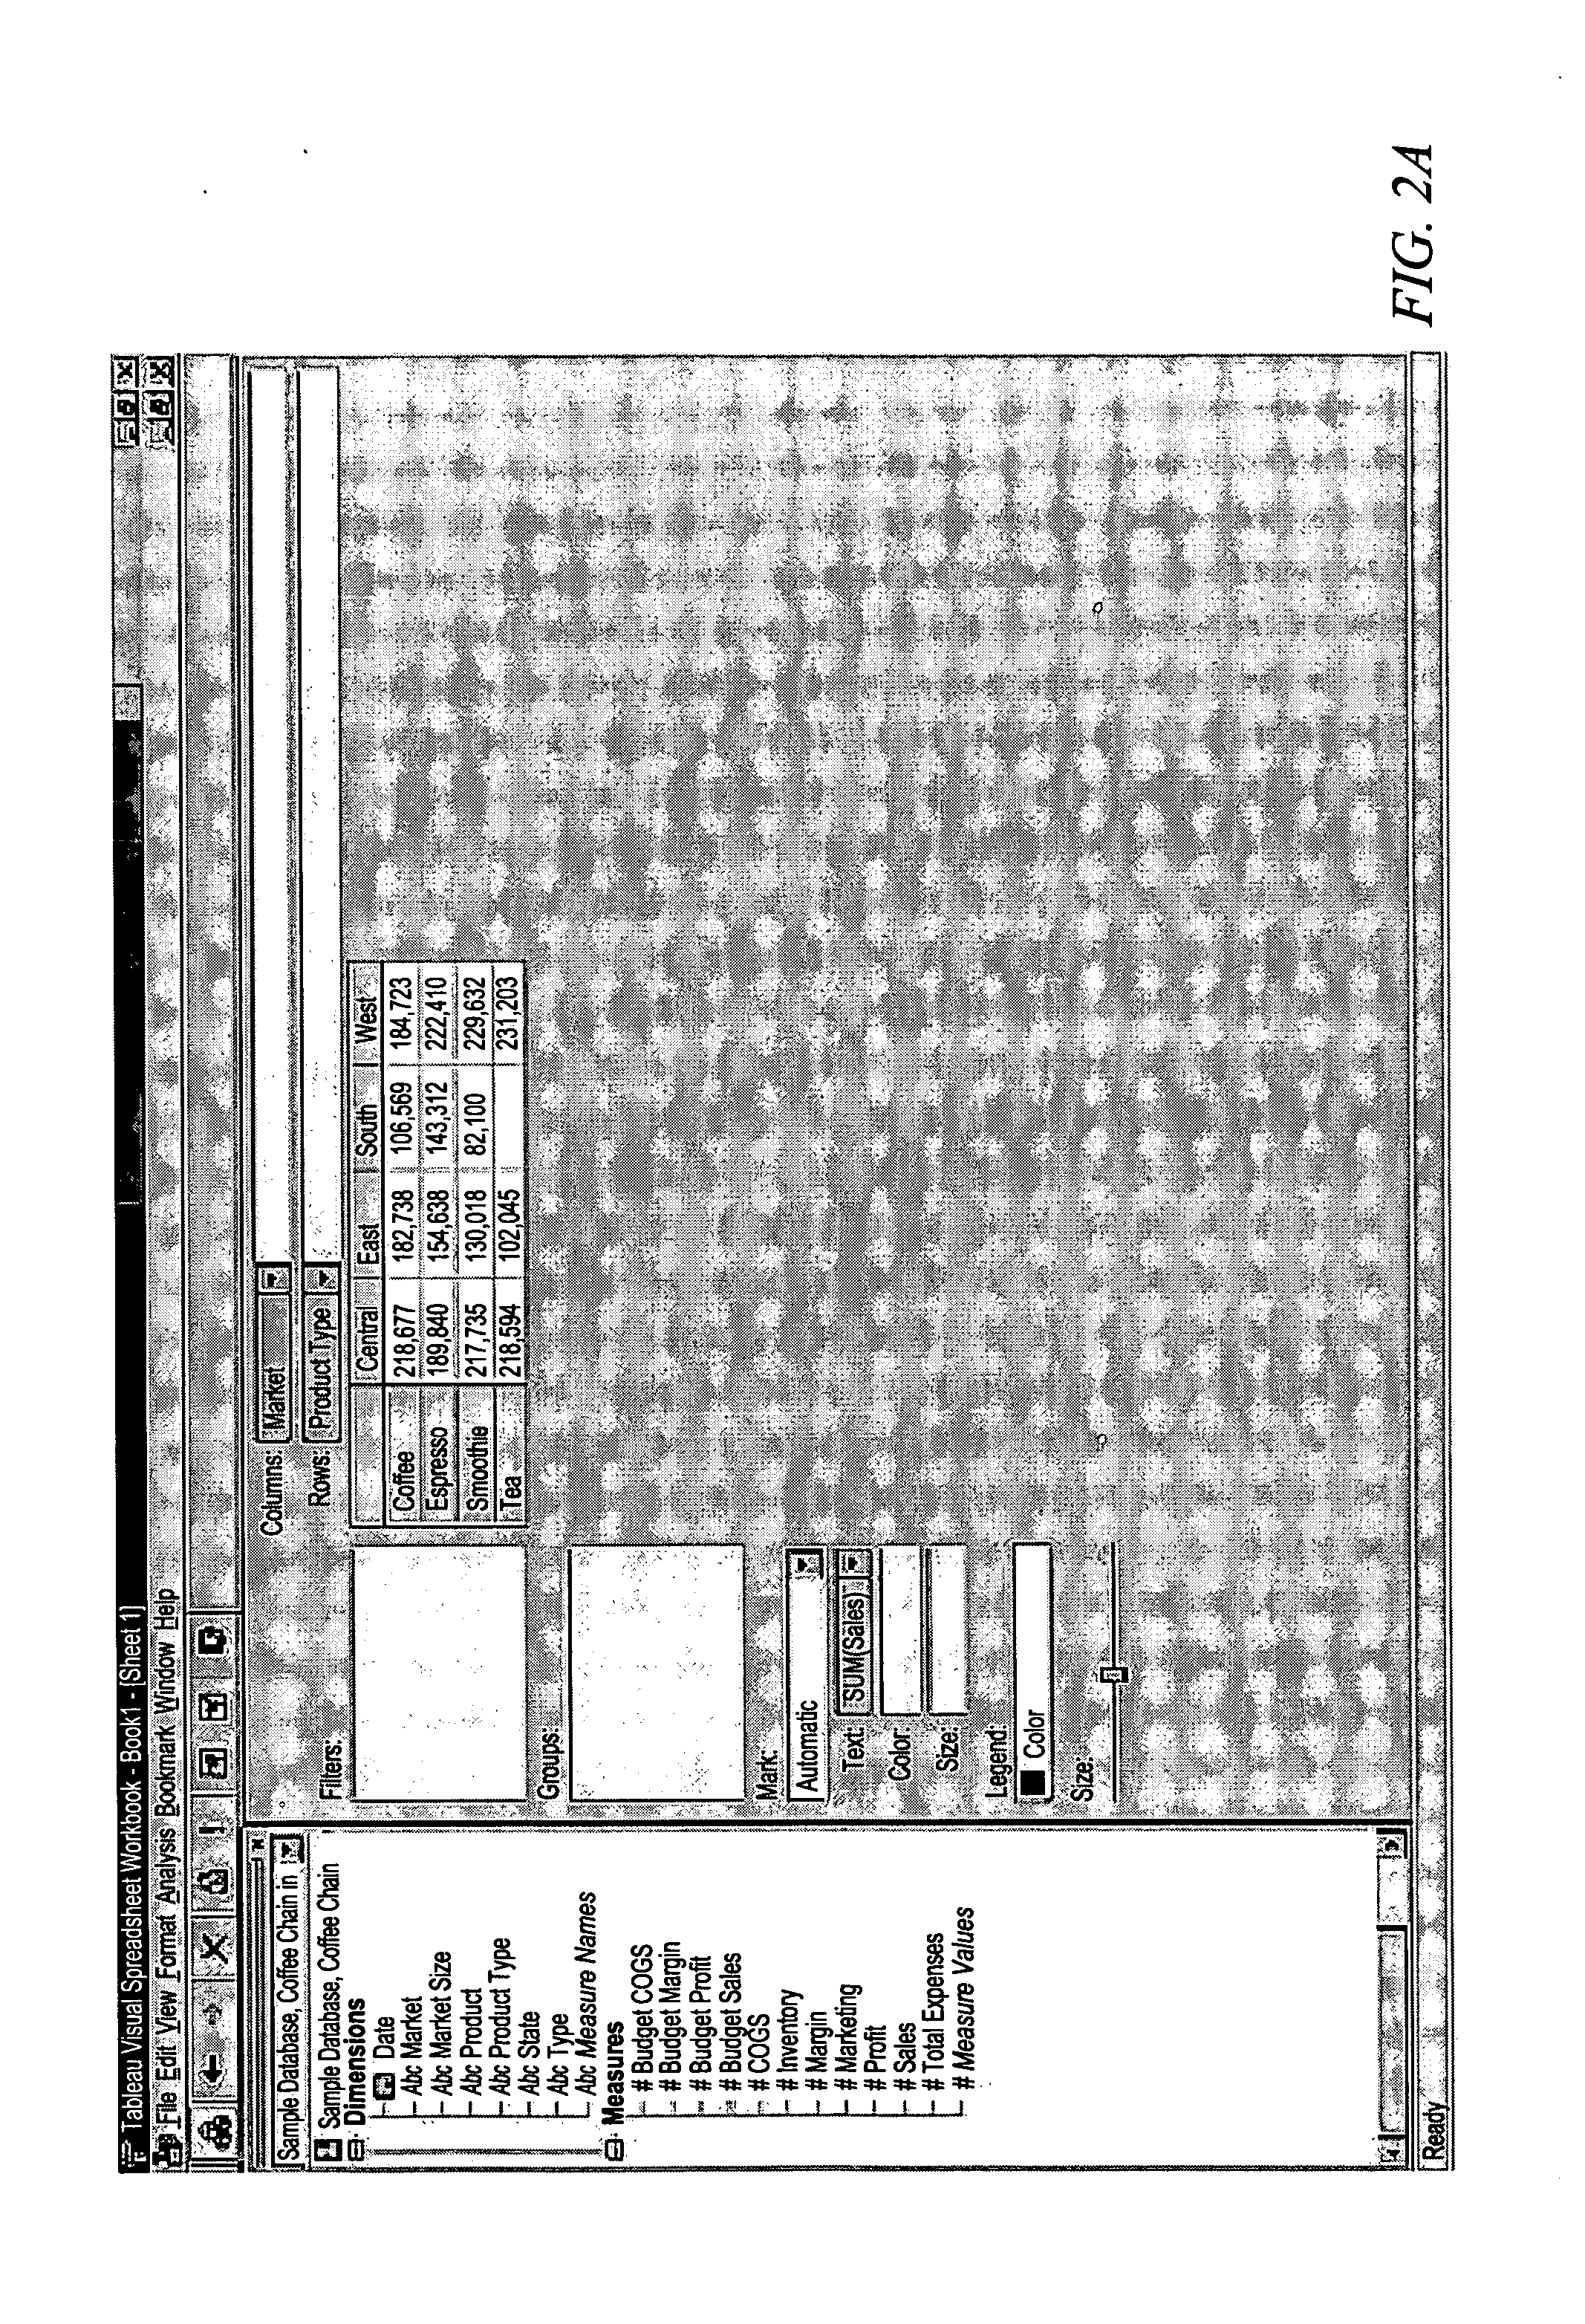
[0041] The present invention provides computer systems, computer program products, and methods for providing a user with a convenient visualization of data or information such as found in a database. In a typical embodiment of the present invention, a user specifies certain categories of data. Examples of such data, such as results of a search query, are displayed in a graphical form according to a scheme that is determined for the user by the methods of the present invention. An advantage of the present invention is that data can be illustrated in a large number of graphical manifestations.

Preliminary Definitions

[0042] The following terms are used herein.

[0043] A tuple is an item of data (such as a record) from a database, specified by two or more attributes from fields in the database. A search query across the database will return one or more tuples.

[0044] A table schema defines the columns comprising a tuple. The schema gives a name and a type for each column. Additional inf...


PUM


Abstract

A method for generating marks when displaying data, such as the results of a query across a database. The method is preferably used in conjunction with a dataset whose fields comprise a plurality of levels. A visual plot is constructed based on a specification. A first level from the plurality of levels is represented by a first component of the visual plot. A second level from the plurality of levels is represented by a second component of the visual plot. The dataset is optionally queried to retrieve data in accordance with the specification. The visual plot is populated with the retrieved data in accordance with the specification.

Description

FIELD OF THE INVENTION [0001] This invention relates generally to computer systems and methods for visualizing data such as database information. The invention relates specifically to a computer system and method for determining an appropriate mark based on types of data being visualized. BACKGROUND OF THE INVENTION [0002] The coming of the digital age was akin to the breaching of a dam: a torrent of information was unleashed and we are now awash in an ever-rising tide of data. Information, results, measurements and calculations—data, in general—are now in abundance and are readily accessible, in infinitely reusable digital form, on magnetic or optical media. The relentless increase in computing power fuels the promise of being able to efficiently analyze and display vast amounts of data more quickly and in ever more creative ways. Accordingly, the ever-present need to make meaningful sense of data is driving substantial research efforts in methods of statistical analysis, pattern r...

Claims


Application Information

Patent Timeline
Patent Type & Authority Applications(United States)
IPC IPC(8): G06F17/00
CPCG06F17/30554G06T11/206G06F16/248
Inventor HANRAHAN, PATRICKSTOLTE, CHRIS
Owner TABLEAU SOFTWARE INC
Why Eureka
Try Eureka