
Method and apparatus for determining the area or confluency of a sample

a technology of area or confluence and measurement method, which is applied in the field of measuring can solve the problems of difficult visualisation of living cells in culture, difficult to visualise viable cells, and difficult to measure the area or confluence of samples

Inactive Publication Date: 2006-11-16
IATIA IMAGING
View PDF3 Cites 62 Cited by
  • Summary
  • Abstract
  • Description
  • Claims
  • Application Information

AI Technical Summary

Benefits of technology

[0004] The object of the invention is to provide a method and apparatus for enabling the area or confluency of a sample to be determined, which does not destroy the sample, and which also avoids the above-mentioned problems of prior art optical techniques.
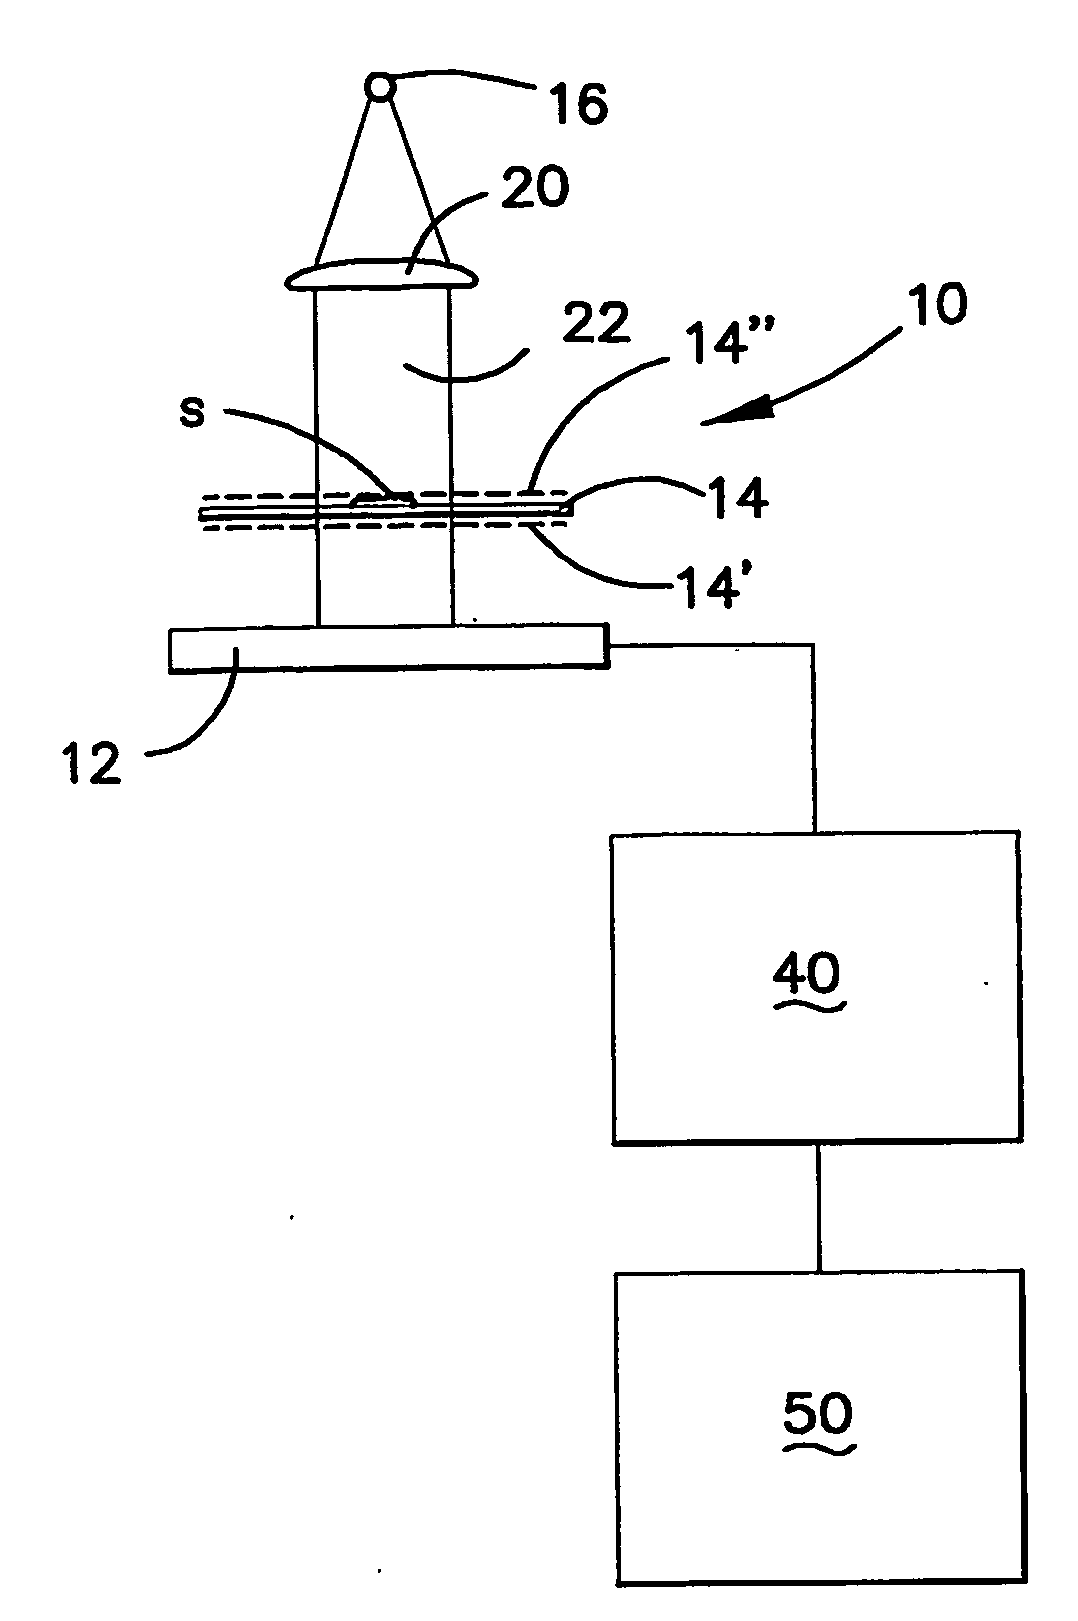
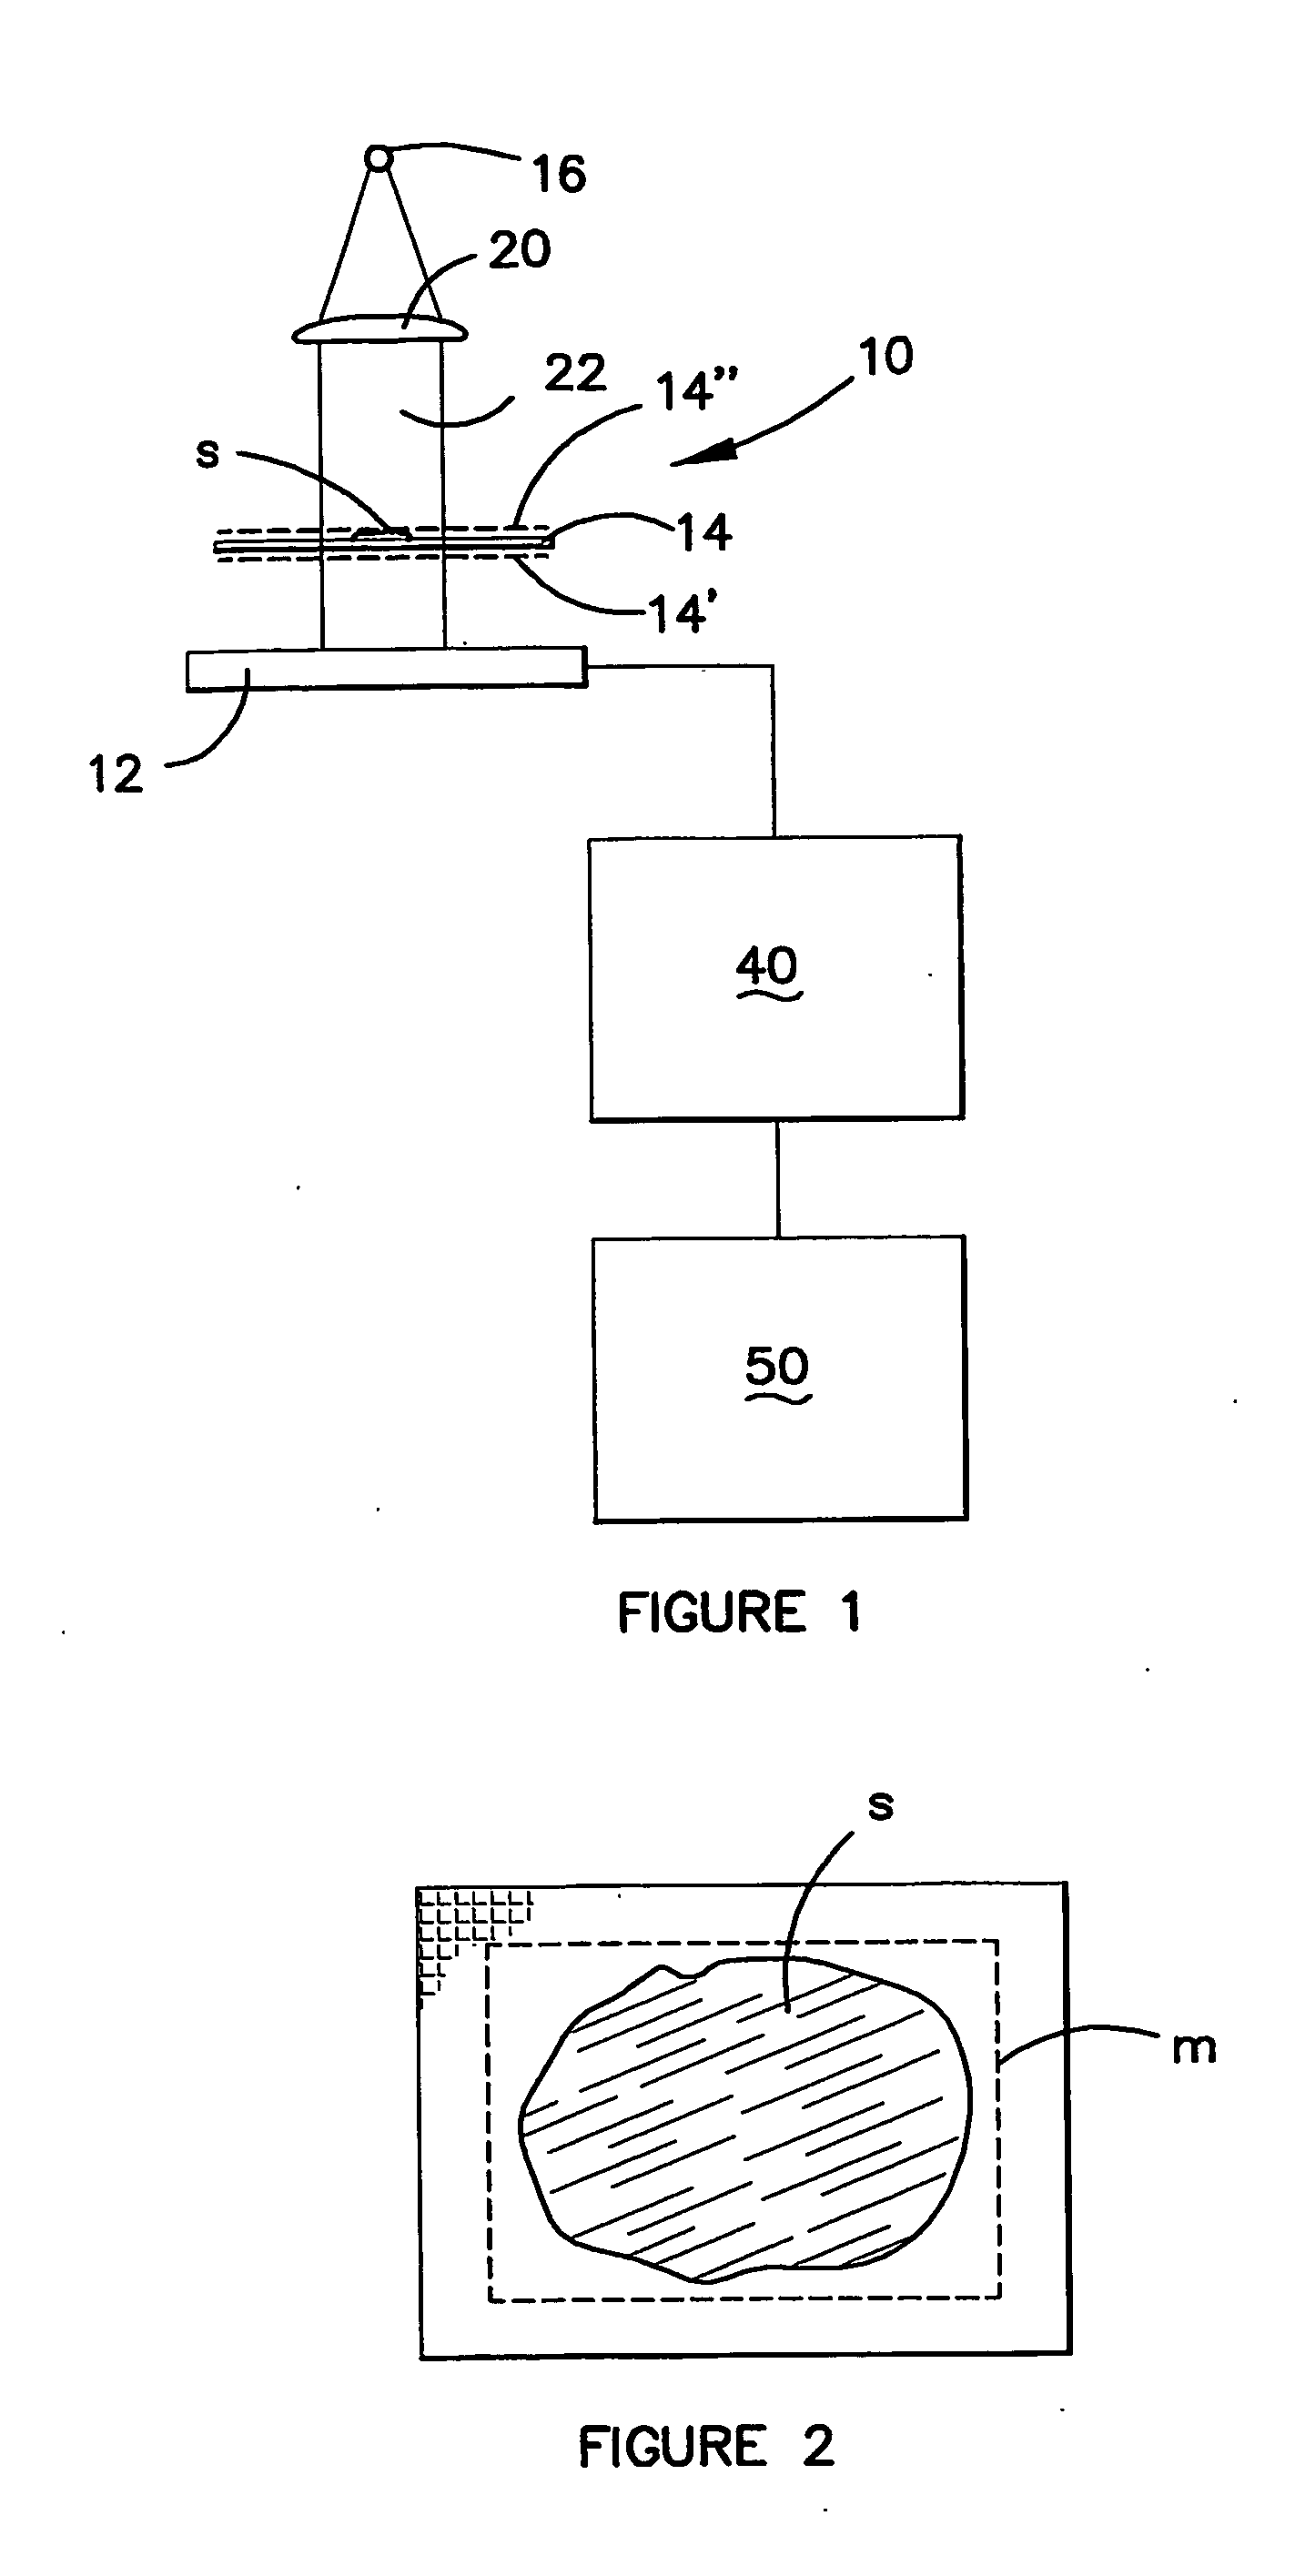
[0008] determining the area within the boundary in order to determine either the area of the sample or the confluency of the sample. Since quantitative phase data is used to obtain the area, the sample is not destroyed, as may be the case if staining is involved. Thus, growth patterns of the sample can be measured over a predetermined time period if desired by making subsequent measurements of the sample over the predetermined time period. Furthermore, the quantitative phase data avoids difficulties associated with cell edge distortion and generation of halos, and makes it much easier to identify the actual boundary of the sample, thereby providing the determination of the area or confluency of the sample.

Problems solved by technology

Considerable difficulty can be experienced in measuring the area or confluency of some samples and, in particular, transparent samples.
This is primarily due to the difficulty in determining where the boundary of the sample actually is so that the area or confluency of the sample can be measured.
Viable cells are transluscent objects that are difficult to visualise because there is usually little difference in contrast between cytoplasm and background.
Visualising living cells in culture is particularly difficult due to their transparent nature, and also because there are inherent problems associated with imaging through plastic culture ware.
This method results in destructive interference and allows the details of the image to appear dark against a light background.
Although each of these methods allows enhanced visualisation of transparent specimens, they all have inherent problems, including cell edge distortion and the generation of distinct halos at the edges of the cells, making visual analysis difficult.

Method used


Image

  • Method and apparatus for determining the area or confluency of a sample
  • Method and apparatus for determining the area or confluency of a sample
  • Method and apparatus for determining the area or confluency of a sample

Examples


example 1

[0077] Bright field images were captured using a black and white 1300×1030 pixel Coolsnap FX CCD camera (Roper Scientific) mounted on a Zeiss Axiovert 100M inverted microscope utilising a Zeiss Plan-Neofluar (×10, 0.30 NA) objective. To ensure optimal specimen illumination, Köhler illumination conditions were established for each optical arrangement (condenser and objective alignment and condenser stop at 70% field width). In order to calculate the phase map, one in-focus, and equidistant positive and negative de-focus images were acquired, using a defocus distance of zz μm in this instance. This was achieved using a piezoelectric positioning device (PiFoc, Physik Instrumente, Karlsruhe, Germany) for objective translation. Bright field images were subsequently processed to generate phase maps using QPm software (v2.0 IATIA Ltd, Australia). The phase map generation, based on the set of three bright field images captured, involved software-automated calculation of the rate of change o...


PUM


Abstract

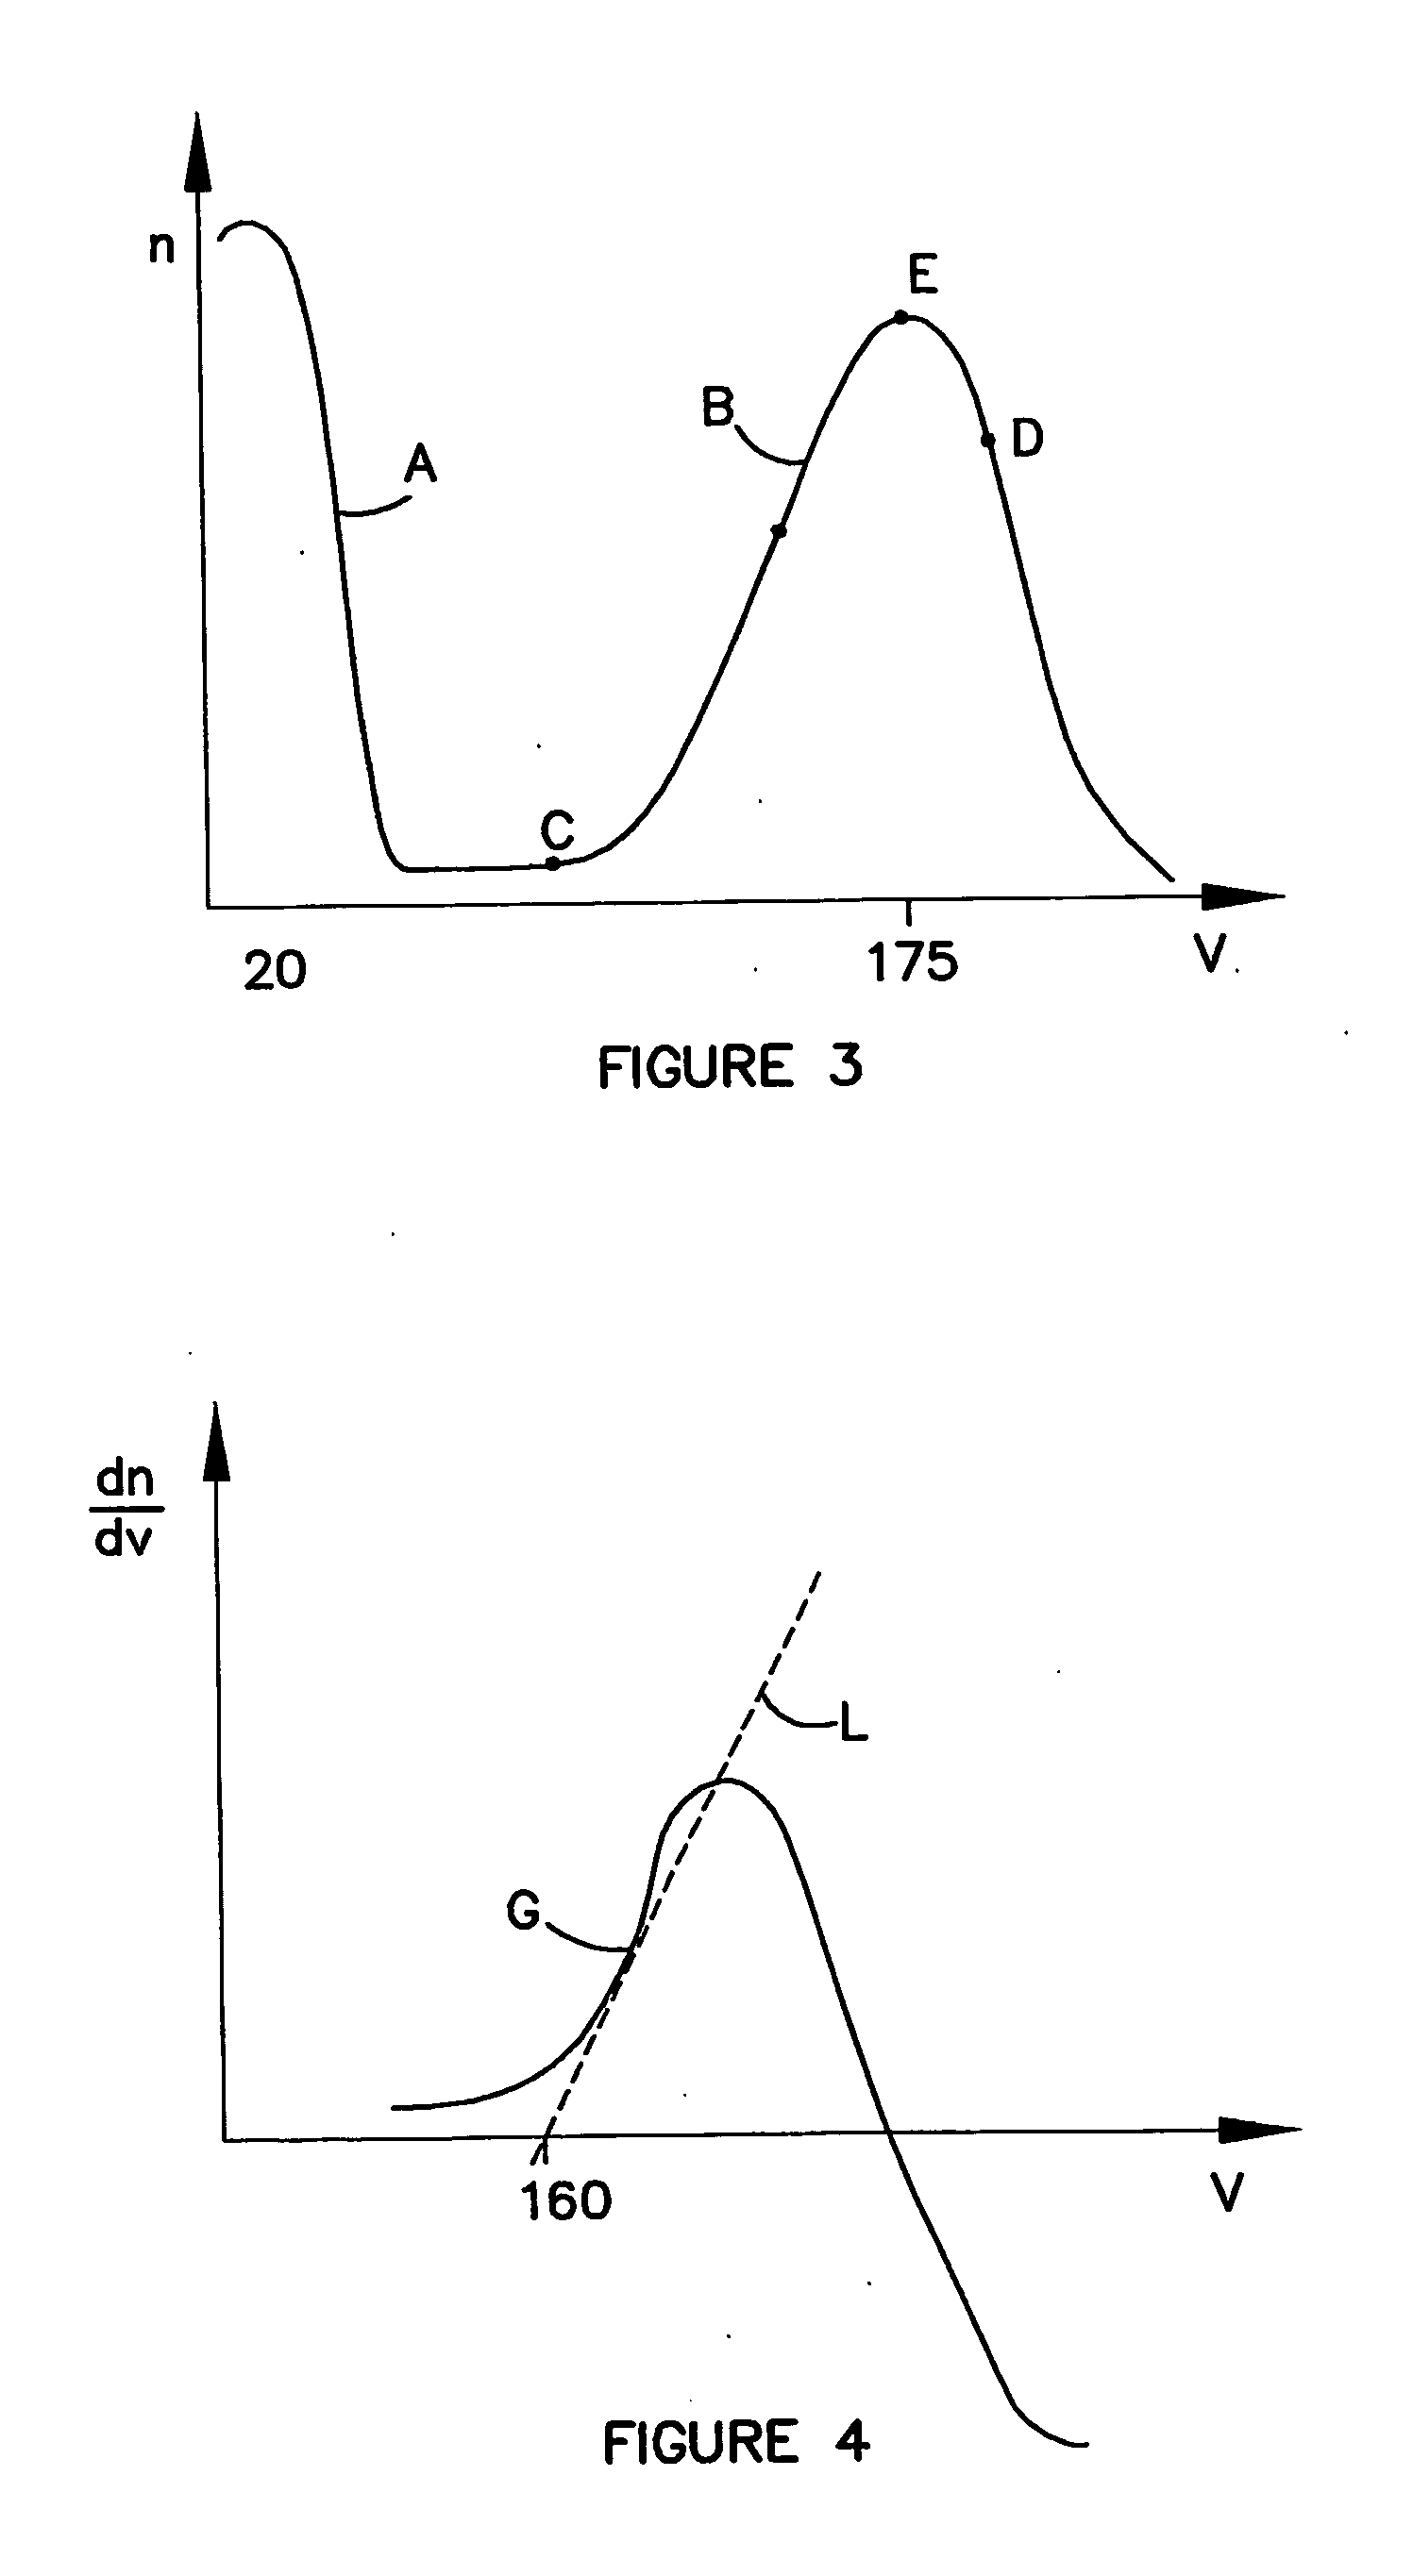
The area or confluency of a sample is determined by obtaining quantitative phase data relating to the sample and background surrounding the sample. The boundary of the sample is determined from the quantitative phase data by forming a histogram of phase data measurements and taking the derivative of the histogram to thereby determine the point of maximum slope. The line of best fit on the derivative is used to obtain a data value applicable to the boundary so that data values either above or below the determined data value are deemed within the sample.

Description

FIELD OF THE INVENTION [0001] This invention relates to a method and apparatus for determining the area or confluency of a sample. The invention has particular application to generally transparent samples such as cells to enable the area or confluency of cells to be determined so that effects of growth and confluency can be measured. However, it should be understood that the invention also has application to other sample types. BACKGROUND ART [0002] Considerable difficulty can be experienced in measuring the area or confluency of some samples and, in particular, transparent samples. This is primarily due to the difficulty in determining where the boundary of the sample actually is so that the area or confluency of the sample can be measured. Viable cells are transluscent objects that are difficult to visualise because there is usually little difference in contrast between cytoplasm and background. Cellular structures can be imaged and identified after staining or labelling, but this...

Claims


Application Information

Patent Timeline
IPC IPC(8): G01N1/10G06T5/00G06T7/60
CPCG06T7/0083G06T7/602Y10T436/2575G06T2207/30024G06T2207/10056G06T7/12G06T7/62G06V20/695
Inventor CURL, CLAIRE L.DELBRIDGE, LEA M. D.HARRIS, PETER J.BELLAIR, CATHERINE J.ALLMAN, BRENDAN E.
Owner IATIA IMAGING
Learn More