
Label integrity verification of chemical array data

Inactive Publication Date: 2007-05-17
AGILENT TECH INC
View PDF19 Cites 0 Cited by
  • Summary
  • Abstract
  • Description
  • Claims
  • Application Information

AI Technical Summary

Benefits of technology

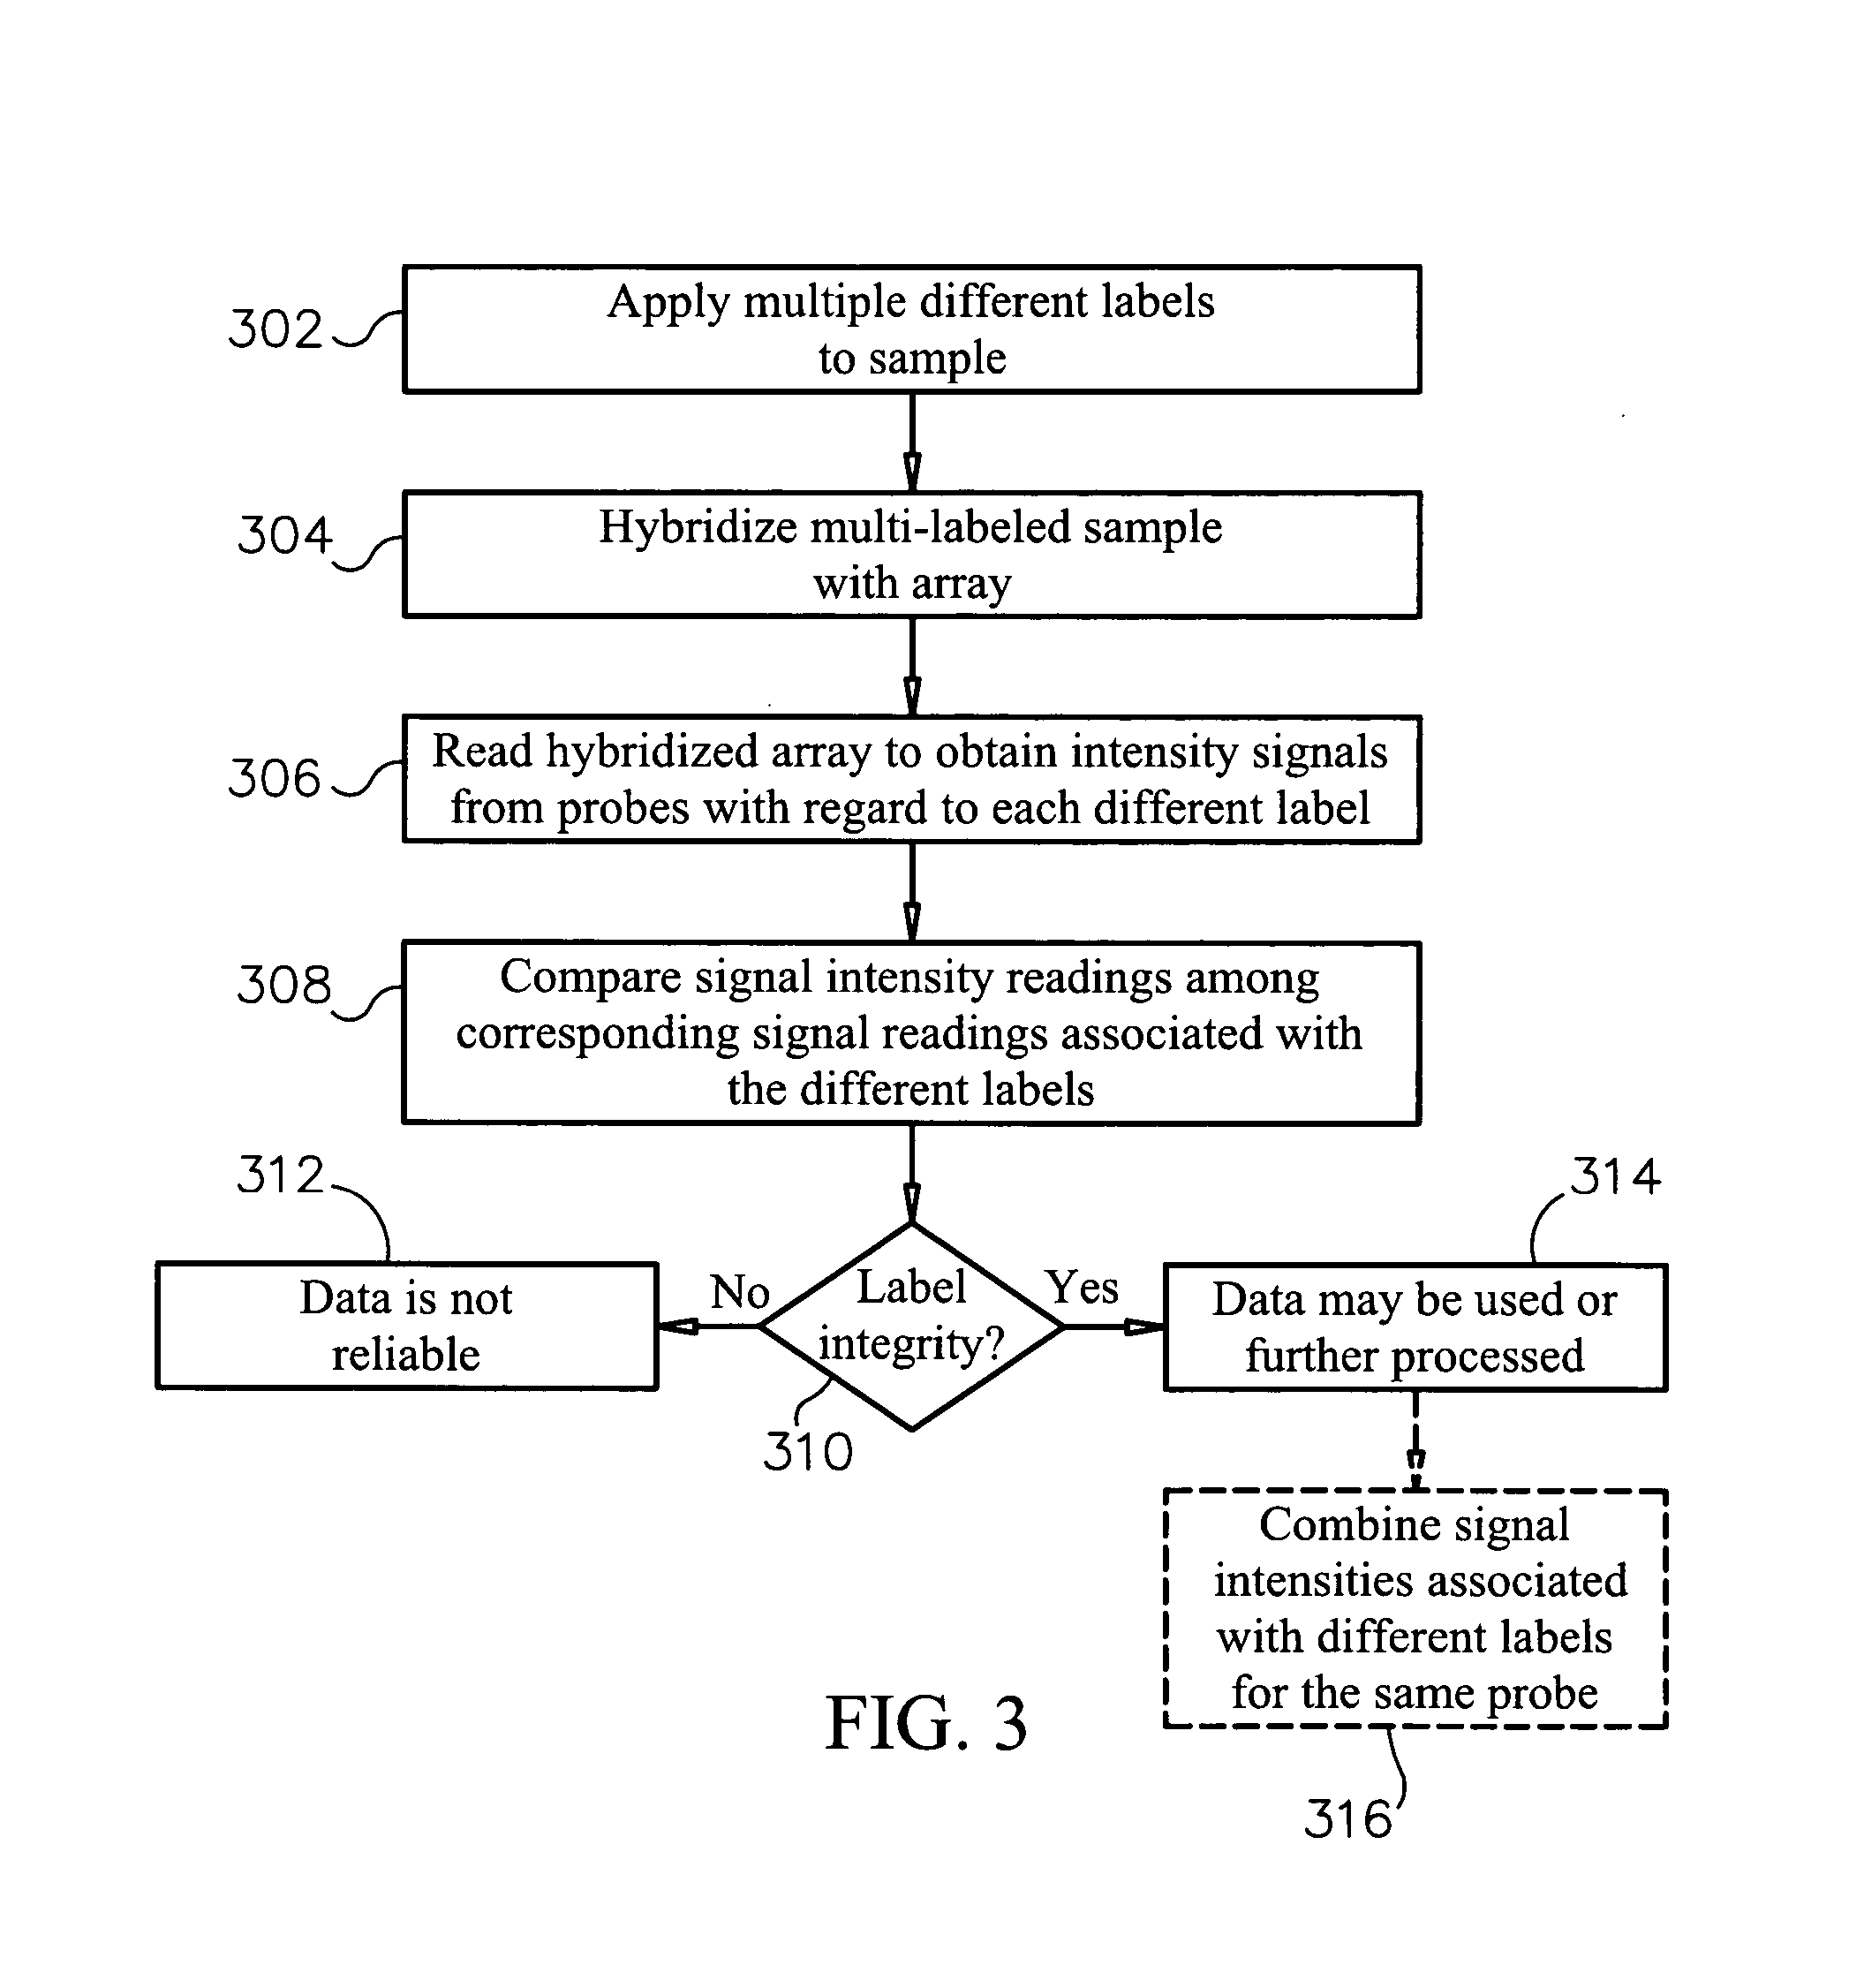
[0011] Methods, systems and computer readable media are provided for checking label integrity of labeled biopolymers in a sample assayed by chemical array analysis. A sample is divided into equal aliquots, and at least first and second labels are incorporated into biopolymers in first and second aliquots of the equal aliquots. The labels are added to the aliquots in amounts expected to incorporate into the biopolymers of the respective aliquots to produce signals of proportional value when read from probes on a chemical array designed to bind to biopolymers in the aliquots. The aliquots each having biopolymers with a distinguishable incorporated label (e.g., a spectrally distinguishable label) are then combined to provide a multi-labeled sample, and the multi-labeled sample is hybridized with probes on a chemical array. Signal values are read from the probes on the chemical array bound to labeled biopolymers from the multi-labeled sample. Signal values from probes bound to biopolymers having the first label incorporated therein (“first-labeled signal values”) are compared with signal values from the same probes bound to biopolymers having the second label incorporated therein (“second-labeled signal values”), respectively. Label integrity is determined to be of acceptable quality if divergence between the first-labeled signal values and the second-labeled signal values is less than a predetermined threshold value.
[0012] In another embodiment, a chemical array is provided

Problems solved by technology

However, the conversion of useful results from this raw data is restricted by physical limitations of, e.g., the nature of the tests and the testing equipment.
All biological measurement systems leave their fingerprint on the data they measure, distorting the content of the data, and thereby influencing the results of the desired analysis.
For example, systematic biases can distort array analysis results and thus conceal important biological effects sought by the researchers.
Biased data can cause a variety of analysis problems, including signal compression, aberrant graphs, and significant distortions in estimates of differential expression.
In dual-channel systems, it is well known that the two dyes used to evaluate the binding of target molecules to probes on an array do not always perform equally efficiently, for equivalent target concentrations, uniformly across the whole array.
Even when comparing results from two single-channel experiments, there may be differences in dye performances, even when the same dye is used, such as when different experimental conditions, either intended or unintended, occur when running each of the experiments.
Also, the label intensity may not follow an ideal performance curve over the range of analyte concentration.
The degree the intensity of dye signals fail to report the concentration of target being measured is not easily quantified, and therefore difficult to address.
However, this is a time consuming process and significantly increases the cost of experimentation, as twice the amount of arrays, reagents, target and processing are required.
In addition to fluorescent labels, other types of labels, such as radioactive labels, phosphorescent labels, visible light labels, ultraviolet labels, and others, are also susceptible to causing signal correlation bias.
Also, results that appear to have labeling bias may be due to other technical errors.
For example, for a single channel system, the system may be erroneously reporting probe signals, even though the results appear to be the cause of dye bias.
Since there is only one channel, and no control channel, it is not possible to distinguish between the systematic reader error and dye bias, in this instance.

Method used


Image

  • Label integrity verification of chemical array data
  • Label integrity verification of chemical array data
  • Label integrity verification of chemical array data

Examples


Embodiment Construction

[0023] Before the present systems, methods, kits and computer readable media are described, it is to be understood that this invention is not limited to particular methods, method steps, algorithms, software or hardware described, as such may, of course, vary. It is also to be understood that the terminology used herein is for the purpose of describing particular embodiments only, and is not intended to be limiting, since the scope of the present invention will be limited only by the appended claims.

[0024] Where a range of values is provided, it is understood that each intervening value, to the tenth of the unit of the lower limit unless the context clearly dictates otherwise, between the upper and lower limits of that range is also specifically disclosed. Each smaller range between any stated value or intervening value in a stated range and any other stated or intervening value in that stated range is encompassed within the invention. The upper and lower limits of these smaller ra...


PUM

PropertyMeasurementUnit
Fractionaaaaaaaaaa
Fractionaaaaaaaaaa
Fractionaaaaaaaaaa

Abstract

Methods, systems and computer readable media for checking label integrity of labeled biopolymers in a sample assayed by chemical array analysis. A sample is divided into equal aliquots. At least first and second labels are incorporated into biopolymers contained in first and second aliquots of the equal aliquots, respectively. The labels are added to the aliquots in amounts expected to incorporate into the biopolymers of the respective aliquots to produce signals of proportional quantity when read from probes on a chemical array designed to couple with biopolymers of the aliquots. The aliquots are then combined into a single, multi-labeled sample having at least first-labeled biopolymers and second-labeled biopolymers. The multi-labeled sample is hybridized with probes on a chemical array. Signal values are read from the probes on the chemical array bound to labeled biopolymers from the multi-labeled sample. Comparisons are made between signal values from probes bound to biopolymer having the first label incorporated therein (first-labeled signal values) and signal values from the same probes bound to biopolymers having the second label incorporated therein (second-labeled signal values), respectively, from which it is determined that label integrity is of acceptable quality if divergence between the first-labeled signal values and the second-labeled signal values is less than a predetermined threshold value.

Description

BACKGROUND OF THE INVENTION [0001] Researchers use experimental data obtained from arrays and other similar research test equipment to cure diseases, develop medical treatments, understand biological phenomena, and perform other tasks relating to the analysis of such data. However, the conversion of useful results from this raw data is restricted by physical limitations of, e.g., the nature of the tests and the testing equipment. [0002] All biological measurement systems leave their fingerprint on the data they measure, distorting the content of the data, and thereby influencing the results of the desired analysis. For example, systematic biases can distort array analysis results and thus conceal important biological effects sought by the researchers. Biased data can cause a variety of analysis problems, including signal compression, aberrant graphs, and significant distortions in estimates of differential expression. [0003] Gradient effects or patterns are those in which there is a...

Claims


Application Information

Patent Timeline
IPC IPC(8): C12Q1/68G06F19/00
CPCG01N33/582
Inventor MINOR, JAMES M.
Owner AGILENT TECH INC
Learn More