Method and apparatus for automatically characterizing a malignancy

a malignancy and automatic characterization technology, applied in the field of medical imaging, can solve the problems of inability to quantitatively determine, clinicians may not know how to quantitatively determine, and the calculation involved in quantifying and assessing the significance of a signal change is too laborious to manually perform on a regular basis

Inactive Publication Date: 2007-07-19
GENERAL ELECTRIC CO
View PDF7 Cites 30 Cited by
  • Summary
  • Abstract
  • Description
  • Claims
  • Application Information

AI Technical Summary

Problems solved by technology

While the availability and analysis of both functional and structural image data (such as PET and CT images) provides diagnostic opportunities, several challenges to such techniques still exist.
However, the presentation of subtle disease state presentations, in either PET or CT image data, may be problematic.
For example, a clinician may not know how to quantitatively determine whether a slight increase in a PET signal is due to a benign process or to a malignant process.
Proper interpretation of this data typically requires a thorough understanding of the physics processes and image formation techniques involved, which may not be information available to or known by the average practicing clinician.
Furthermore, even if this information were known by the clinician, the calculations involved to quantify and assess the significance of a signal change would be too laborious to manually perform on a regular basis.
Furthermore, few clinicians have the knowledge or experience to fully understand and interpret the combined PET and CT data.
Furthermore, synergies exist in the combined PET and CT image data such that the combined data may contain critical information that is not obvious or apparent in the uncombined image data.
Apprehension of this synergistic information may not be possible by a clinician trained with respect to only one of the image modalities or inexperienced in the evaluation of such combined image data sets.

Method used


Image

  • Method and apparatus for automatically characterizing a malignancy
  • Method and apparatus for automatically characterizing a malignancy
  • Method and apparatus for automatically characterizing a malignancy

Examples


Embodiment Construction

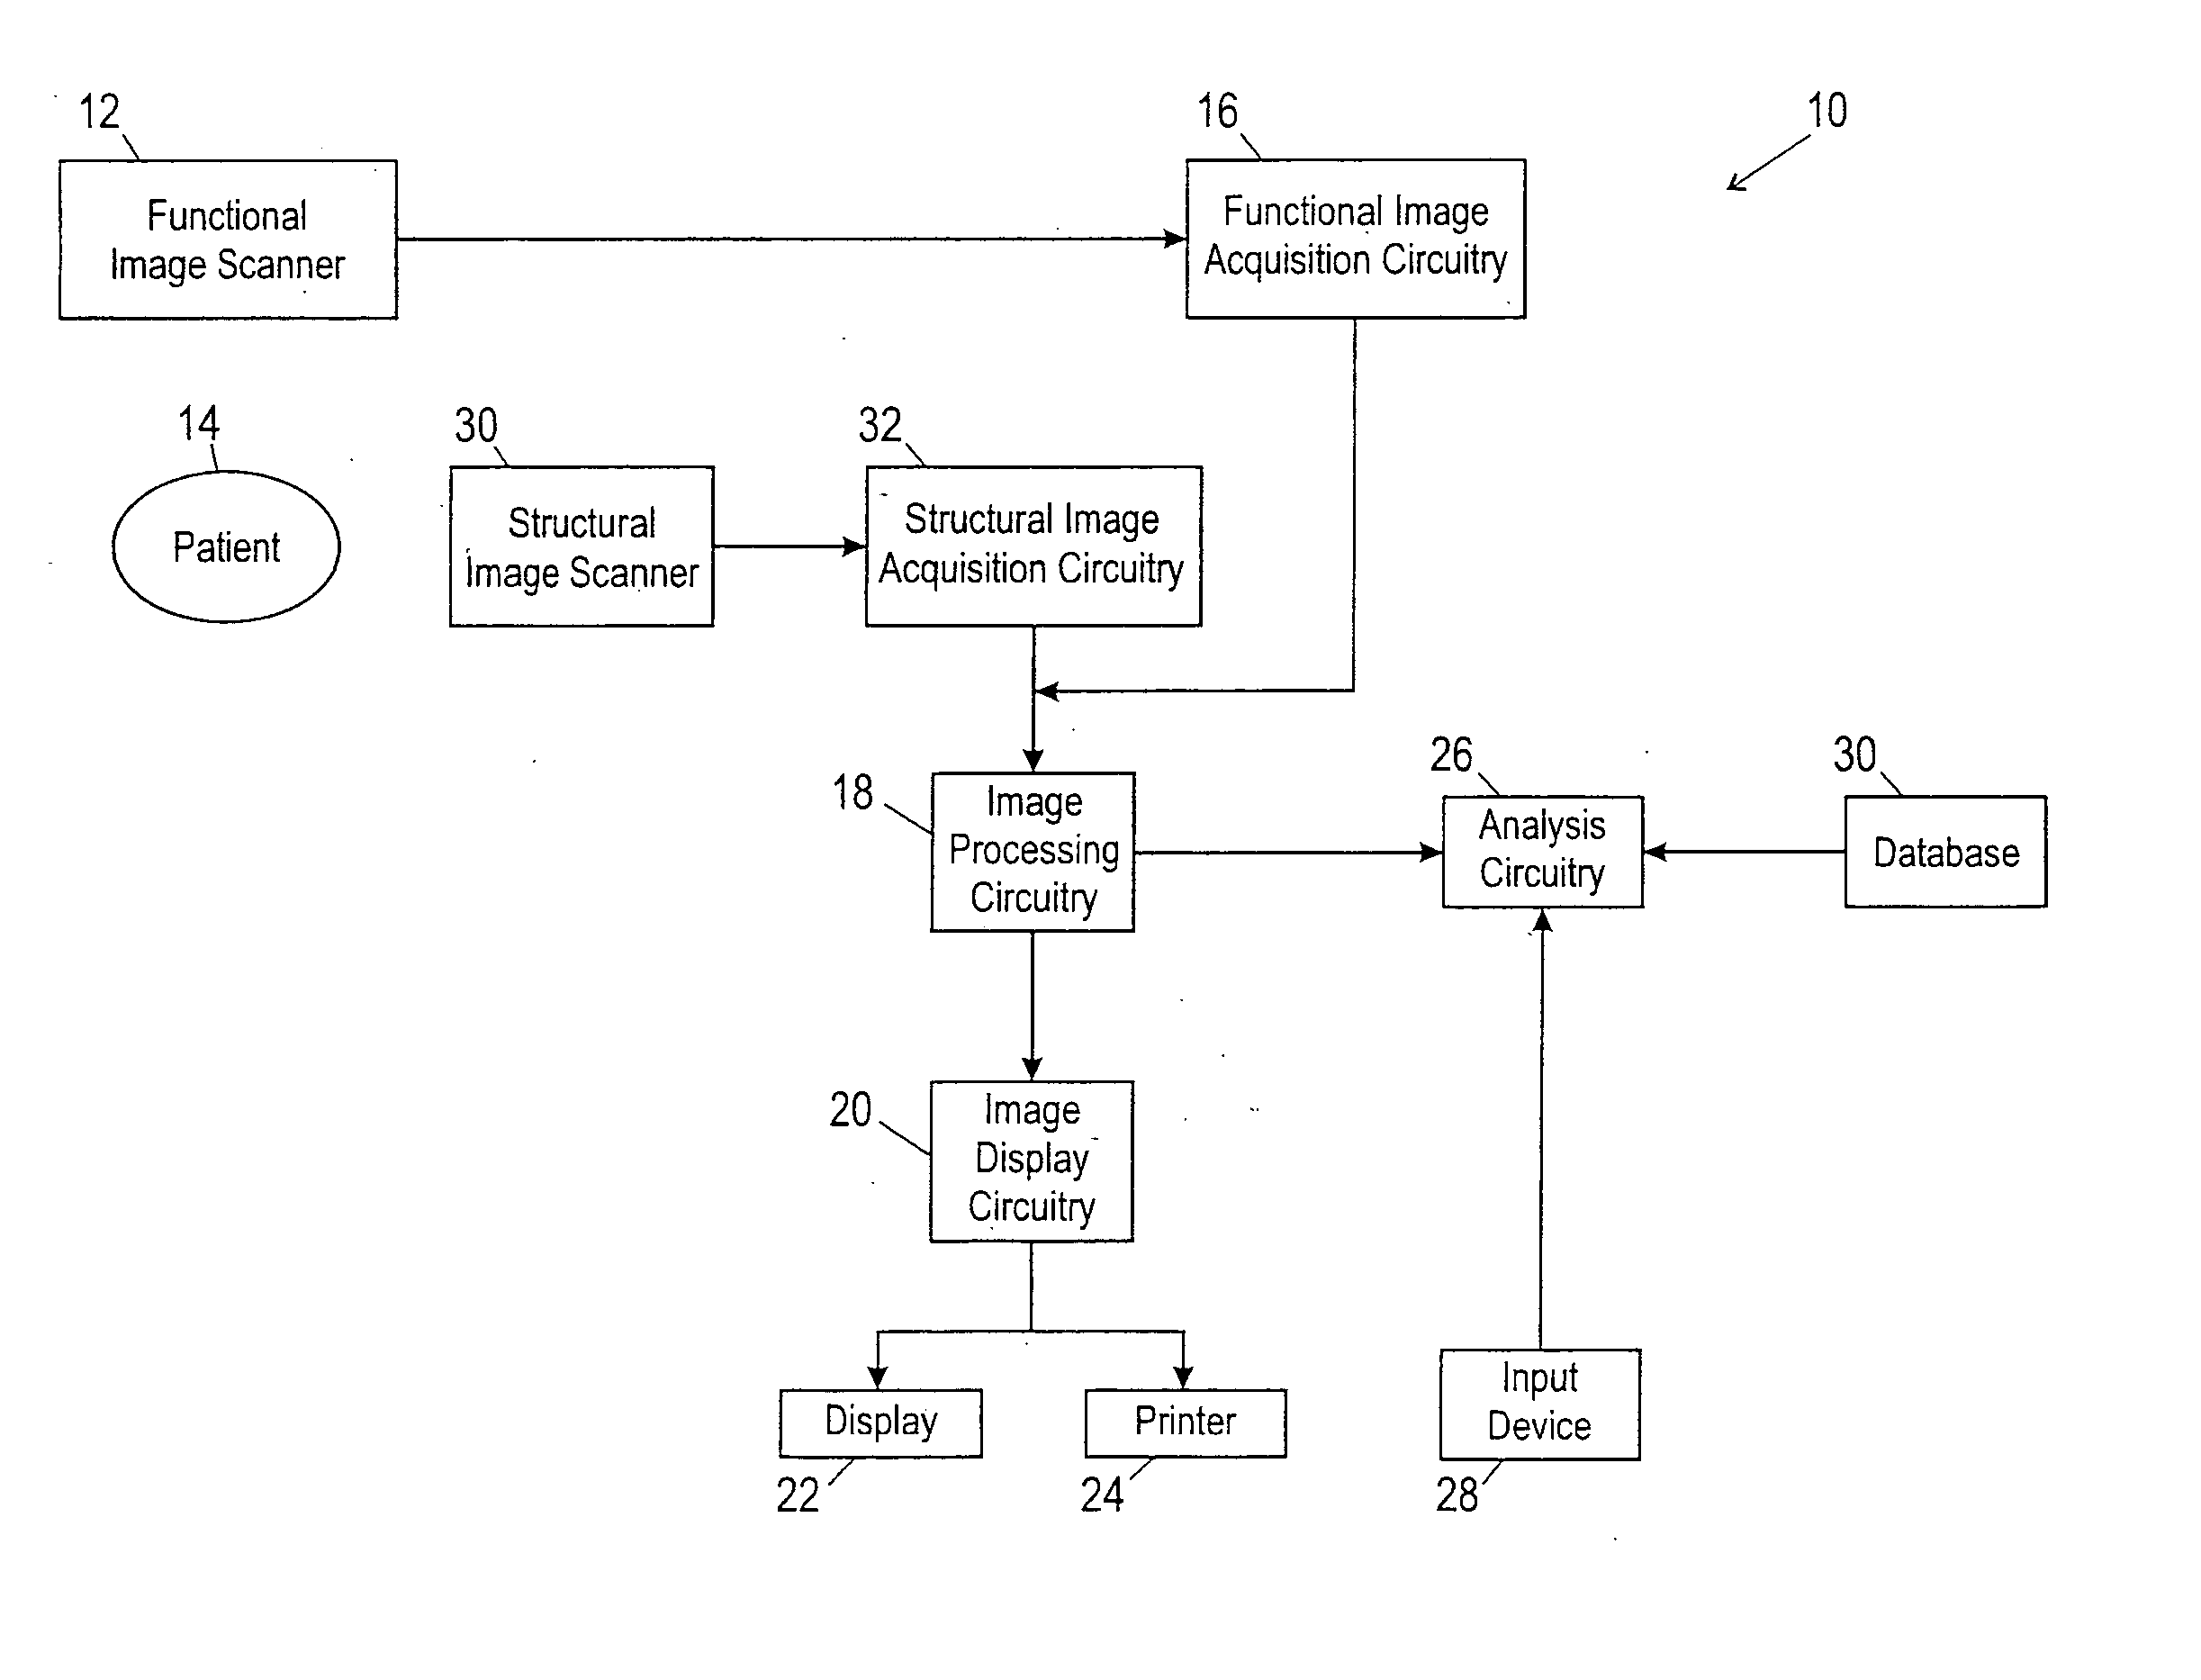
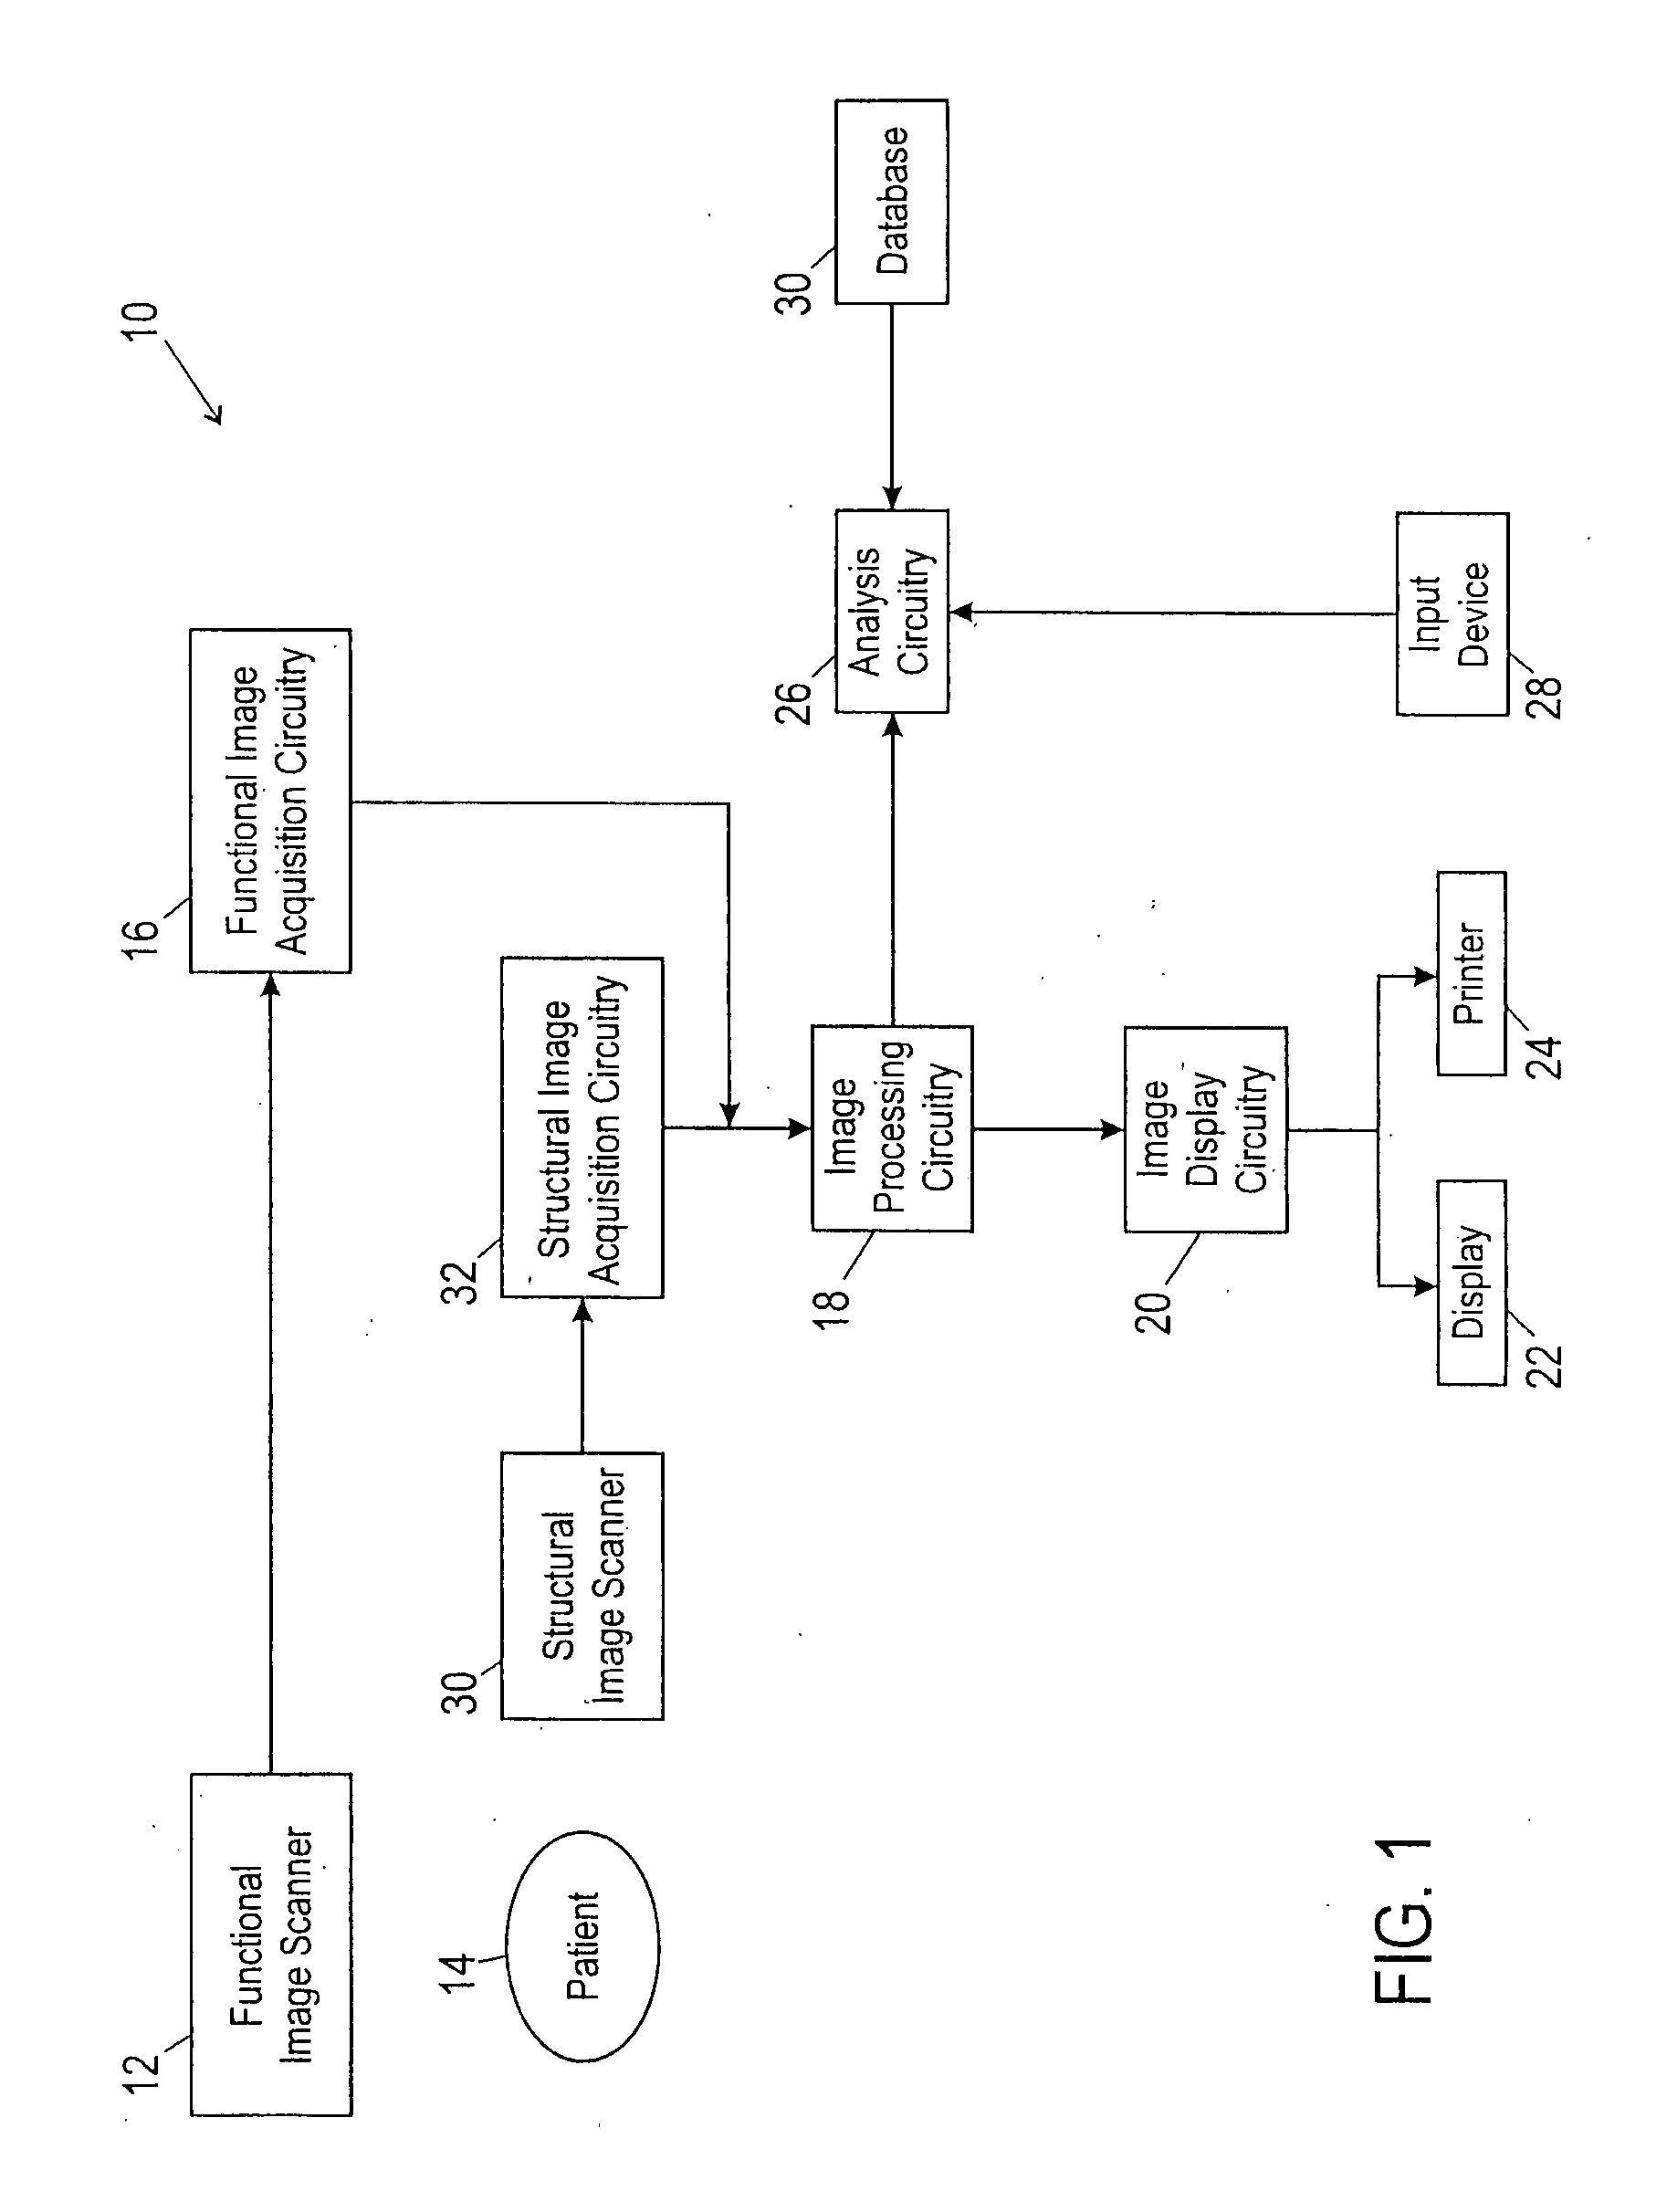
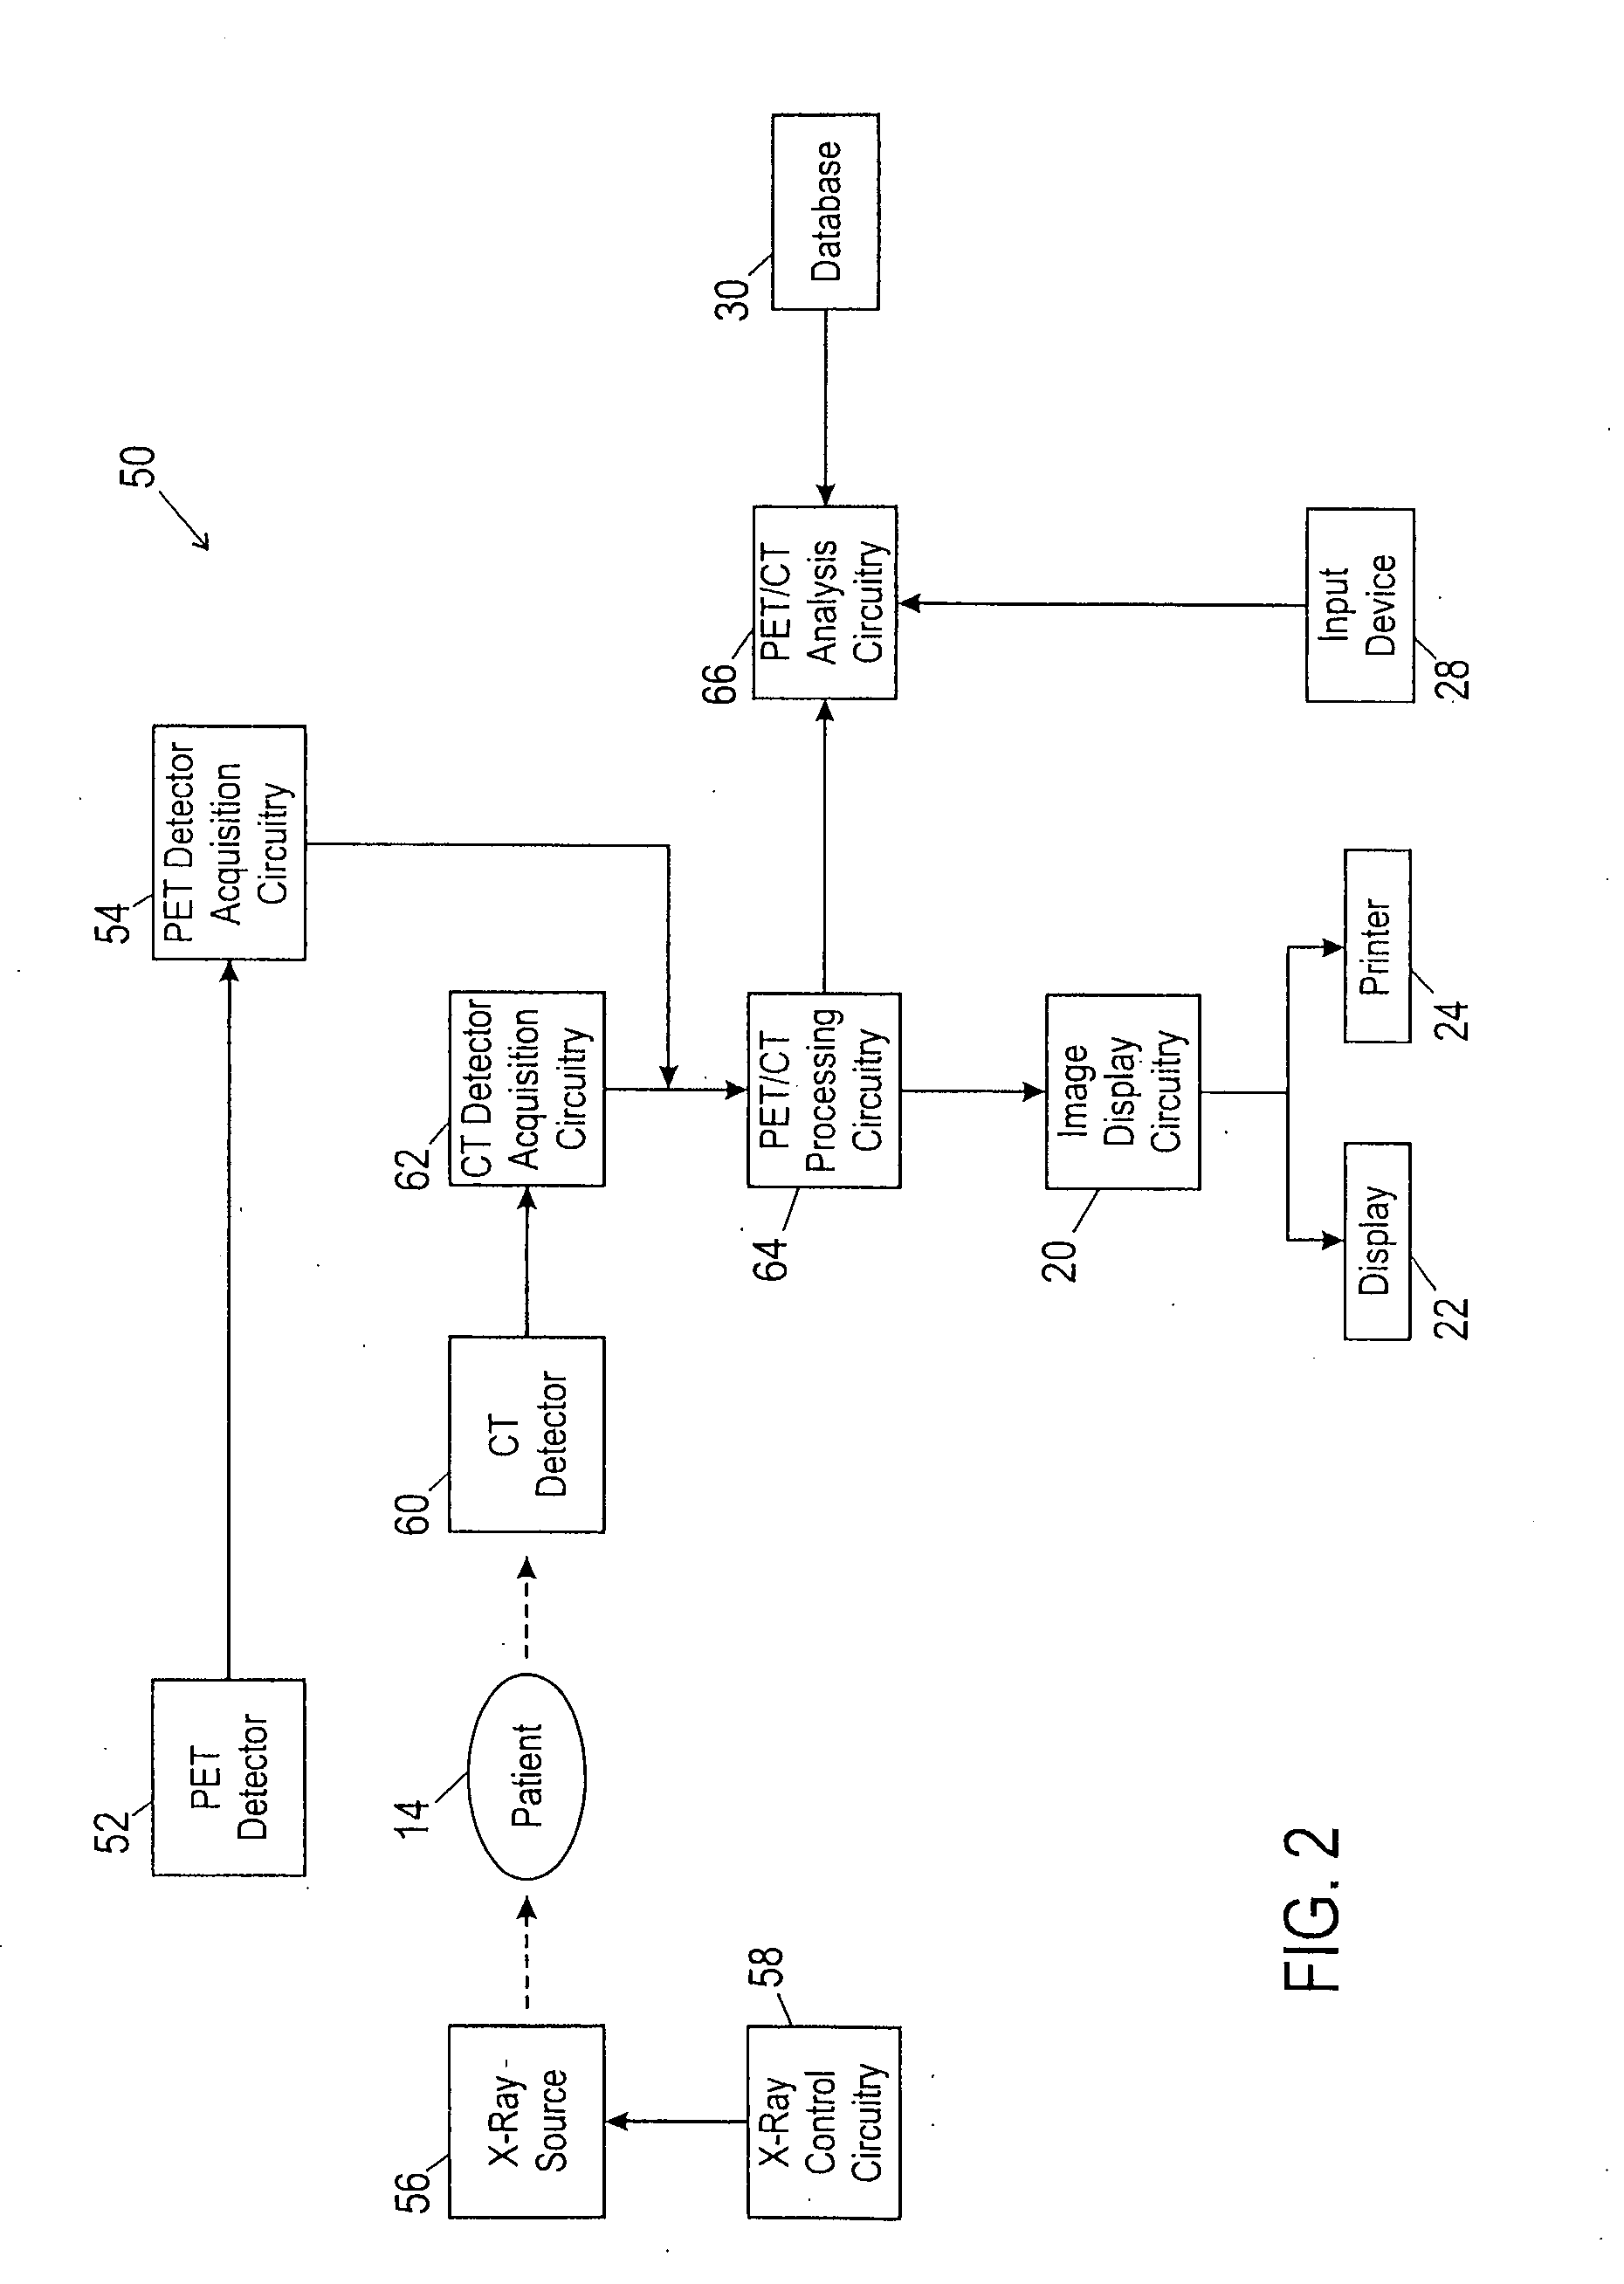
[0014] The present invention provides for the automatic or semi-automatic assessment of cancerous or potentially cancerous tissues using multiple sets of image data, such as a set of functional image data and a set of structural image data. The respective sets of image data may be concurrently acquired such as using a positron emission tomography / computed tomography (PET / CT) system, or may be acquired serially using combined or separate imaging systems. The automated analysis routines employed allow for a quantitative analysis of malignancy characteristics of identified regions of interest within the functional and / or structural image data sets. These regions of interest may be identified in an automatic fashion. In this manner accurate, quantifiable results may be obtained to assist a clinician in the evaluation of a patient.

[0015] In FIG. 1, an exemplary image analysis system 10 for use in accordance with the present technique is provided. For simplicity, the image analysis syste...


PUM


Abstract

A malignancy probability is automatically calculated for one or more lesions. The malignancy probability is based on assessments of one or more malignancy characteristics for each lesion derived from two or more structural and / or functional image data sets. Likewise, in some embodiments, the malignancy probability is based on assessments of one or more malignancy characteristics for each lesion derived from a combination of structural and functional image data. In one embodiment, the set of structural image data is a set of CT image data and the set of functional image data is a set of PET image data. The one or more lesions may be detected in the structural and / or functional image data by automated routines or by a visual inspection by a clinician or other reviewer.

Description

BACKGROUND OF THE INVENTION [0001] The present invention relates generally to the field of medical imaging and more specifically to the evaluation of features of interest in image data acquired using different imaging modalities. In particular, the present invention relates to the evaluation of malignancies observable in computed tomography (CT) and positron emission tomography (PET) image data. [0002] Non-invasive imaging broadly encompasses techniques for generating images of the internal structures or regions of a person that are otherwise inaccessible for visual inspection. One of the best known uses of non-invasive imaging is in the medical arts where these techniques are used to generate images of organs and / or bones inside a patient which would otherwise not be visible. One class of medical non-invasive imaging techniques is based on the generation of structural images of internal structures which depict the physical arrangement, composition, or properties of the imaged regio...

Claims


Application Information

Patent Timeline
Patent Type & Authority Applications(United States)
IPC IPC(8): A61B5/05
CPCA61B19/50G01R33/4808G01R33/481A61B6/037G01R33/4814G01T1/1611G01R33/4812A61B34/10
Inventor AVILA, RICARDOJANSEN, FLORIBERTUS HEUKENSFELDTTROTTER, DINKO GONZALEZMILLER, JAMESMANJESHWAR, RAVINDRASEBASTIAN, THOMAS
Owner GENERAL ELECTRIC CO
Why Eureka
Try Eureka