Regional Benchmarking System

a benchmarking system and benchmarking technology, applied in the field of regional benchmarking system, can solve the problems of limited information scope, mainly limited to manufacturing costs and sales data for specific companies, and use aggregation algorithms, etc., and achieve the effect of easy interpretation and meaningful, easy analysis and interpretation, and more time for analysis and interpretation

Inactive Publication Date: 2007-08-02
GASTER ROBIN
View PDF13 Cites 2 Cited by
  • Summary
  • Abstract
  • Description
  • Claims
  • Application Information

AI Technical Summary

Benefits of technology

[0027] It is the object of the present invention to allow a user to access a large number of data sets within the framework of a comparison with other similar geographical regions, and to provide hierarchically organized summaries which present information at the specific level of detail required by the user, ranging from a single page summarizing all 200 data sets and comparisons, to the data contained in a single data set. The present invention is a way to present information in a color-coded manner so that it is intelligible, useful, easy to interpret and meaningful, as opposed to providing numbers which take more time to analyze and interpret. Therefore, it will not suffice to simply use an Excel spreadsheet since the information needs to be presented in non-numerical format to be easily interpreted. The only time the statistics in numbers are presented is at the lowest level of comparison. It also presents successive levels of data, and the further a user goes with the different categories of data there is a hierarchy of summaries.

Problems solved by technology

This database differs in that it is intended for collecting market research information and advertising and is limited in scope in the kind of information it collects and provides.
Nor does it employ an aggregation algorithm for creating color-coded summary level indicators.
It is also mainly limited to manufacturing costs and sales data for specific companies.
It does not suffice to simply use an Excel spreadsheet since the information needs to be presented in non-numerical format to be easily interpreted.

Method used


Image

  • Regional Benchmarking System
  • Regional Benchmarking System
  • Regional Benchmarking System

Examples


Embodiment Construction

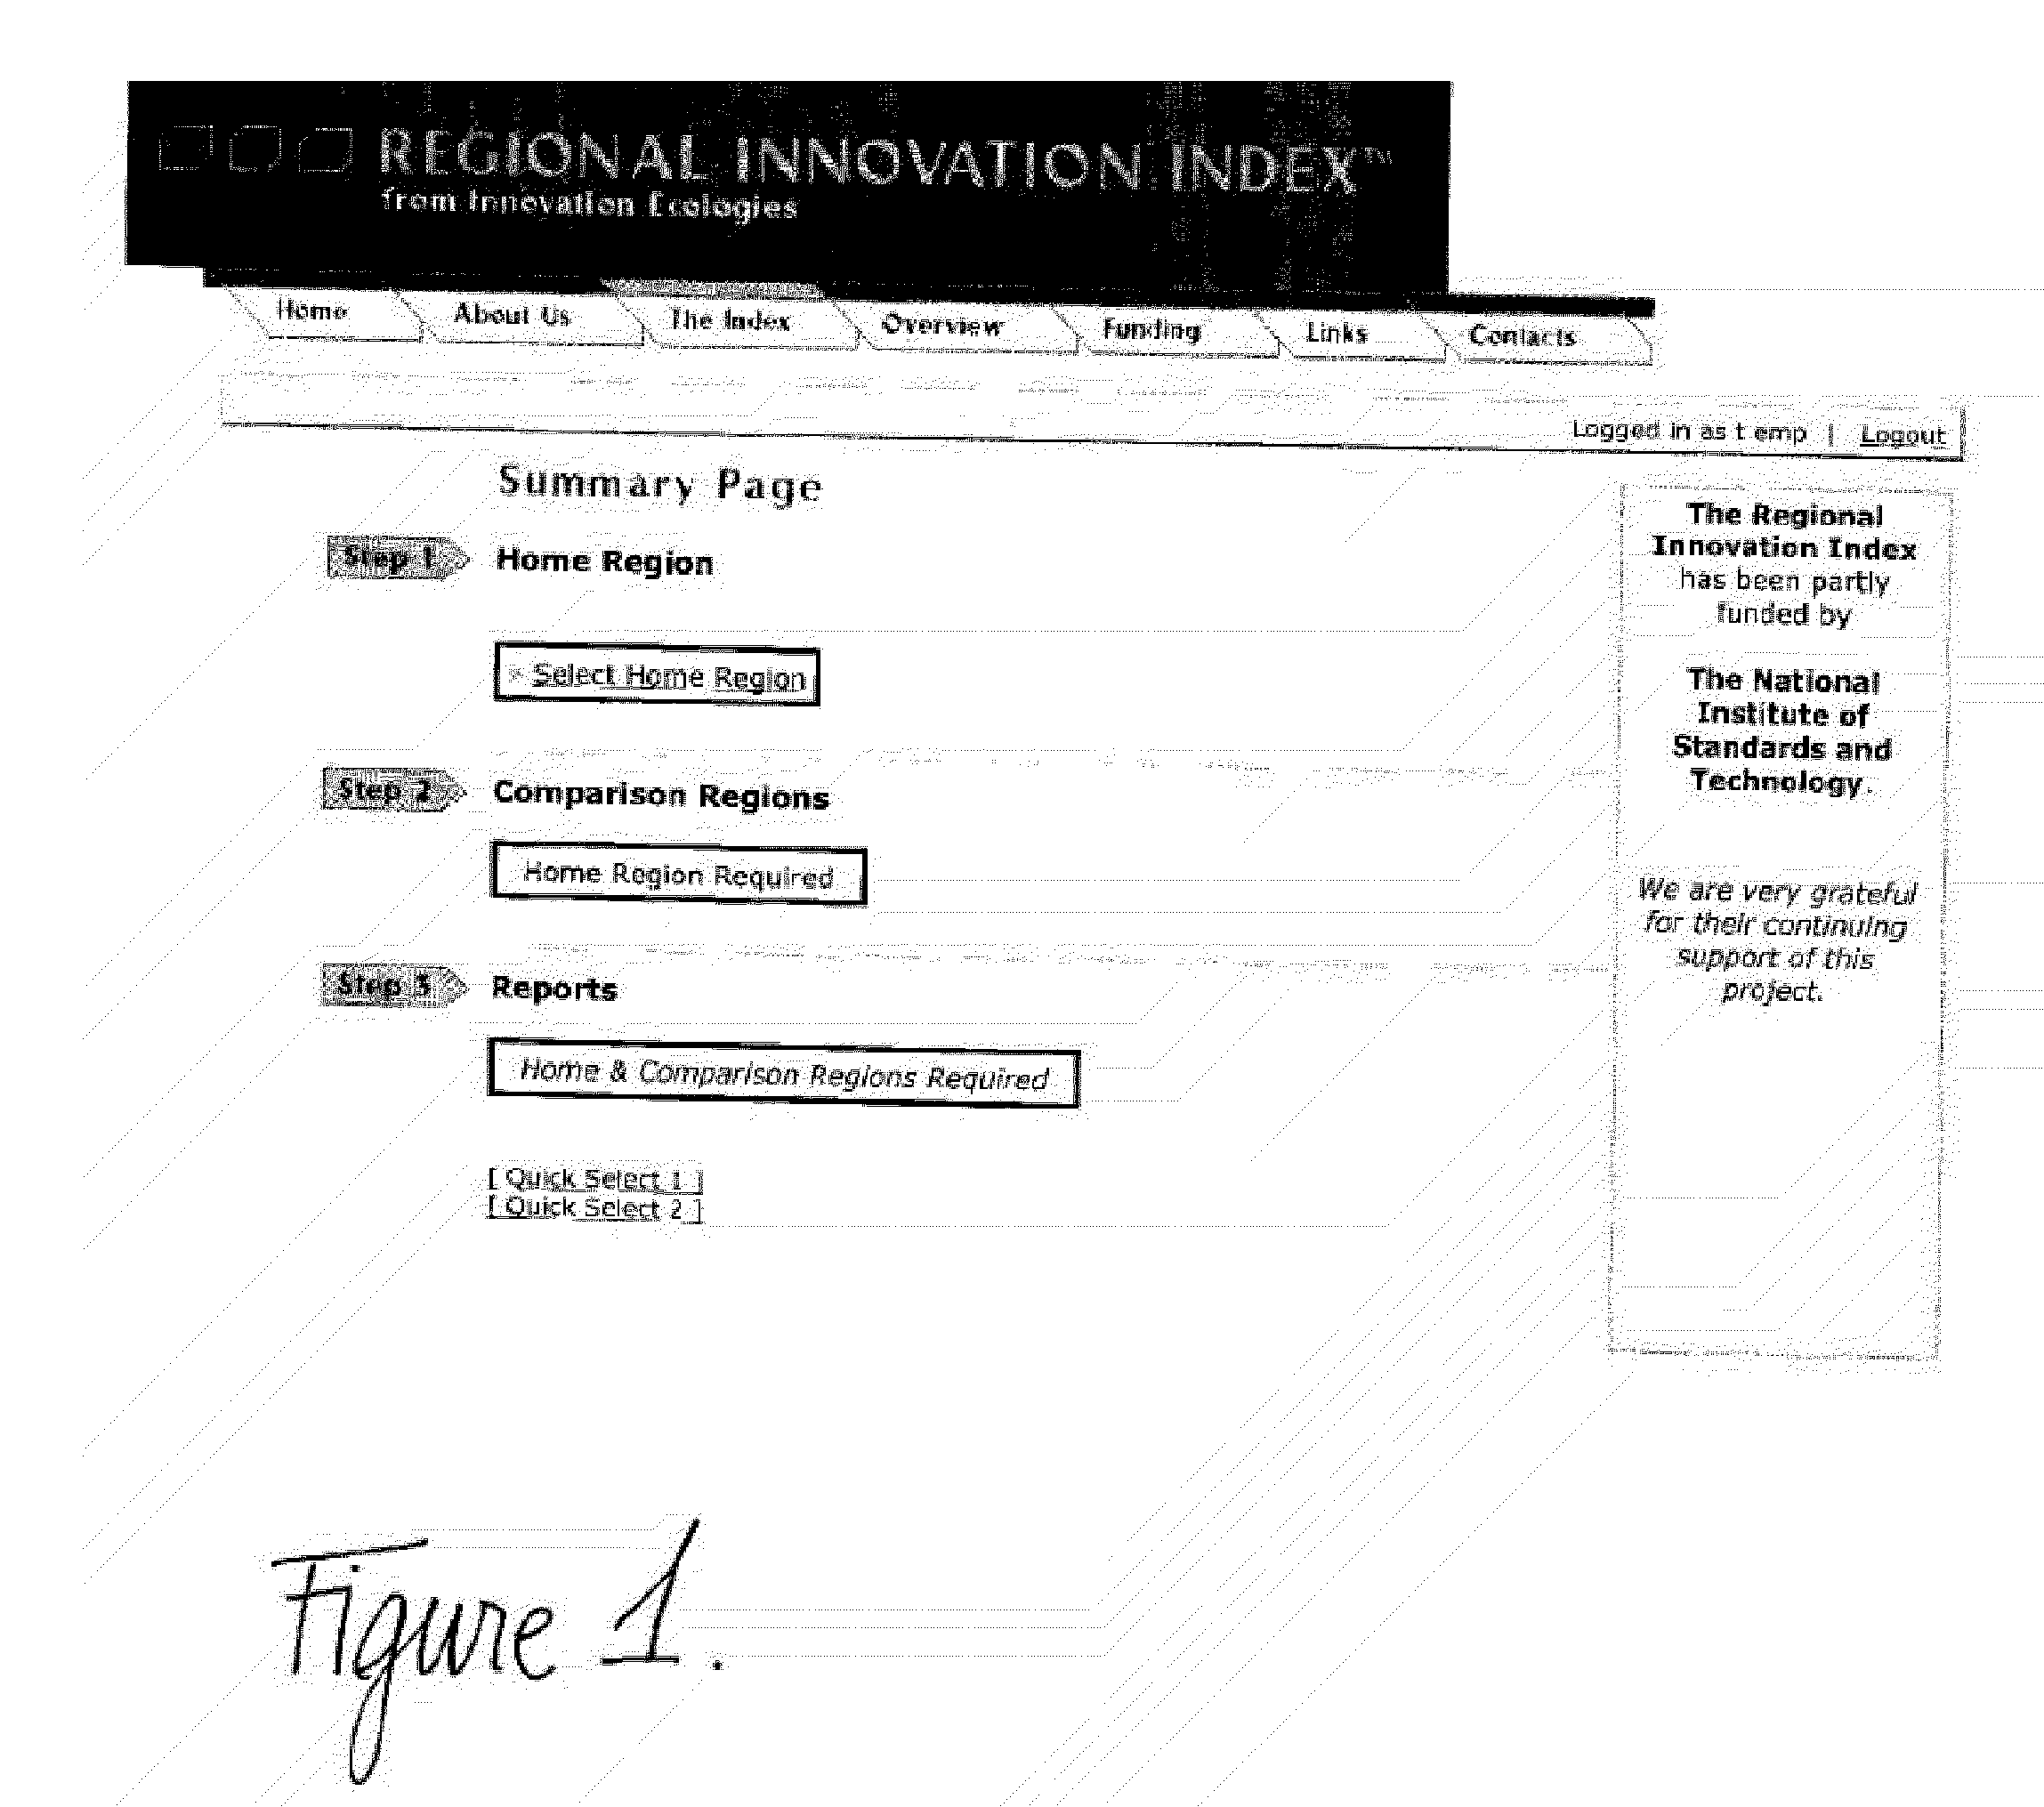
[0036] To use the present invention (Regional Innovation Index or “RII”), the user logs into the web site and onto the database with a username and password. As no personal data is stored on the system, other than usernames and passwords, the level of security currently required is limited. Multiple levels of access to the site are provided, and are currently used to determine who may see data but not change it (users), and who has full editing rights to the data (administrators).

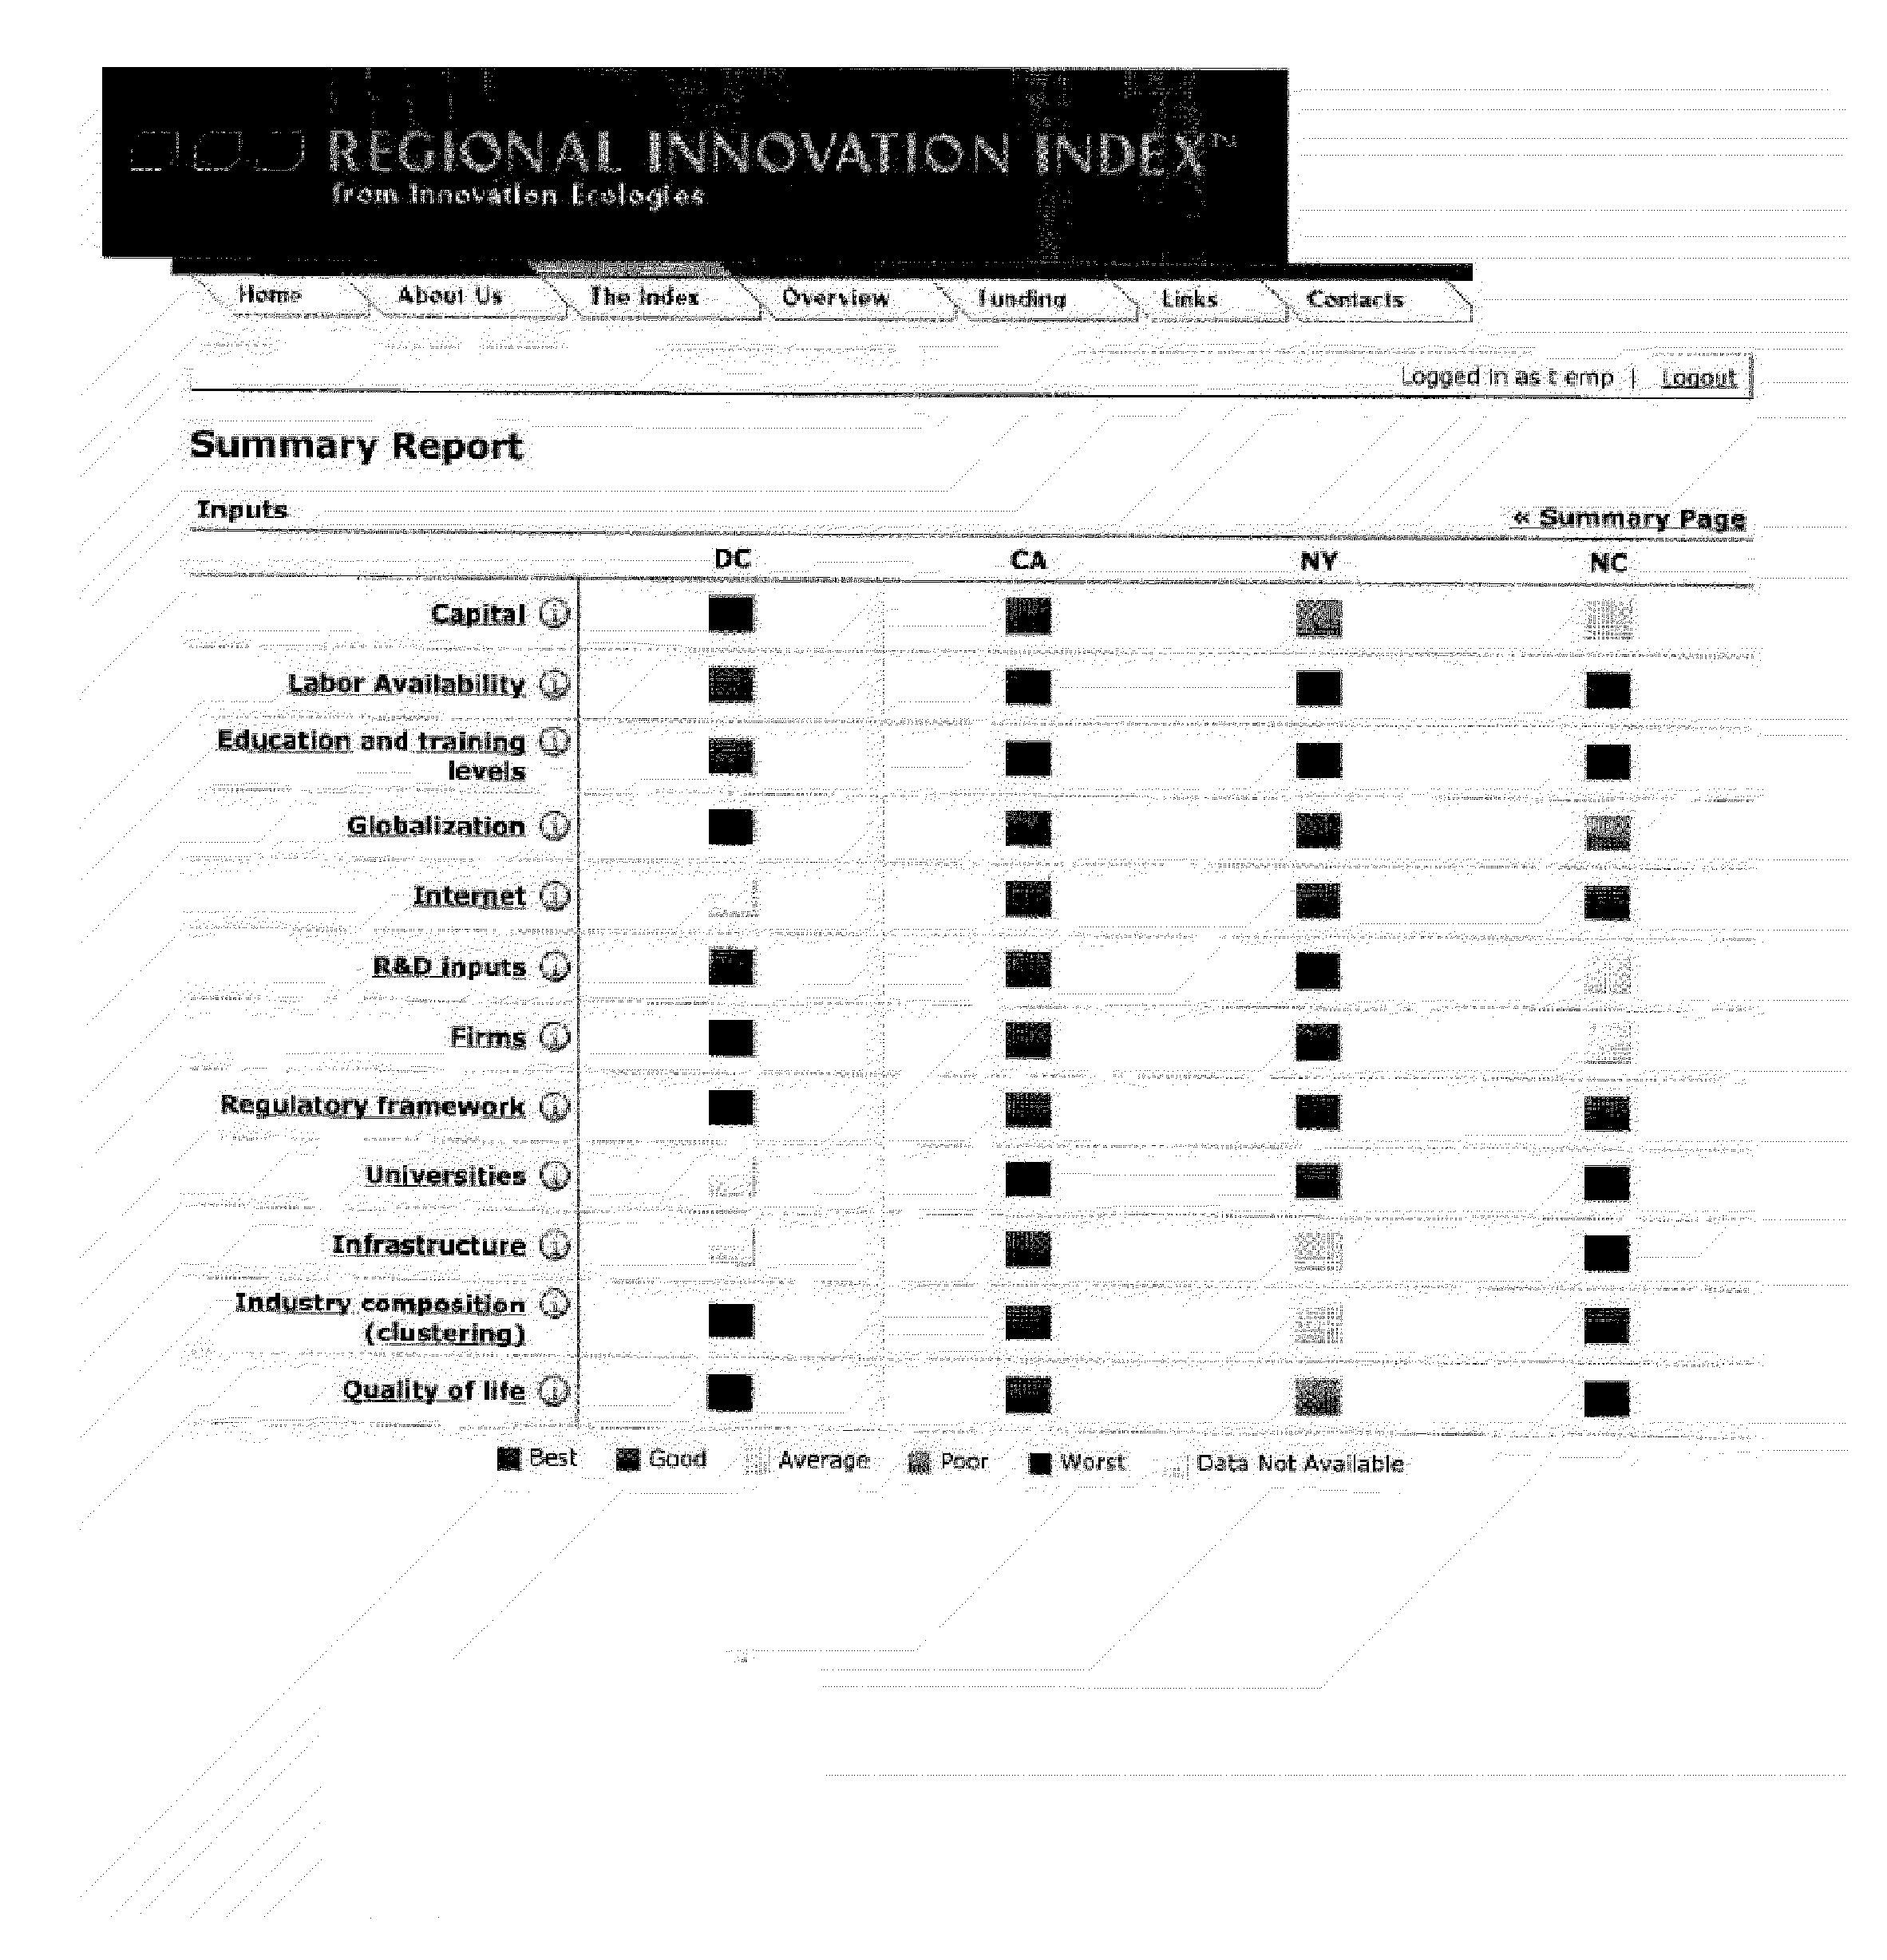
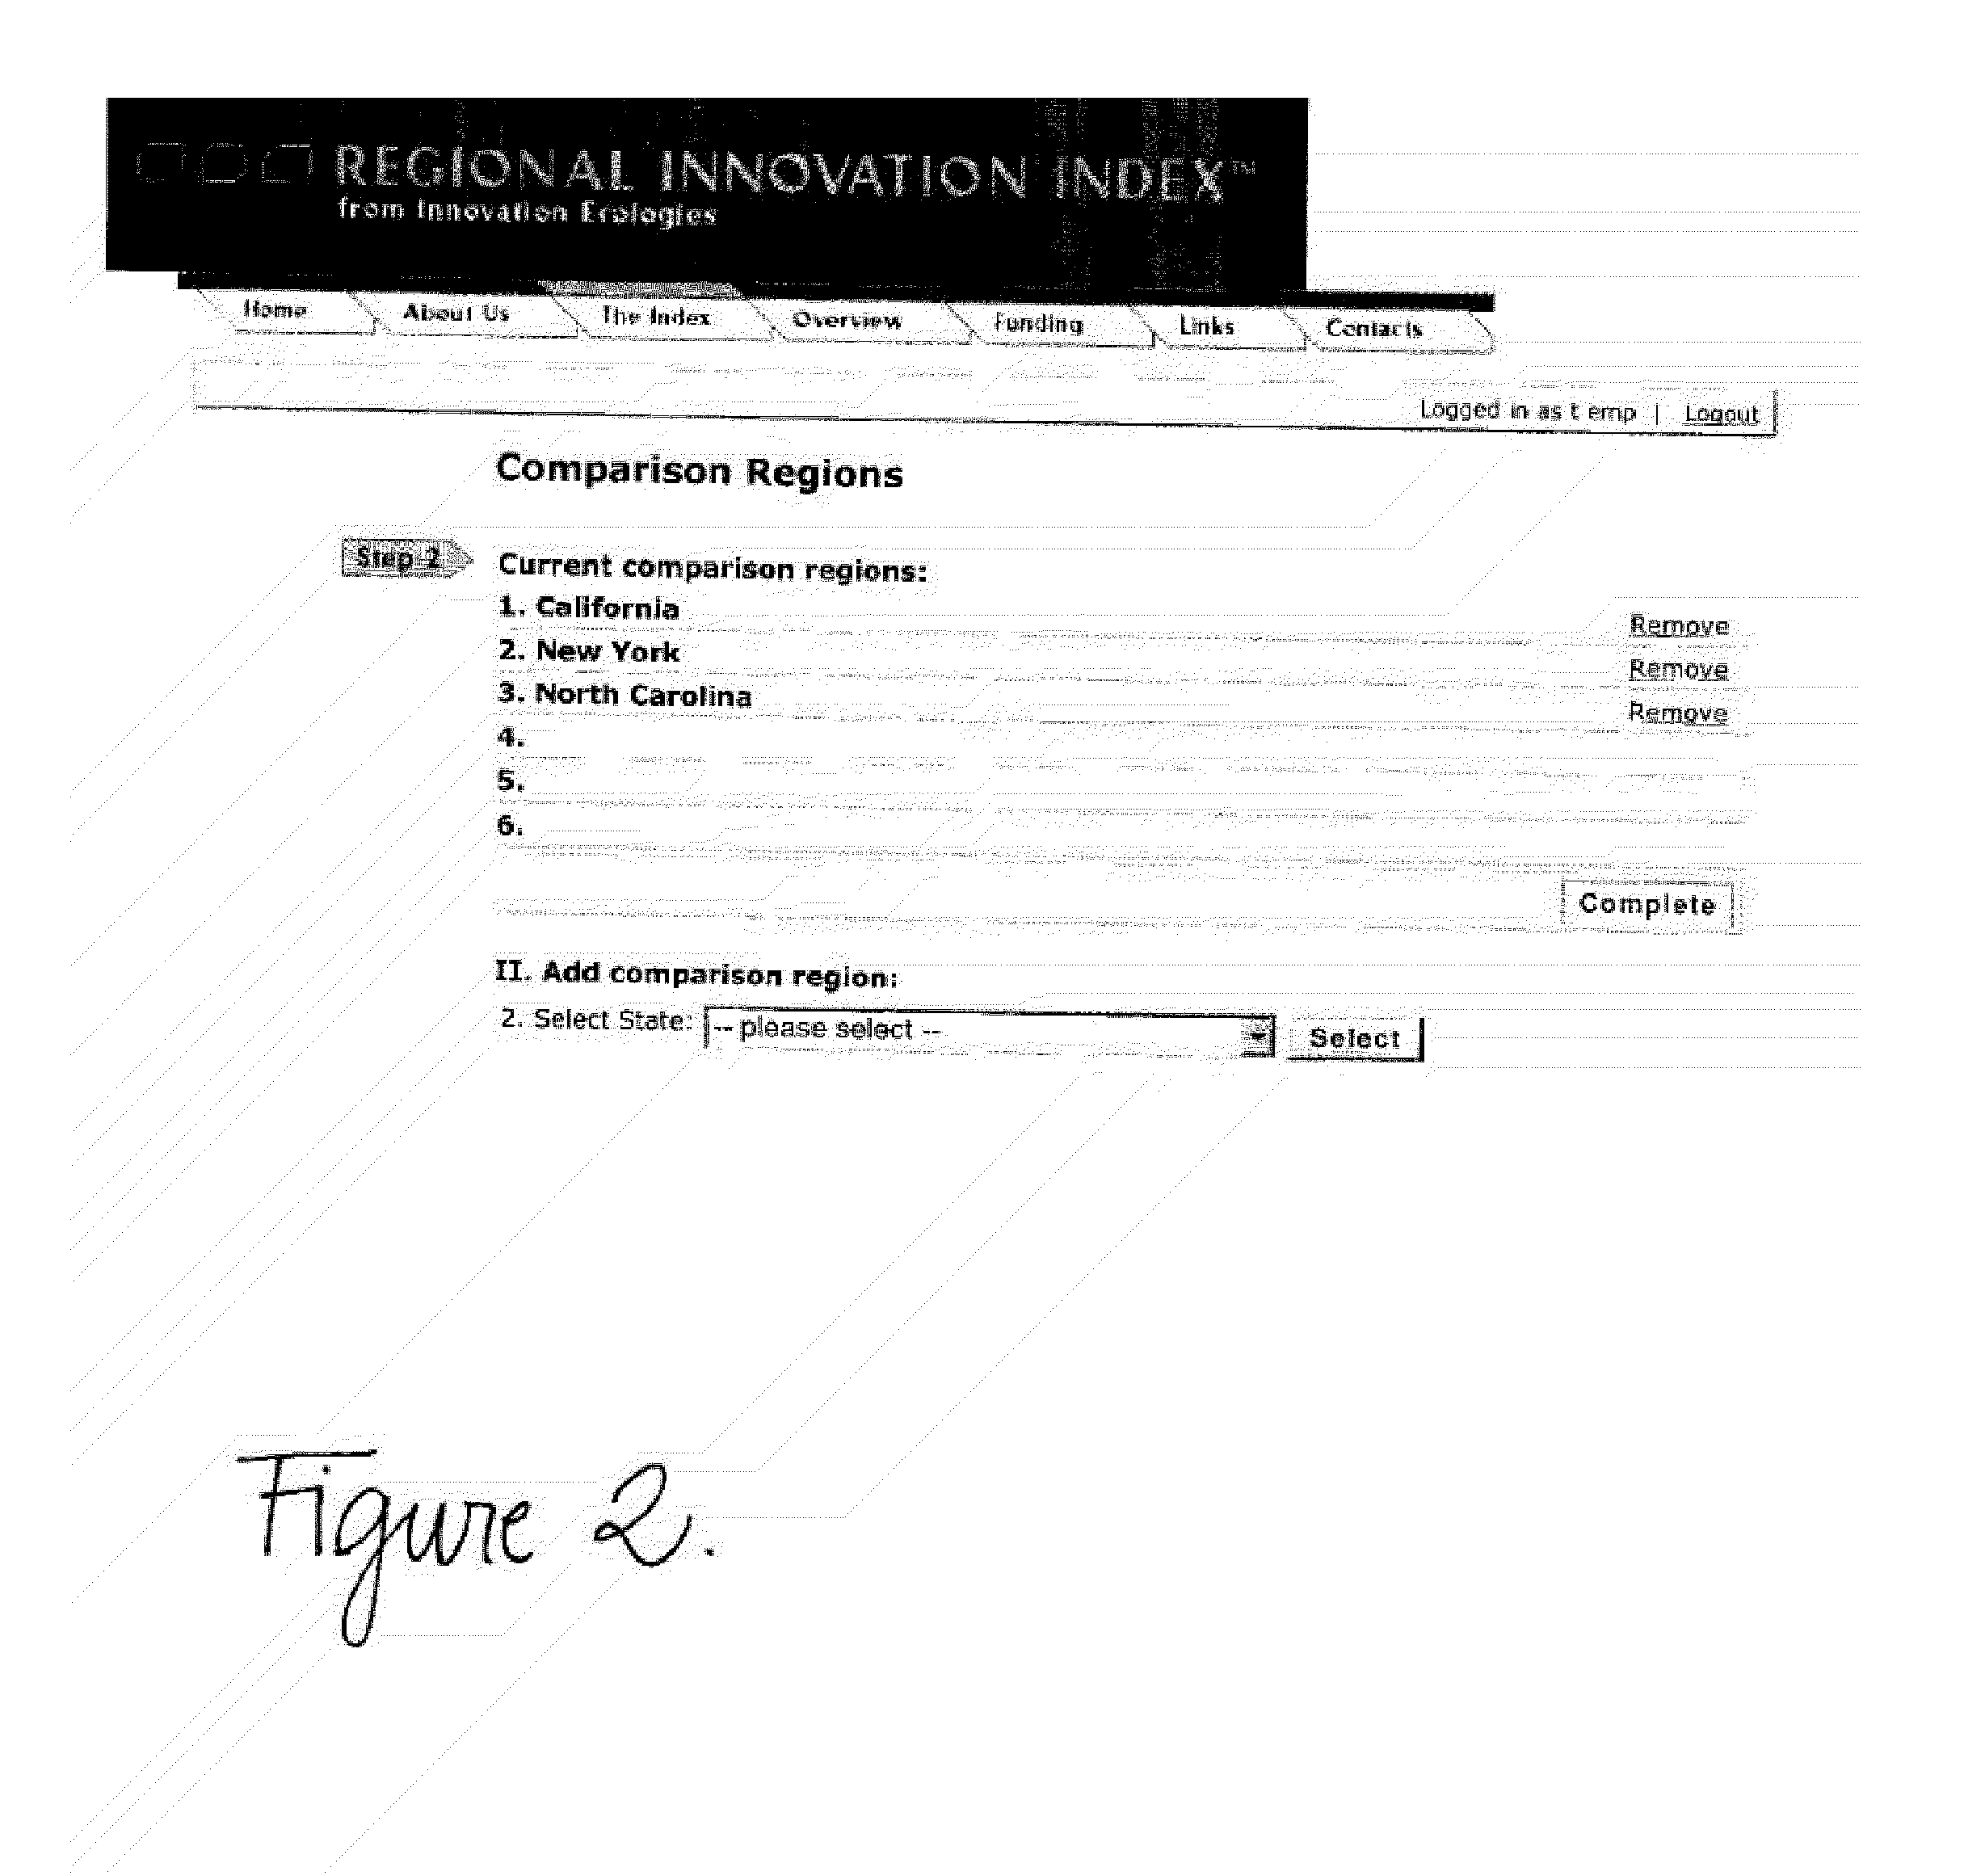
[0037] On accessing the system, users are presented with the Summary Page (see FIG. 1). Users then select a Home Region and Comparison Regions. FIG. 2 shows how a user can select up to six Comparison Regions; in this example they are selected by state. Once selection is complete, users return to the Summary Page. FIG. 3 shows the Summary Page with the Home and Comparison Regions chosen. As an example, the Home Region chosen is the District of Columbia and the Comparison Regions are California, New York and...


PUM


Abstract

A database that generates summary as well as detailed comparisons between regions on a wide range of indicators, providing clear benchmarks to support the work of policymakers and analysts as well the general public. The first implementation of this data application system is the Regional Innovation Index, focused on economic innovation. The Regional Innovation Index allows a user to compare the performance of selected regions in terms of indicators such as capital availability, education, immigration patterns, labor availability, firms, industry composition, infrastructure and university activities. The system can also filter results by industry. Eventually it is anticipated that the Regional Innovation Index will be expanded to cover international comparisons. Additional Regional Indexes will address education, healthcare, the environment, and other sectors.

Description

FIELD OF THE INVENTION [0001] The present invention is a method and process for summarizing and displaying statistical factors for various regions by using a color-coded indexing and data application system. BACKGROUND OF THE INVENTION [0002] Policymakers and analysts, academic researchers and students, and the general public all need tools that will allow them to efficiently compare different geographical regions for research and analytical purposes. These comparisons facilitate the design of good public policy and also enable the tracking of policies as they are implemented. [0003] For such comparisons to be possible, relevant information for each region must be compiled from a wide range of different sources through the collection of a large number of data sets (at least 200 data sets). This large aggregation of data should be organized for the user into a set of summary indicators. This system of summarized data—based on a compilation algorithm—would be presented to the user thr...

Claims


Application Information

Patent Timeline
Patent Type & Authority Applications(United States)
IPC IPC(8): G06F9/44
CPCG06Q10/00G06Q30/0205G06Q30/0204G06Q10/063
Inventor GASTER, ROBIN
Owner GASTER ROBIN
Why Eureka
Try Eureka