Multi-source data visualization system

a data visualization and data technology, applied in the field of data visualization, can solve the problems of complex databases that cannot be analyzed, still spend long periods of time in data analysis tasks, and lose interpretation, so as to improve the intuitive and creative approach to problem solving, and facilitate the retrieval and visualization of data

Active Publication Date: 2009-01-01
CLOUD SOFTWARE GRP INC
View PDF10 Cites 57 Cited by
  • Summary
  • Abstract
  • Description
  • Claims
  • Application Information

AI Technical Summary

Benefits of technology

[0013]Systems according to the invention can allow users to easily retrieve and visualize data from different data sets, even if they are differently formatted files located in different places. This helps the user to quickly begin working with the data in the files without first having to consolidate them, or even without knowing much about the structure of the files at all. The result is that the user can be more efficient and can more fully focus on the task of interactively exploring the substantive information in the data, rather than being bogged down with formatting issues. This leads to a more immersive and interactive experience, which tends to foster a more intuitive and creative approach to problem solving.
[0014]In the course of exploring a database about sales, for example, a user might get the idea that some sales patterns seem to be related to weather patterns. To investigate this assumption, the user could quickly add a historical weather data set organized by zip code, and immediately begin exploring the interaction between the two tables. He or she could investigate the relationship between temperature and the purchase of bulky items, for example, or the effect of anticipated storms on sales generally. And because the user can simply add the table into an existing project, the interruption can be minimal, and the user therefore does not tend to lose his or her train of thought. Prior art systems, in contrast, may require the user to merge the two tables outside of the system before investigating data relationships, which can be time-consuming and interrupt the user's work flow.

Problems solved by technology

The modern world is seemingly flooded with data but is often at a loss for interpreting it.
Using this software, often very complex databases can be queried.
But these individuals are typically highly trained and highly paid, and they can still spend long periods of time in their data analysis tasks.

Method used


Image

  • Multi-source data visualization system
  • Multi-source data visualization system
  • Multi-source data visualization system

Examples


Embodiment Construction

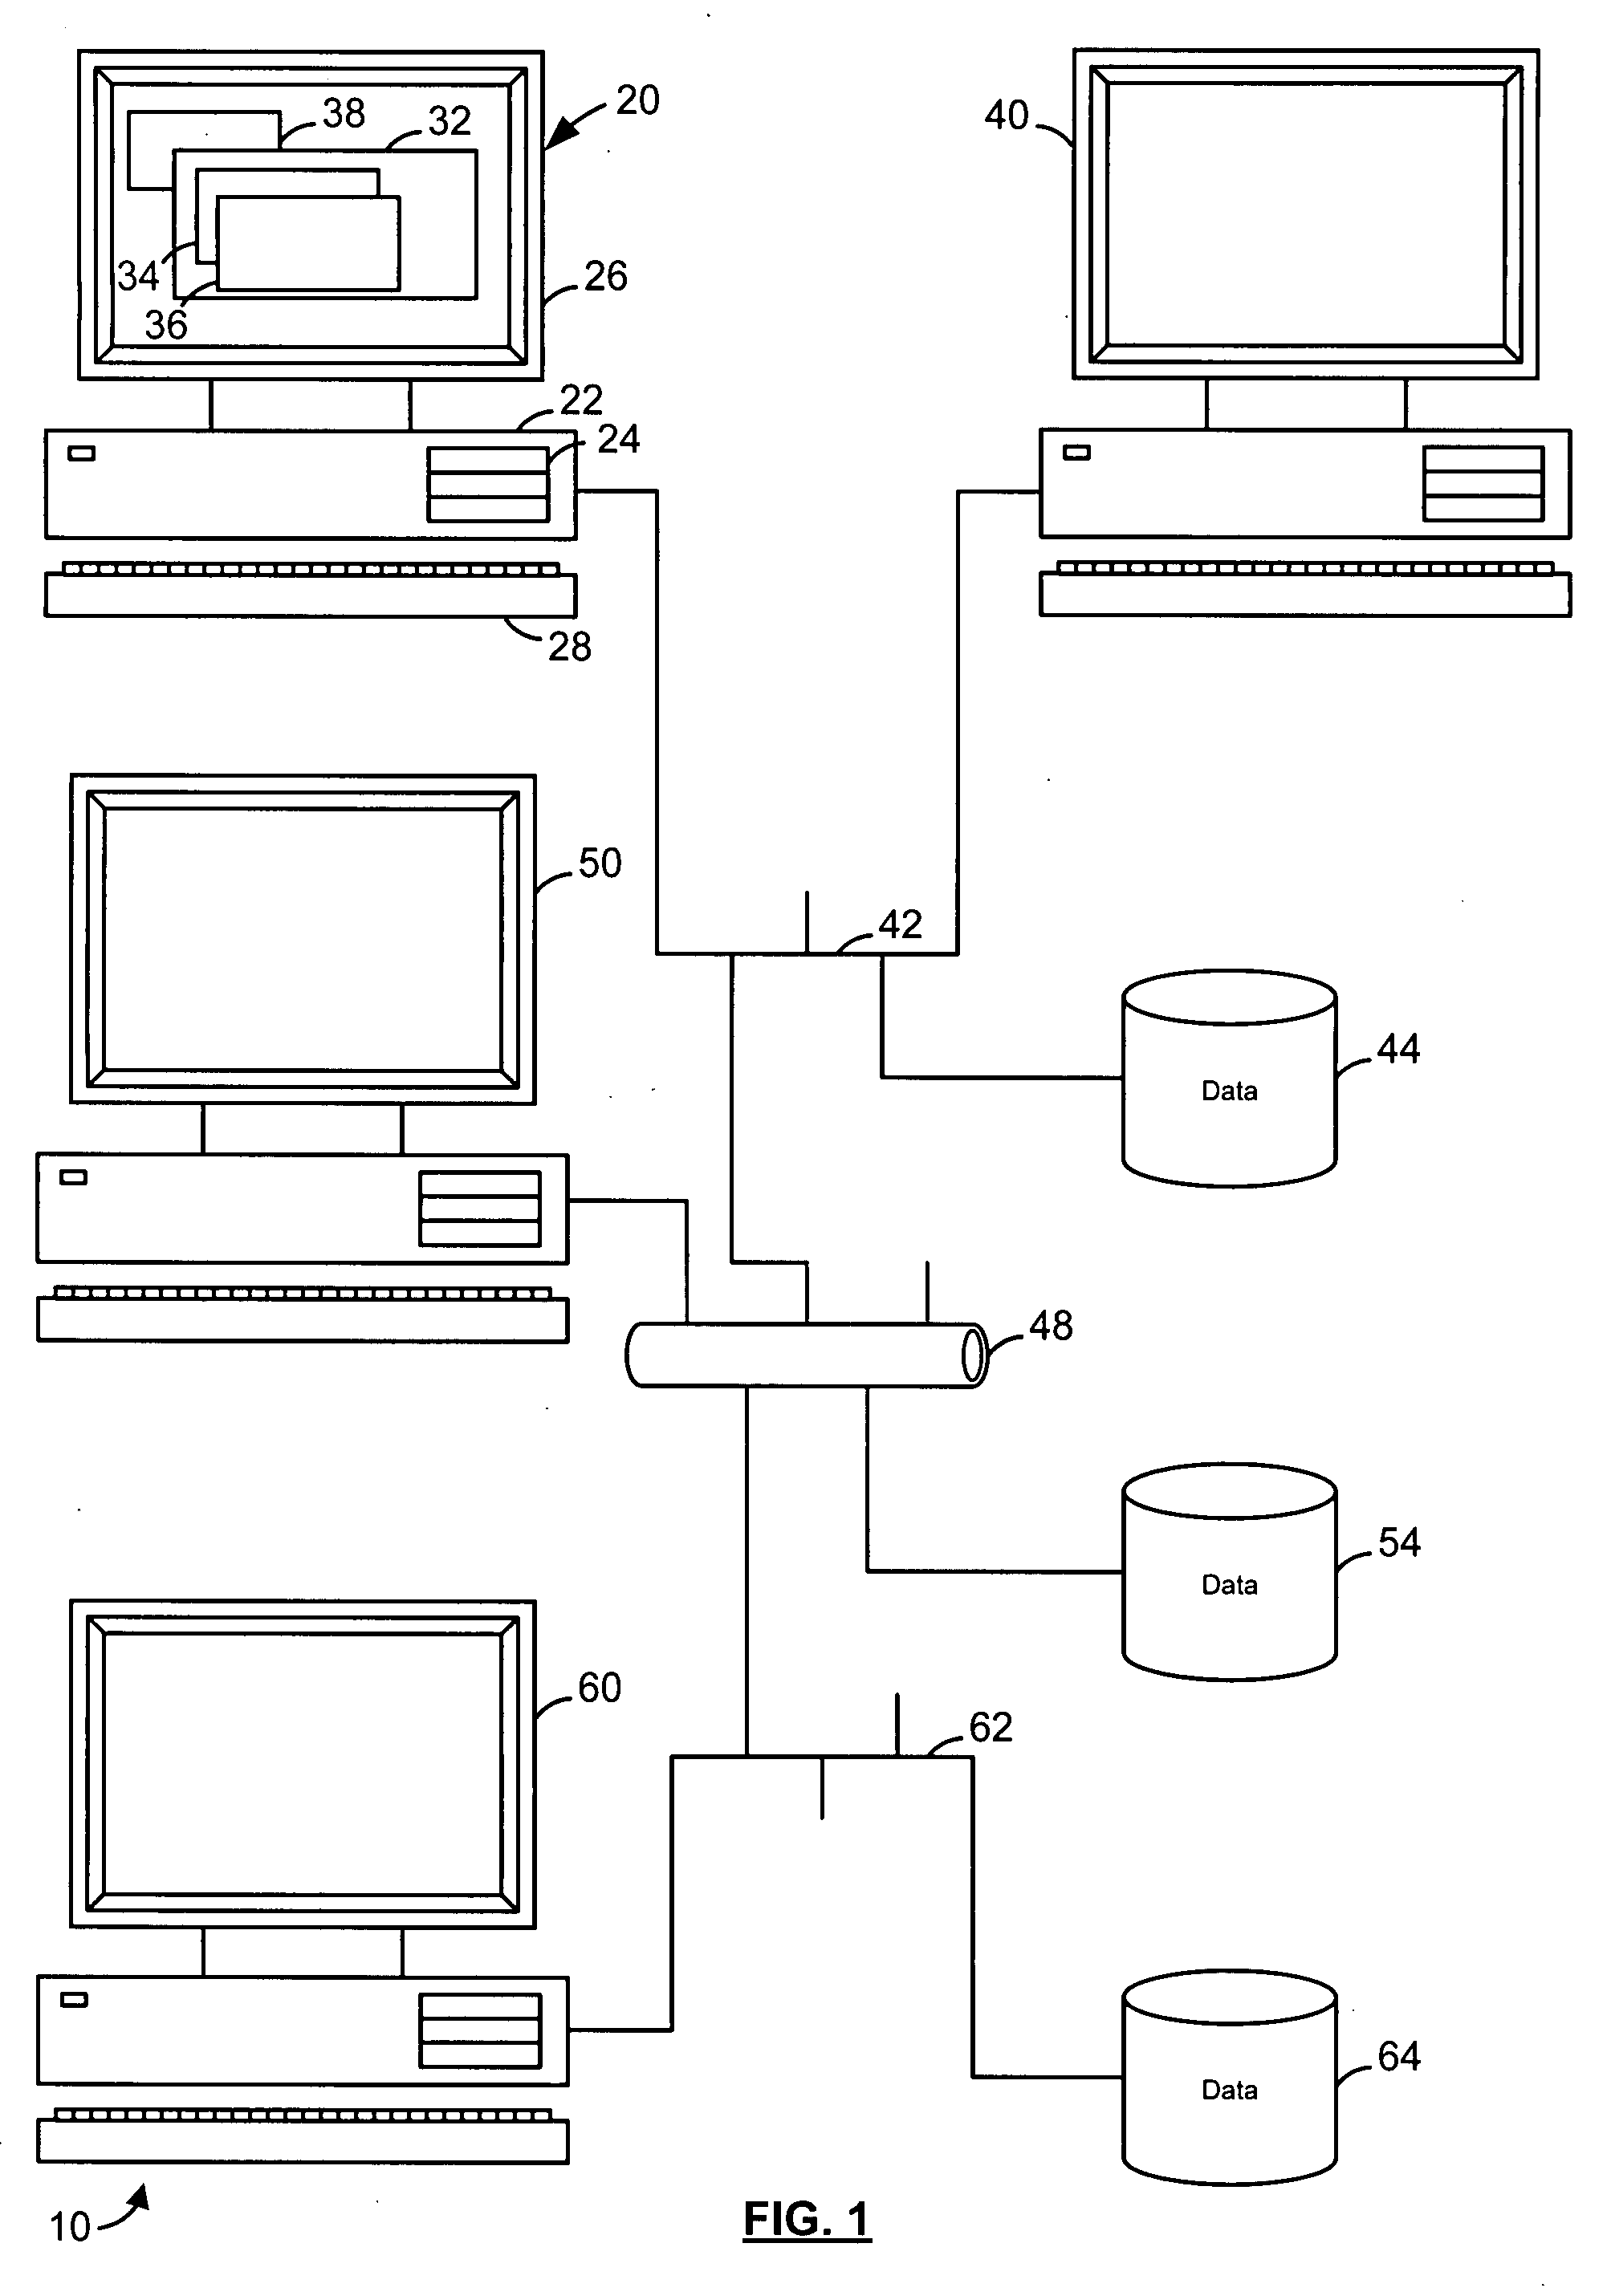
[0030]Referring to FIG. 1, an illustrative interactive data visualization system 10 according to the invention can run on one or more interacting platforms. In this embodiment, the system includes a first workstation 20, which comprises a processing unit 22, and storage 24. The storage includes high-speed storage, such as RAM, and mass storage, such as disk storage. The workstation also includes a display 26 and one or more input devices, including a keyboard 28 and a pointing device (e.g., a mouse). The workstation in this embodiment conforms to the so-called IBM-PC standard and is equipped with the well-known Microsoft Windows® operating system that enables its user to launch one or more application programs, although the system could also use other platforms, such as Apple McIntosh®, Linux®, or UNIX®-based platforms. Other types of platforms could also be supported, such as PDA's or mobile telephones.

[0031]The workstation 10 has access to a visualization application that can pres...


PUM


Abstract

In one general aspect, the application discloses a data visualization method in which at least two retrieved data tables are associated based on a selection of at least one common field. A visualization is displayed for data from a first of the tables and input for query devices is received to filter data for a second of the tables. The displayed visualization for the first table can then be updated in response to the received query device input for the second table based on the created association.

Description

FIELD OF THE INVENTION[0001]This invention relates to the field of data visualization, including the design of data visualization systems.BACKGROUND OF THE INVENTION[0002]The modern world is seemingly flooded with data but is often at a loss for interpreting it. One exceptionally useful tool that has found wide acceptance is software that presents the data in some visual form, especially in a way that makes relationships noticeable. Using this software, often very complex databases can be queried. The results of the queries are then analyzed and displayed in some visual format, usually graphical, such as a bar or pie chart, scatter plot, or any of a large number of other well-known formats. Modern analysis tools then allow the user to dynamically adjust the ranges of the displayed results in order to change and see different aspects of the analysis.[0003]One prominent data visualization product is owned by Spotfire AB of Goteborg, Sweden, and marketed under the name DecisionSite.® I...

Claims


Application Information

Patent Timeline
Patent Type & Authority Applications(United States)
IPC IPC(8): G06F17/30
CPCG06F17/30554G06F16/248
Inventor LEHTIPALO, TOBIASTHORESSON, JOHANFORTES, TOMMYVULCAN, DANIEL
Owner CLOUD SOFTWARE GRP INC
Why Eureka
Try Eureka