Graphical display for physiological patient data

a graphical display and patient technology, applied in the field of graphical user interfaces, can solve the problems of limited in the amount of additional information provided, graphical displays may not be intuitive and easy to read,

Inactive Publication Date: 2009-04-30
MEDTRONIC MIMIMED INC
View PDF27 Cites 117 Cited by
  • Summary
  • Abstract
  • Description
  • Claims
  • Application Information

AI Technical Summary

Benefits of technology

[0009]This summary is provided to introduce a selection of concepts in a simplified form that are further described below in the detailed description. This summary is not intended to identify key features or essential features of the claimed subject matter, nor is it intended to be used as an aid in determining the scope of the claimed subject matter.

Problems solved by technology

Although such graphical displays might adequately convey the BG level information, they can be limited in the amount of additional information they provide.
Moreover, such graphical displays may not be intuitive and easy to read.

Method used


Image

  • Graphical display for physiological patient data
  • Graphical display for physiological patient data
  • Graphical display for physiological patient data

Examples


first embodiment

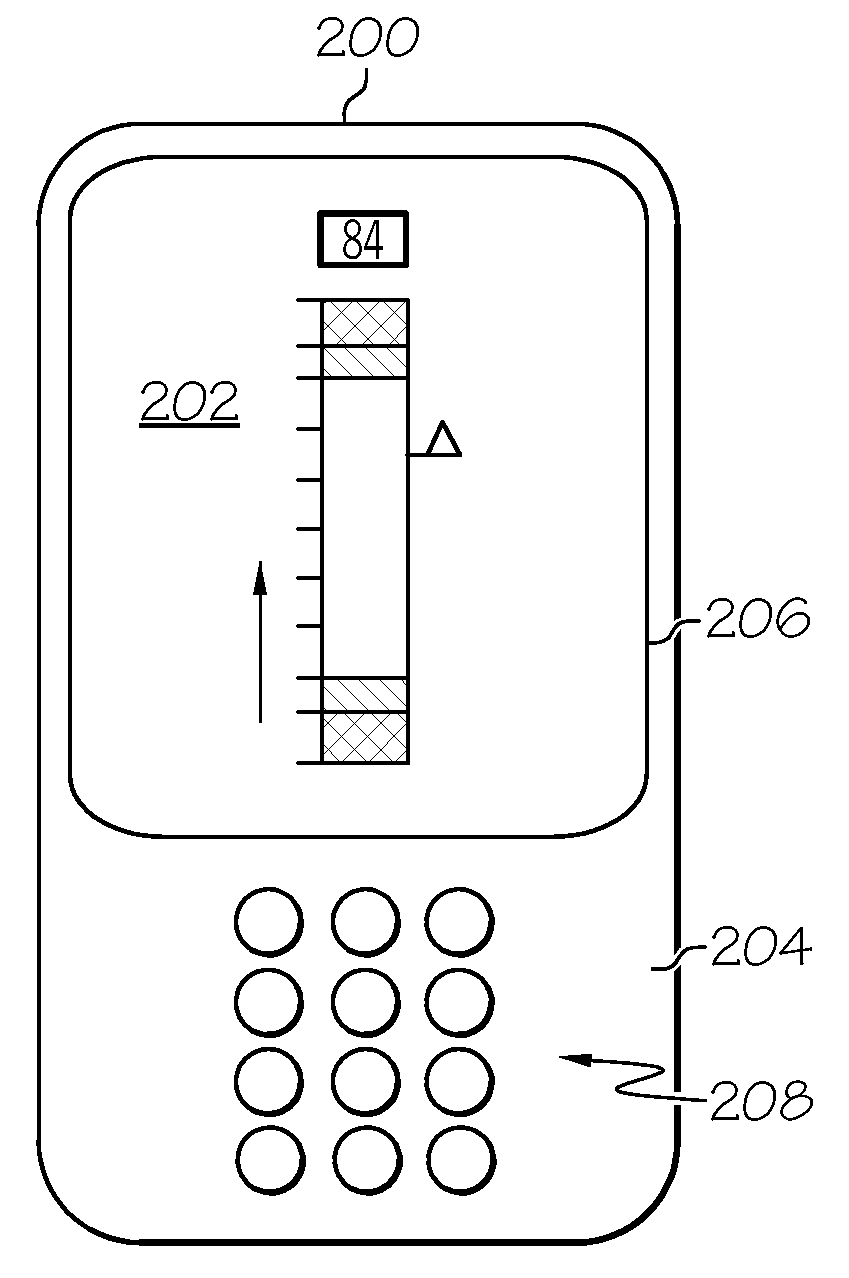
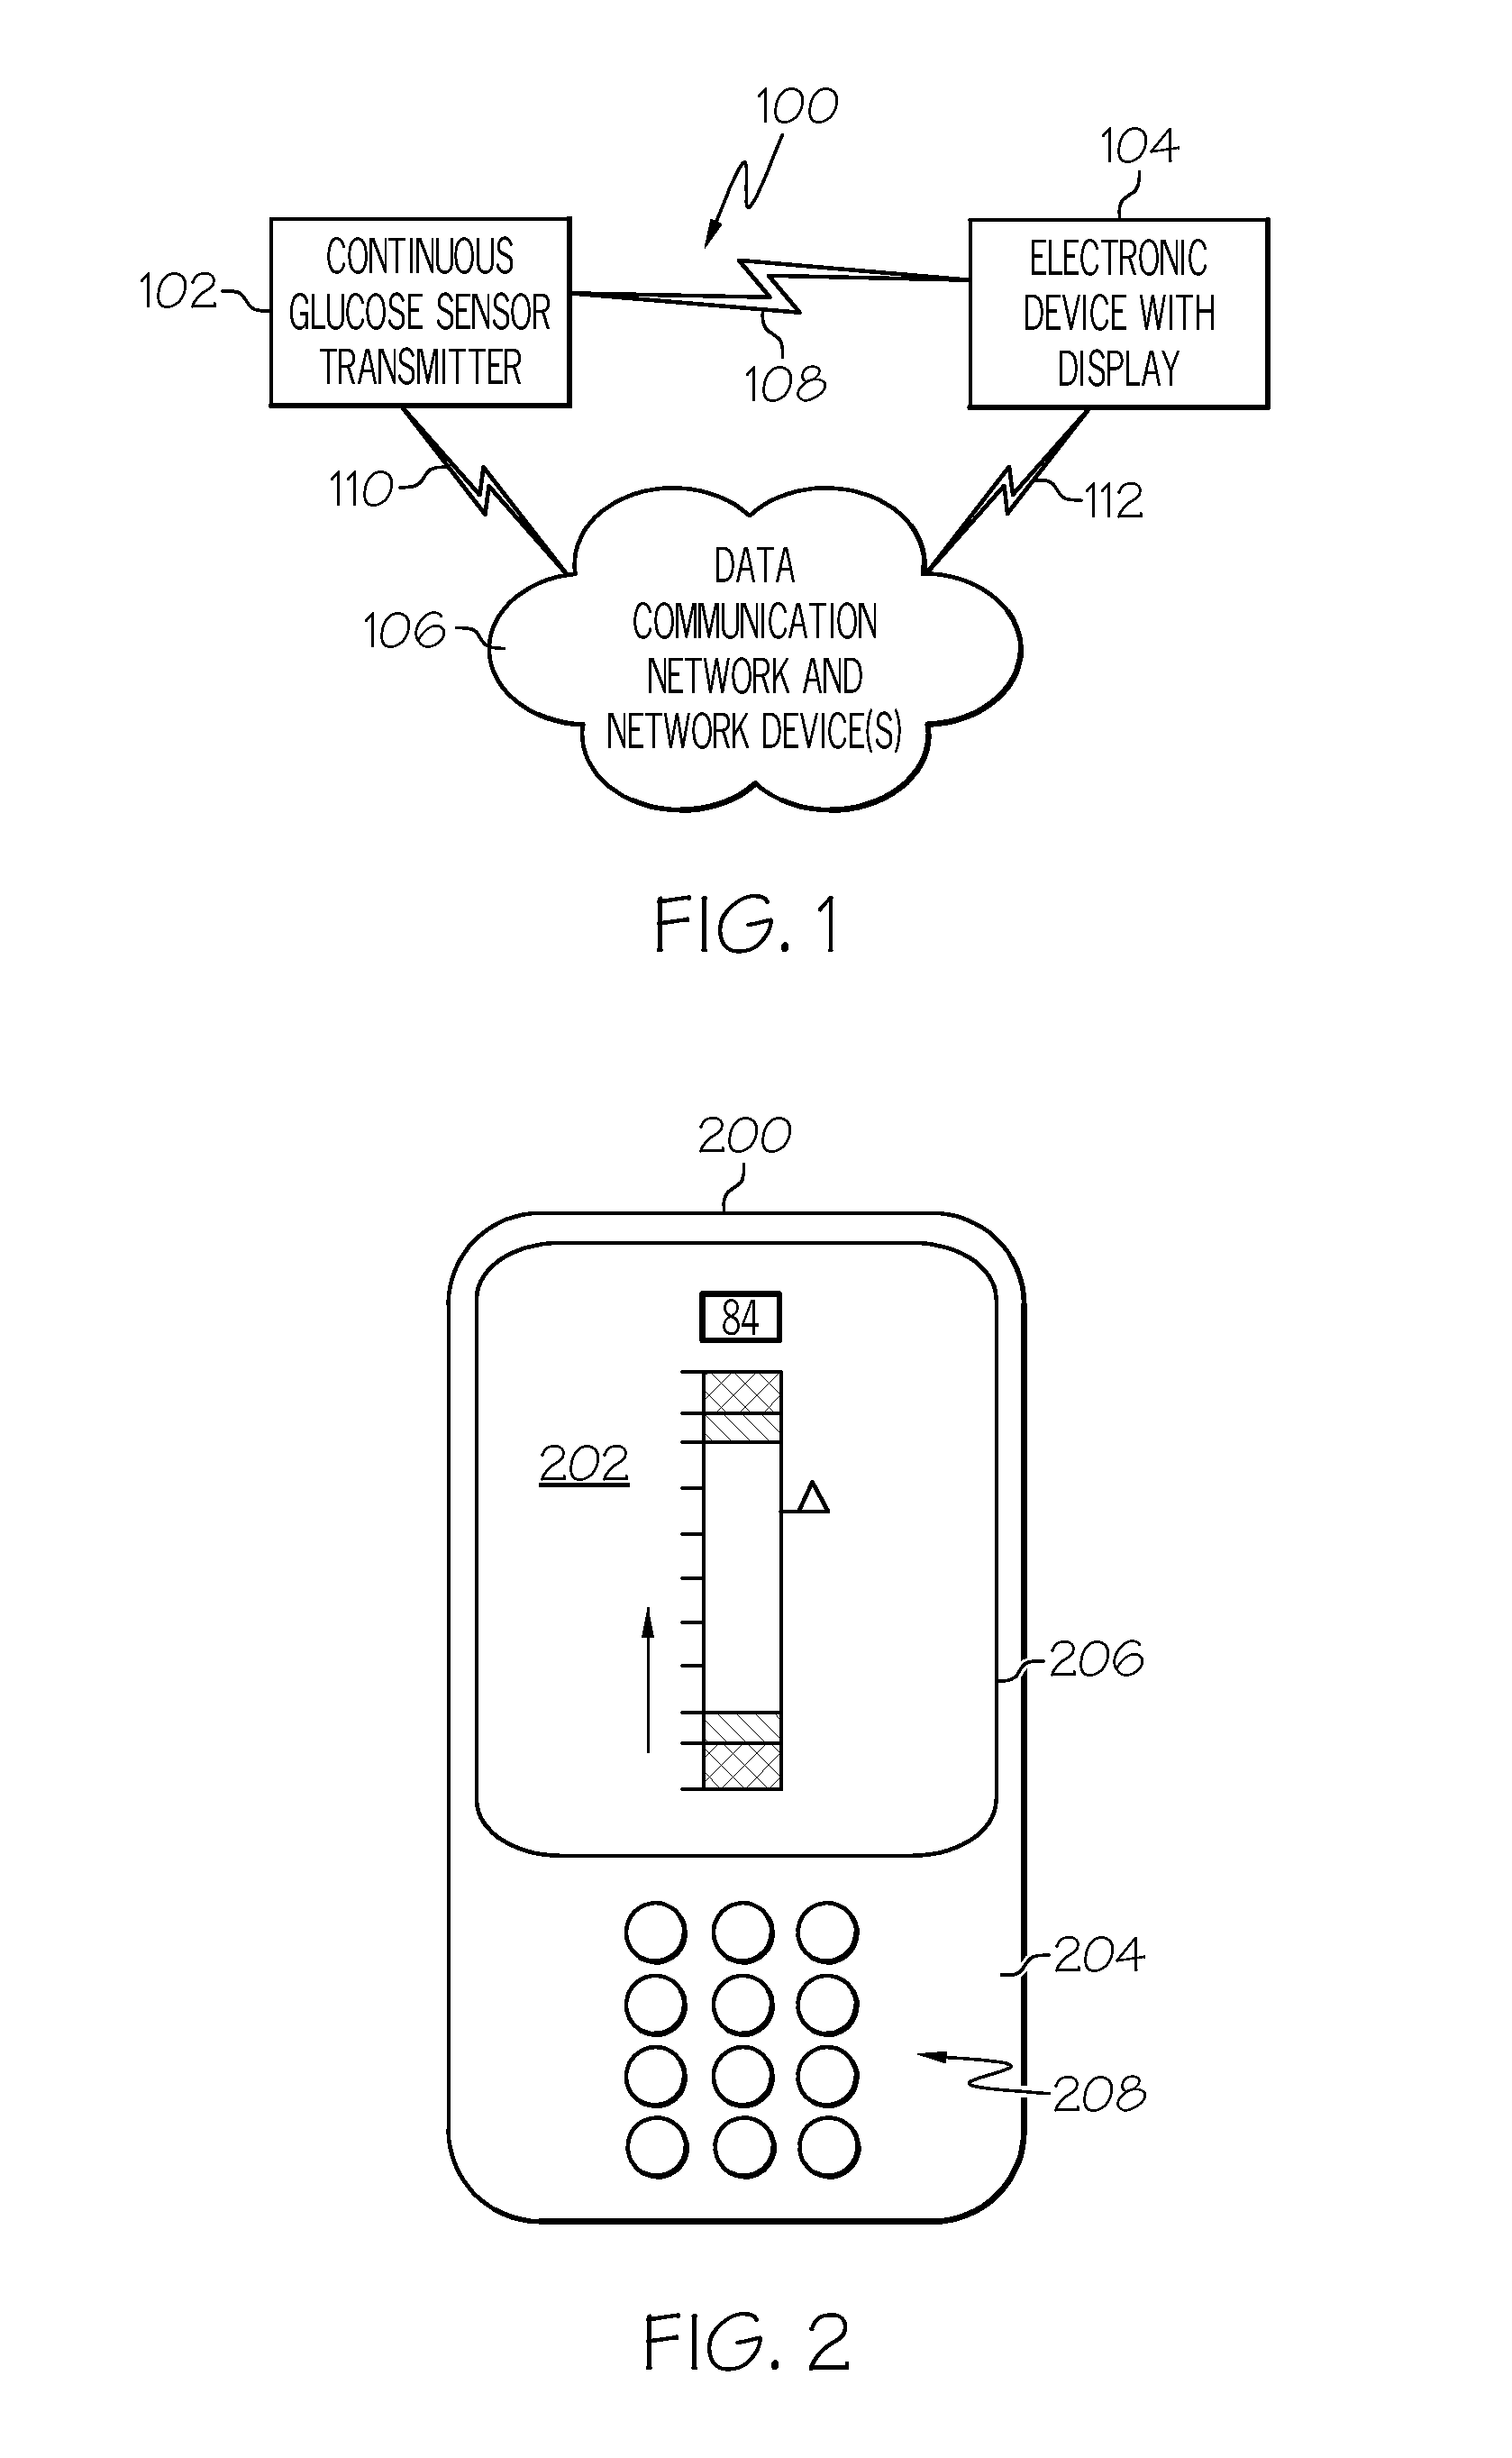
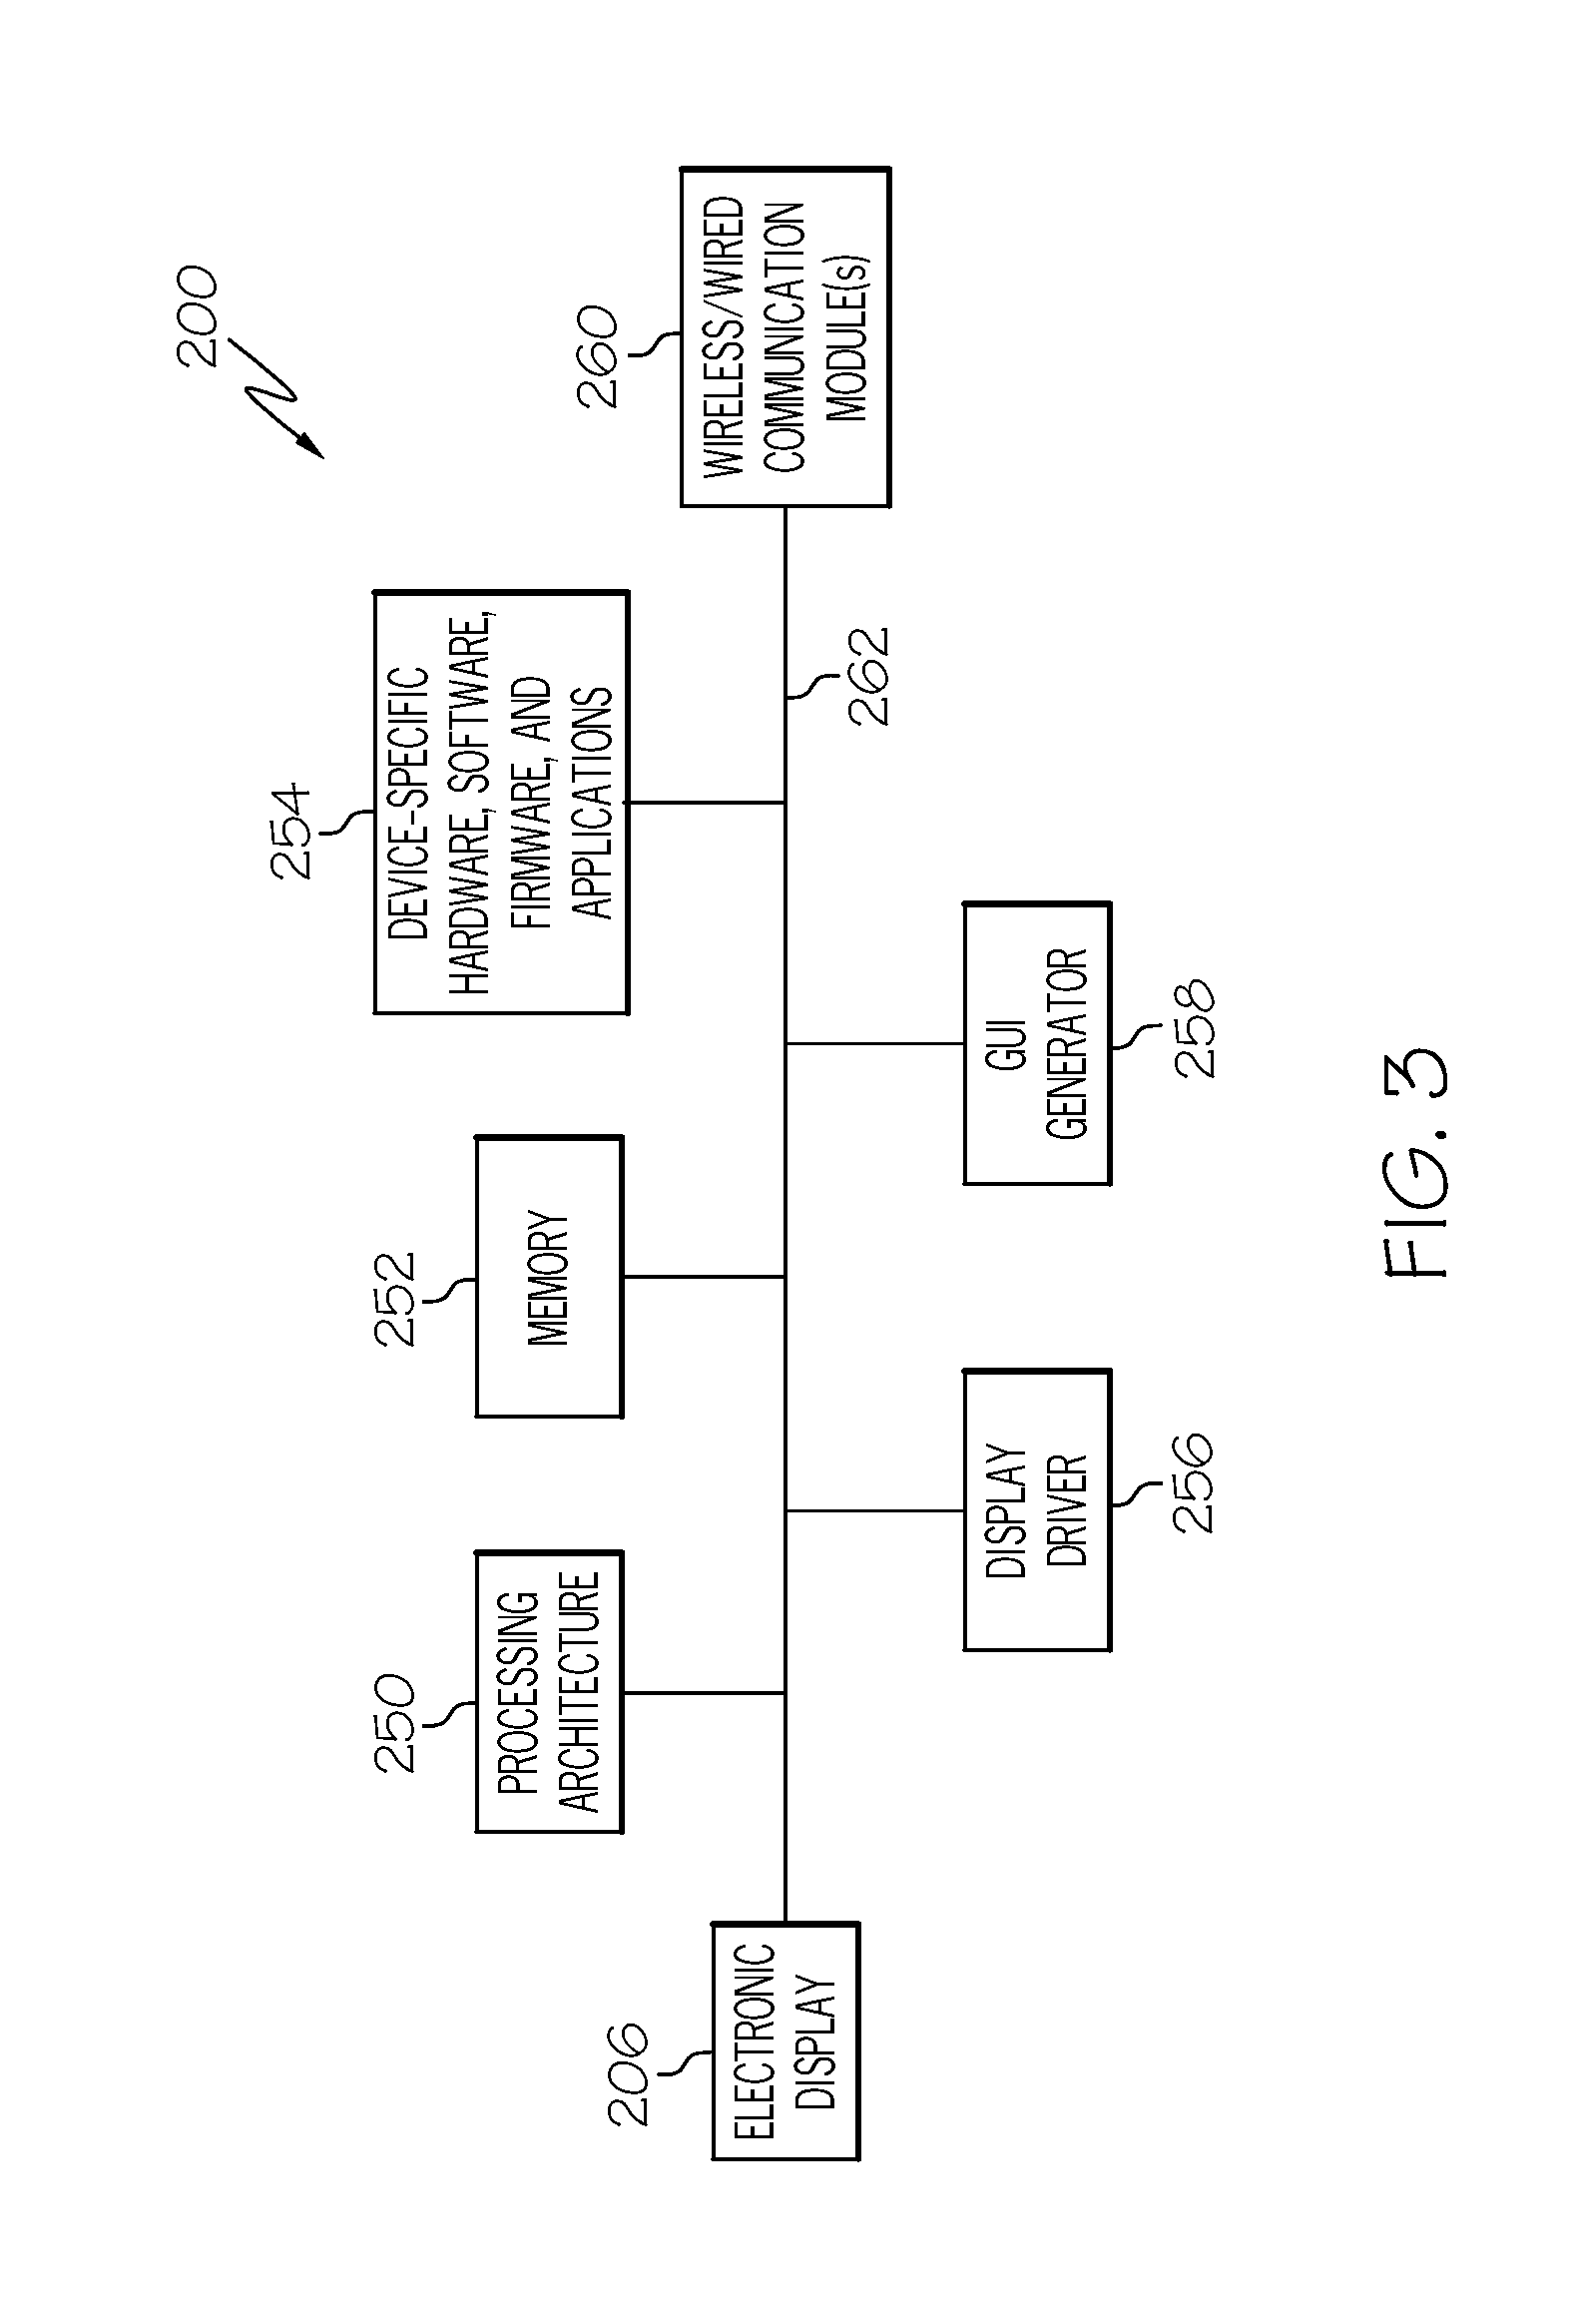
[0037]An embodiment of electronic device 200 is suitably configured to render on electronic display 206 a graphical element that represents an intuitive graphical display of physiological patient data (e.g., BG measurement values), regardless of its form factor, native GUI capabilities, display resolution, and graphics rendering capabilities. In this regard, FIGS. 4-7 illustrate an intuitive graphical display 300 of physiological patient data in different states. The values depicted in the figures represent typical values, and they are not intended to limit or otherwise restrict the embodiments described here. In this regard, typical BG values can range from about 20 mg / dl to over 600 mg / dl. FIG. 4 depicts intuitive graphical display 300 for a normal BG level that is increasing at a relatively high rate of change, FIG. 5 depicts intuitive graphical display 300 for a high BG level that is increasing at a relatively low rate of change, FIG. 6 depicts intuitive graphical display 300 fo...

second embodiment

[0054]FIGS. 8-10 illustrate an intuitive graphical display 400 of physiological patient data in different states. Intuitive graphical display 400 includes a number of features and elements that were described above for intuitive graphical display 300. For the sake of brevity, shared features, elements, and aspects will not be redundantly described here in the context of intuitive graphical display 400. FIG. 8 depicts intuitive graphical display 400 for a normal BG level that is increasing at a relatively low rate of change, FIG. 9 depicts intuitive graphical display 400 for a high BG level that is decreasing at a relatively high rate of change, and FIG. 10 depicts intuitive graphical display 400 for a very low BG level that is increasing at a relatively intermediate rate of change.

[0055]In contrast to intuitive graphical display 300, which utilizes a separate and distinct rate of change pointer 310, intuitive graphical display 400 integrates a rate of change pointer into its measure...

third embodiment

[0058]FIGS. 11-13 illustrate an intuitive graphical display 500 of physiological patient data in different states. Intuitive graphical display 500 includes a number of features and elements that were described above for intuitive graphical display 300 and / or for intuitive graphical display 400. For the sake of brevity, shared features, elements, and aspects will not be redundantly described here in the context of intuitive graphical display 500. FIG. 11 depicts intuitive graphical display 500 for a normal BG level that is increasing, FIG. 12 depicts intuitive graphical display 500 for a high BG level that is decreasing at a relatively moderate rate of change, and FIG. 13 depicts intuitive graphical display 500 for a very low BG level that is increasing at a relatively high rate of change.

[0059]Intuitive graphical display 500 is similar to intuitive graphical display 400, however, intuitive graphical display 500 employs a rate of change pointer 502 that is rendered at different angle...


PUM


Abstract

An intuitive graphical display as described herein can be rendered by a host device that obtains physiological patient data (such as blood glucose values) in real time or substantially real time. The graphical display includes a calibrated bar graph having a desired measurement range for the monitored parameter. The graphical display also includes a dynamic measurement value indicator that moves along the bar graph in a manner that tracks the current value of the monitored physiological characteristic. The graphical display may also incorporate easy-to-interpret display elements that allow the user to quickly determine whether the current value of the monitored physiological characteristic is within or outside a normal range, whether the monitored physiological characteristic is rising or falling, and the approximate rate of change of the monitored physiological characteristic.

Description

TECHNICAL FIELD[0001]Embodiments of the subject matter described herein relate generally to devices that monitor one or more conditions of a patient. More particularly, embodiments of the subject matter relate to a graphical user interface that displays physiological patient data on a monitor or other device.BACKGROUND[0002]The prior art includes devices, systems, and equipment designed to process and display medical data for a patient. For example, patient monitoring equipment is often used to graphically display a patient's heart rate, blood pressure, and other measured physiological characteristics. The prior art also includes medical devices that are intended for personal use by the patient or the patient's caregiver; such medical devices may be designed to be carried by the patient or designed for use in the home. For example, diabetics are usually required to modify and monitor their daily lifestyle to keep their body in balance, in particular, their blood glucose (BG) levels....

Claims


Application Information

Patent Timeline
Patent Type & Authority Applications(United States)
IPC IPC(8): G06F17/00
CPCA61B5/14532A61B5/0022A61B5/743A61B5/742A61B5/746
Inventor HALPERN, ARIEH S.TALBOT, CARY
Owner MEDTRONIC MIMIMED INC
Why Eureka
Try Eureka