System and method for systematically arranging a set of display elements in assemblages to meaningfully represent data

a technology of display elements and assemblages, applied in the field of computer graphics displays, can solve the problems of insufficient development of methods for selecting an appropriate data visualization, inability to give people enough context and perspective, and inability to give people enough data visualization, etc., and achieve the effect of less disorientation

Inactive Publication Date: 2009-08-13
VISUAL I O
View PDF10 Cites 30 Cited by
  • Summary
  • Abstract
  • Description
  • Claims
  • Application Information

AI Technical Summary

Benefits of technology

[0013]Therefore, there is a need for a method and system that addresses the above and other problems. The above and other problems are addressed by the exemplary embodiments of the present invention, which provide a way for information to be automatically organized in display formats and metaphors that are appropriate to the needs of the person seeking the information. The viewer is thereby able to see information in a form that helps him or her see useful relationships in the data so as to better understand and act on that information in a problem-solving or decision-making context. The exemplary embodiments address the limitations of previous efforts (e.g. to catalog and automate the creation of visualization techniques) by considering the set of relations relevant to decision steps within a standard decision model (e.g., a Normalized Decision Model). Instead of trying to capture every type of possible information relationship within an elemental framework, the exemplary embodiments permit a smaller number of decision-relevant relationships to be addressed in more wholistic and detailed ways. In contrast to user-interfaces which provide a completely different metaphor—table, chart, etc.—with each view, or which aggregate numerous charts on a page, the exemplary embodiments apply graphical techniques of information display in consistent, systematic and integrated ways to make it less disorienting for users to get multiple perspectives and frames of reference on the data and relationships being displayed.

Problems solved by technology

Such conventional displays fail to give people enough context and perspective to allow them to take full advantage of the data.
Despite these recent innovations, however, methods for selecting an appropriate data visualization metaphor, from among all the possibilities, to meaningfully convey complex sets of data relationships to a human have not been developed beyond relatively simple relationships.
These general-purpose approaches, and more recent work, have not significantly extended the field beyond matching of relatively simple relations and data types with appropriate chart types.
Wehrend and Lewis acknowledged the limitations of these elemental approaches by observing that “real problems nearly always involve many kinds of objects and multiple user goals” [4, p.
141] and note that complex real-world problems often need be broken into sub-problems, which can not easily be recombined into integrated, consistent views of a complex situation.
Still, difficulties remain for people wishing to gain a clear and consistent understanding of contextualized information relevant to everyday decisions and business problems.
Even in this relatively simple example, the units of currency, time, and uncertainty, combined with a range of possible outcomes, create a situation that will be difficult for many people to understand via tabular or conventional / elemental graphic representations (bar chart, scatter plot etc.).
In other cases, the sheer volume of information is so overwhelming—100,000 matches to an internet search query, for example, or tens of thousands of things for sale on an online auction site that match a selected keyword—that to find the thing one is looking for, and which one suspects is out there, requires endless scrolling and visual scanning, often to no avail.
While this has helped eliminate many egregious usability difficulties in user-interface (UI) design, these approaches have disappointingly failed to help designers come up with more effective models for interacting with information.
The movement has lately been criticized for stifling innovation in the UI and “blinkering designers' views of possible solutions.”

Method used


Image

  • System and method for systematically arranging a set of display elements in assemblages to meaningfully represent data
  • System and method for systematically arranging a set of display elements in assemblages to meaningfully represent data
  • System and method for systematically arranging a set of display elements in assemblages to meaningfully represent data

Examples


Embodiment Construction

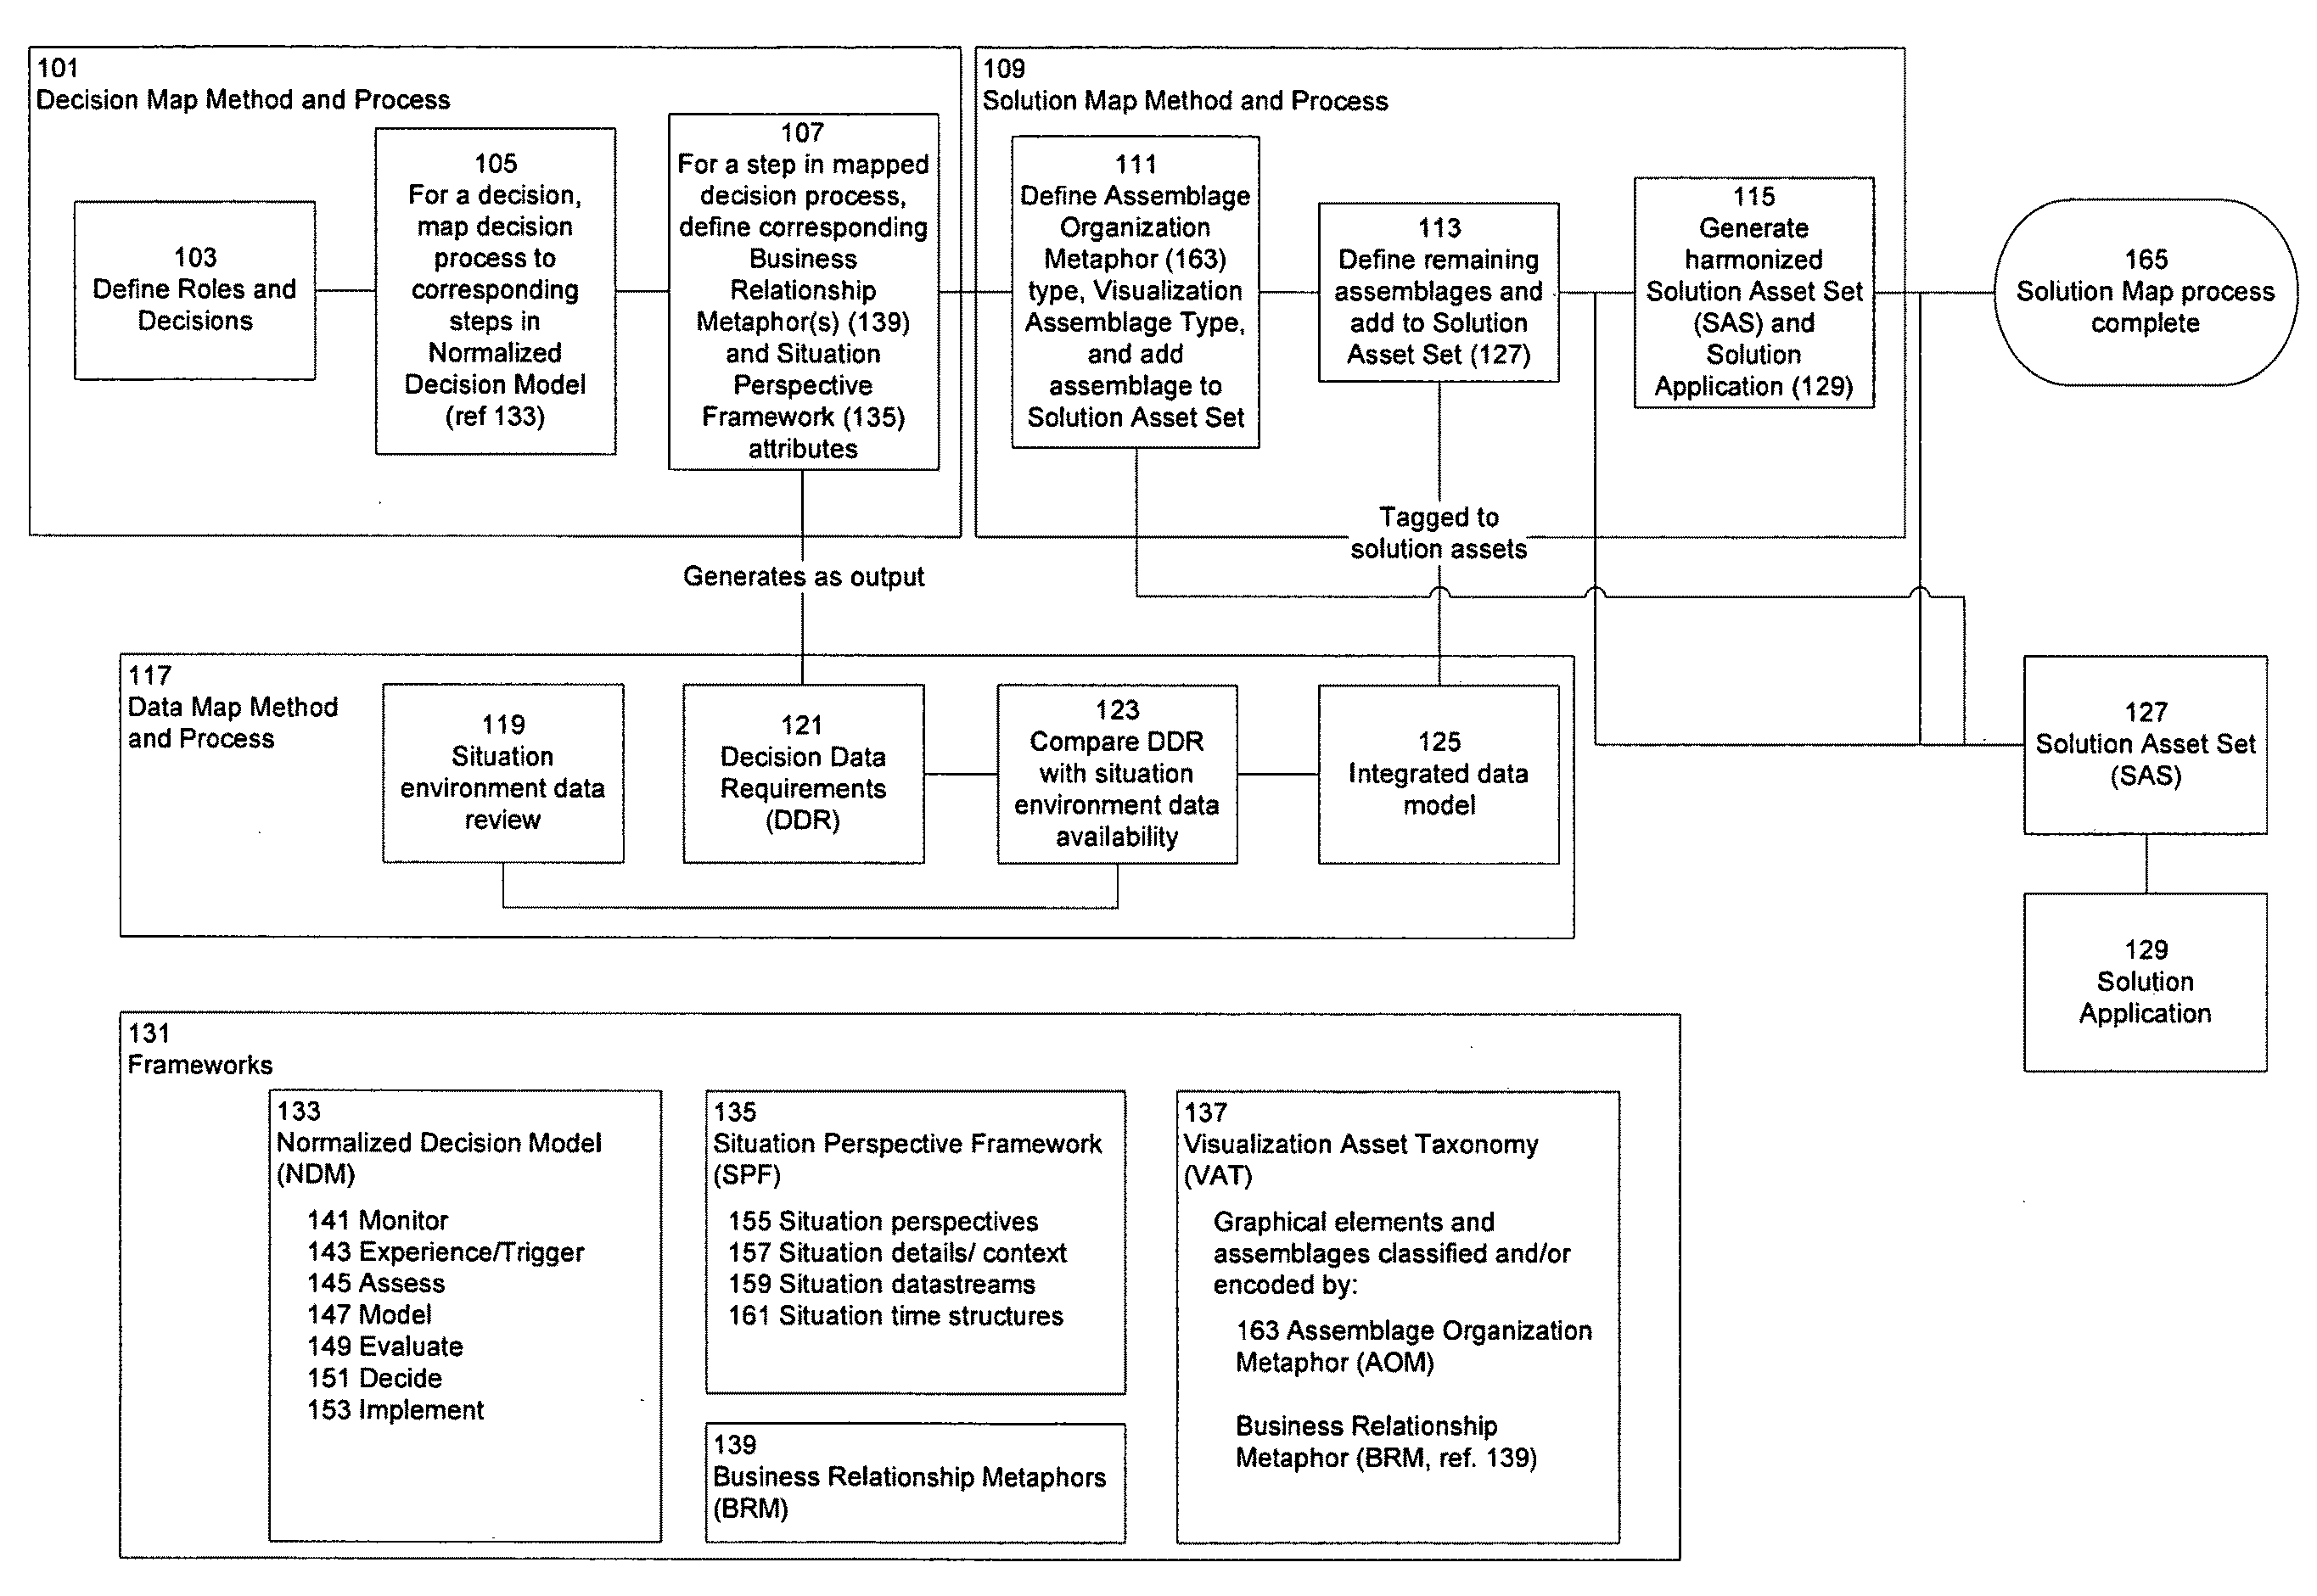
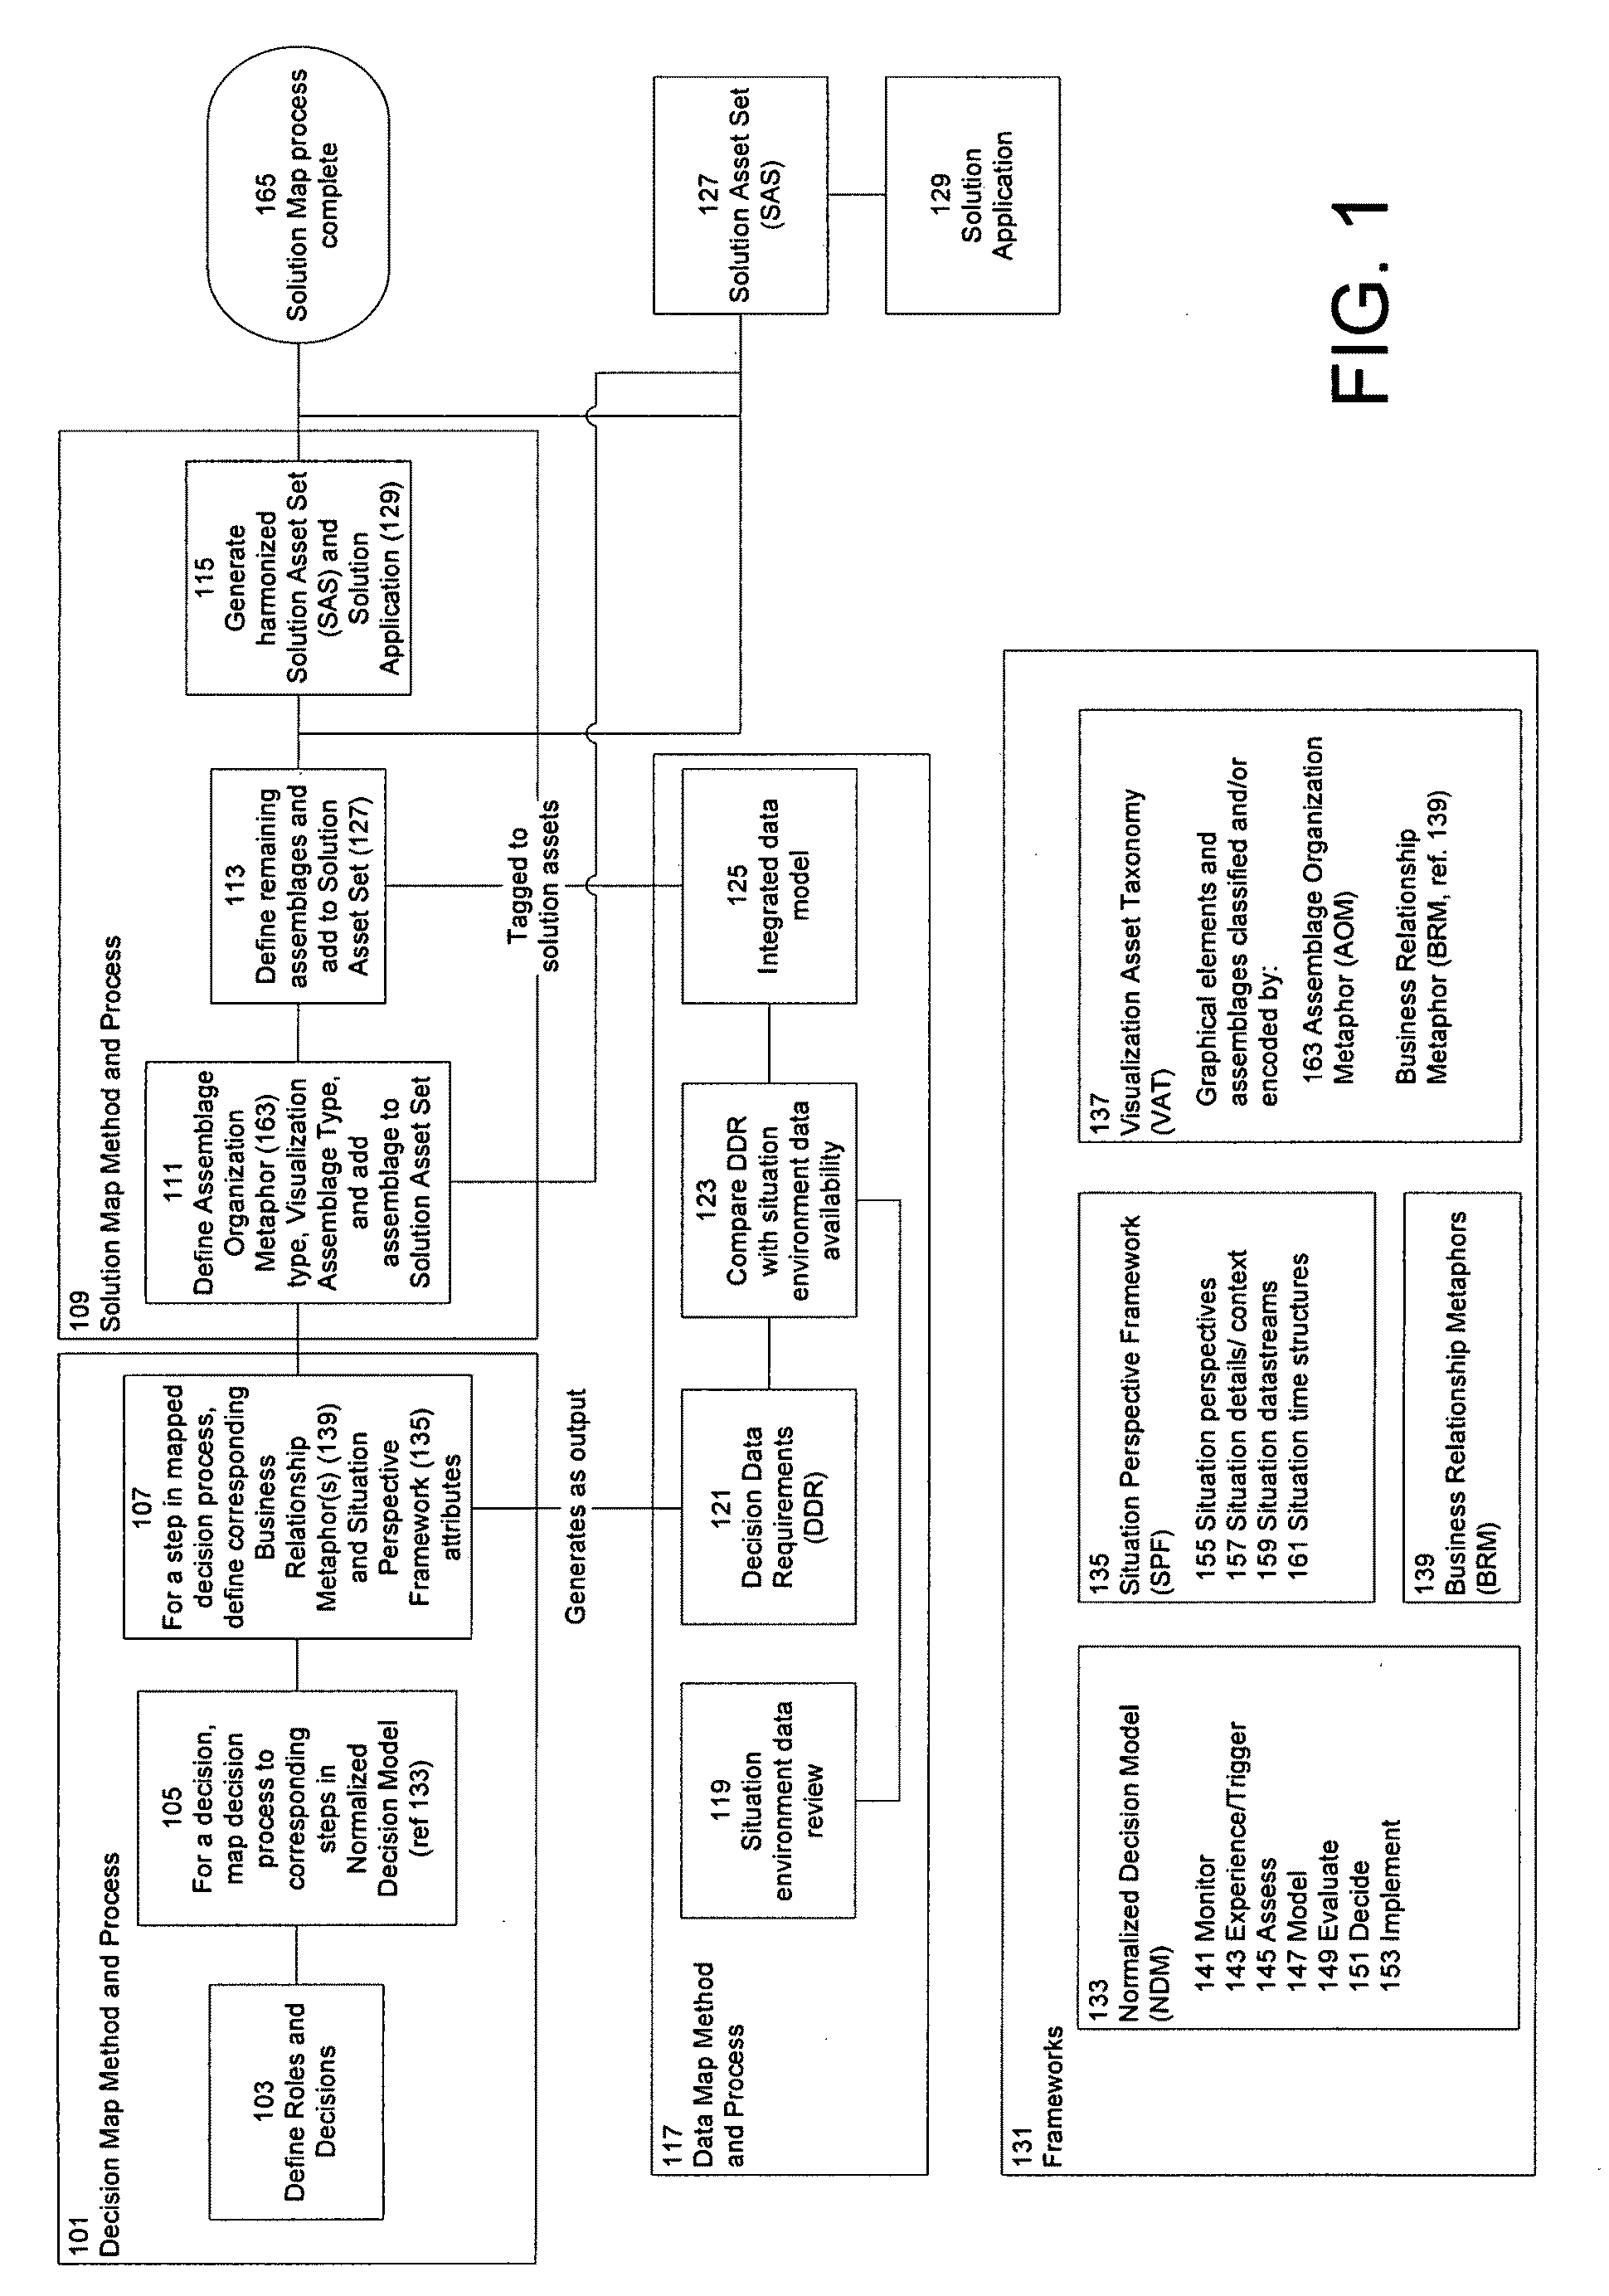
[0099]Referring now to the drawings, wherein like reference numerals designate identical or corresponding parts throughout the several views, and more particularly to FIG. 1 thereof, there is illustrated an exemplary overview of the processes, methods and frameworks comprising the invention according to an exemplary embodiment. In FIG. 1, four frameworks are provided within element 131:

[0100]Visualization Asset Taxonomy, or VAT, (element 137) comprising groups of graphical elements arranged in different layouts and formats, each such assemblage classified along at least two dimensions: (1) layout type (“Assemblage Organization Metaphor,” or AOM, ref 163), and (2) relationship metaphor (“Business Relationship Metaphor,” or BRM, ref 139). Each assemblage may be further specified by attributes of the situation being studied. Those attributes are described in the Situation Perspective Framework (SPF, see below). Assemblages may be encoded with method(s) that describe the behavior (e.g.,...


PUM


Abstract

A system, method and computer program for creating a software application specification, including arranging graphical elements to form assemblages including information displays of the graphical elements. The assemblages are classified along a layout type dimension, and a relationship metaphor dimension, are specified by attributes of a situation being studied, and are respectively associated so as to describe a behavior of the graphical elements, a software application specification is generated based thereon. Further embodiments display graphical elements, corresponding to a feature set based on a matrix, a list, a collection, a curve, a timeflow, a sequence flow, a relationship, a map, a stack or a control and a feature set based on a situation of interest, a goal, a plan, a comparison, an evaluation, a conceptual aid, a qualifier, an action, an alert or an alarm, in a consistent manner to represent information in a form useful for decision-making or problem-solving.

Description

CROSS REFERENCE TO RELATED DOCUMENTS[0001]The present invention claims benefit of priority to U.S. Provisional Patent Application Ser. No. 60 / 609,824 to Mark SCHINDLER, entitled “METHOD AND APPARATUS FOR COMPILING AND DISPLAYING DATA,” filed Sep. 15, 2004, and to U.S. Provisional Patent Application Ser. No. 60 / 617,194 to Mark SCHINDLER, et al., entitled “DECISIONCORE,” filed Oct. 12, 2004, the entire disclosures of all of which are hereby incorporated by reference herein.BACKGROUND OF THE INVENTION[0002]1. Field of the Invention[0003]The present invention generally relates to the field of computer graphics displays, and more particularly to a method and system for creating information system user interfaces that graphically display data in ways that are meaningful and useful. The present invention can employ technologies as referenced throughout the specification with numerals in brackets [ ] and listed and as cross-referenced in the LIST OF REFERENCES, the entire disclosures of all...

Claims


Application Information

Patent Timeline
Patent Type & Authority Applications(United States)
IPC IPC(8): G06F3/048G06F9/44
CPCG06F8/10
Inventor SCHINDLER, MARK BYRONSHEN-HSIEH, ANGELA BARBARALISTFIELD, SCOTT
Owner VISUAL I O
Why Eureka
Try Eureka