Optical analysis system and elements to isolate spectral region

an analysis system and optical technology, applied in the field of optical analysis systems and elements to isolate spectral regions, can solve the problems of unacceptably inaccurate estimation, inability to accurately measure the data relating to one, and difficult to convert simple light intensity measurement to information, etc., to achieve the effect of minimizing the band-edge

Active Publication Date: 2009-09-03
HALLIBURTON ENERGY SERVICES INC
View PDF4 Cites 64 Cited by
  • Summary
  • Abstract
  • Description
  • Claims
  • Application Information

AI Technical Summary

Benefits of technology

[0047]The method may further include selecting the spectral element for a detector, the spectral element being configured to minimize a band-edge effect in the spectral region of interest.

Problems solved by technology

In general, a simple measurement of light intensity is difficult to convert to information because it likely contains interfering data.
It is often impossible to adequately measure the data relating to one of these factors since the contribution of the other factors is unknown.
Depending on the circumstances, however, the estimate may be unacceptably inaccurate since factors other than ethylene may affect the intensity of the wavelength bands.
Unfortunately, however, charge couple devices and their required operational instrumentation are very expensive.
Furthermore, the devices are sensitive to environmental conditions.
The power requirements, cooling requirements, cost, complexity and maintenance requirements of these systems have made them impractical in many applications.

Method used


Image

  • Optical analysis system and elements to isolate spectral region
  • Optical analysis system and elements to isolate spectral region
  • Optical analysis system and elements to isolate spectral region

Examples


example 1

[0103]The breadboard system 210 introduced above with respect to FIG. 6 was used to measure concentrations of various sample mixtures. The system 210 was configured based on the mixture being tested. An exemplary configuration of the system 210 included:

[0104]Illumination: 20 w GILWAY lamp

[0105]Spectral elements: 5 mm deuterium oxide (D2O), 5 mm Germanium

[0106]Optical window: fiber optic probe

[0107]Detector: InAr detector from Judson

[0108]MOE: specific to test

example 2

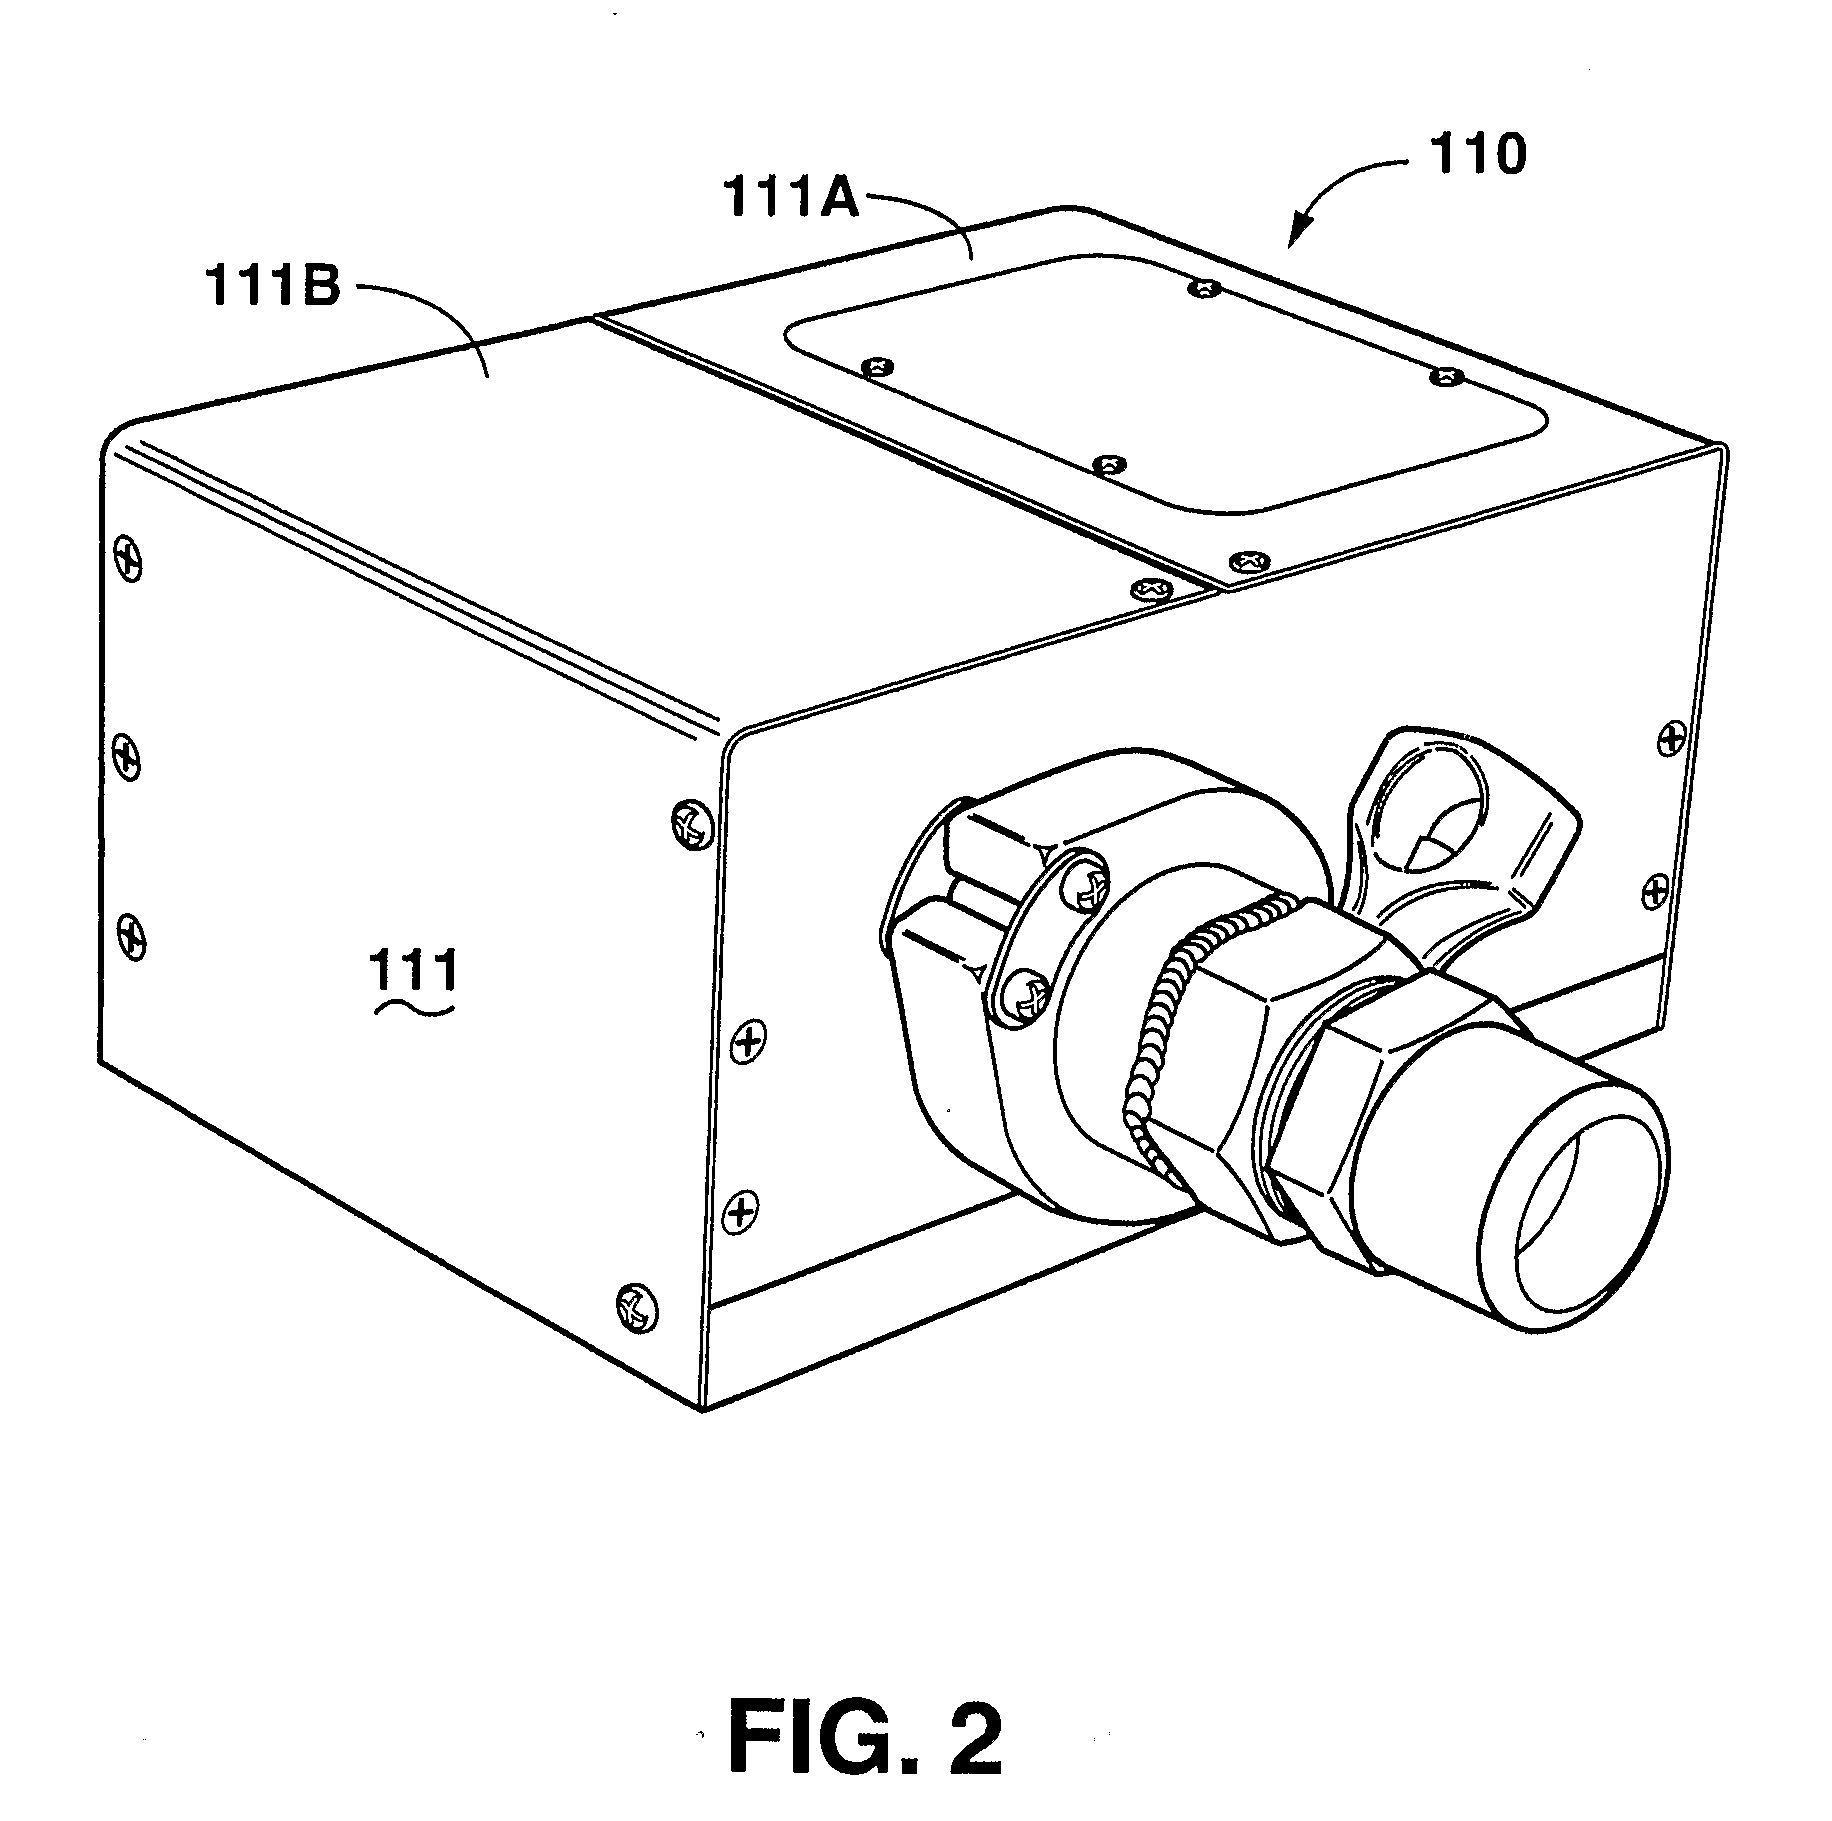
[0109]The system 110 introduced above with respect to FIG. 2 was used to make measurements on a mixture of aspirin and lactose as well as various other sample mixtures. The system 110 was configured based on the mixture being tested. The aspirin / lactose testing was performed using static testing in which the powdered sample with a known composition was placed in a dish and the system light beam was focused on the powdered sample. The output of the detectors was monitored and recorded. The aspirin / lactose samples covering the range of 100% aspirin to 100% lactose were tested. An exemplary configuration of the system included:

[0110]Illumination: 20 w GILWAY lamp

[0111]Spectral elements: 5 mm D2O, 5 mm Germanium

[0112]Optical window: none

[0113]Detector: PbS detector from New England Photoconductor

[0114]MOE: specific to test conditions

example 3

[0115]The system 110 was used again to make measurements on a mixture of aspirin and lactose. The system 110 was configured based on the mixture being tested. The aspirin / lactose testing was performed using dynamic conditions in which the lactose powder was placed in the bowl of a mixer and the measurement system was attached to the bowl using a Swagelok® brand connector / fitting. A sapphire window was used to contain the powder in the bowl and allow the system 110 to interrogate the powder. With the mixer turning, known amounts of aspirin were added and the system output signal was monitored and recorded. Aspirin was added in several allotments to about 37% final aspirin concentration. The configuration of the system 110 used in this example included:

[0116]Illumination: 20 w Gilway lamp

[0117]Spectral elements: 5 mm D2O, 5 mm Germanium

[0118]Optical window: sapphire window

[0119]Detector: PbS detector from New England Photoconductor

[0120]MOE: specific to test conditions

EXAMPLE b 4

[0121...


PUM


Abstract

A method of selecting components for a multivariate optical computing and analysis system to isolate a spectral region includes selecting a spectral region of interest; selecting a spectral element with a predetermined transmission characteristic to control a spectral range of an illumination source; illuminating a sample with the illumination source; and analyzing an optical frequency returned by the sample relative to the spectral region of interest.

Description

CROSS-REFERENCE TO RELATED APPLICATIONS[0001]This application claims benefit of and priority to U.S. Provisional Patent Application, Ser. No. 60 / 740,179, and U.S. Provisional Patent Application, Ser. No. 60 / 740,180, both filed Nov. 28, 2005 and both incorporated herein by reference in their entireties.BACKGROUND OF THE DISCLOSURE[0002]Light conveys information through data. When light interacts with matter, for example, it carries away information about the physical and chemical properties of the matter. A property of the light, for example, its intensity, may be measured and interpreted to provide information about the matter with which it interacted. That is, the data carried by the light through its intensity may be measured to derive information about the matter. Similarly, in optical communications systems, light data is manipulated to convey information over an optical transmission medium, for example fiber optic cable. The data is measured when the light signal is received to...

Claims


Application Information

Patent Timeline
Patent Type & Authority Applications(United States)
IPC IPC(8): G01J3/00
CPCG01J3/02G01J3/0205G01J3/021G01J3/0232G01J3/0291G01J3/08G01N21/3577G01J3/36G01N21/274G01N21/35G01N21/3504G01N21/3563G01J3/28
Inventor MYRICK, MICHAEL L.FREESE, ROBERT P.PROFETA, LUISAJAMES, JONATHAN H.BLACKBURN, JOHN C.PRIORE, RYAN J.
Owner HALLIBURTON ENERGY SERVICES INC
Why Eureka
Try Eureka