Chromosomal Blocks as Markers for Traits

a technology of chromosomal blocks and markers, applied in the field of linkage disequilibrium unit maps and methods for predicting phenotypes, can solve the problems of large variance in ld between markers across the genome, significant variation, and complex structure of human ld structure, and achieves large variance in ld between markers irrespective of the linkage disequilibrium unit map

Inactive Publication Date: 2009-10-01
INNOVATIVE DAIRY PRODS TRUSTEE FOR THE PARTICIPANTS OF THE COOP RES CENT FOR INNOVATIVE DAIRY PRODS
View PDF0 Cites 2 Cited by
  • Summary
  • Abstract
  • Description
  • Claims
  • Application Information

AI Technical Summary

Benefits of technology

[0030]In particular embodiments, the breeding worth of an animal reflected by genetic merit, phenotype, and p...

Problems solved by technology

The LD structure in humans has been found to be quite complex, with significant variation between populations and genomes.
This has led to many problems including spurious results when using LD methods in genome mapping studies.
A major problem is the large variance in LD between markers across the genome irrespective of physical distance.
When using these haplotypes to map and track QTNs/QTLs, spurious results may emerge due to the lack of information of true haplotype boundaries and LD structure.
However, in other species where les...

Method used


Image

  • Chromosomal Blocks as Markers for Traits
  • Chromosomal Blocks as Markers for Traits
  • Chromosomal Blocks as Markers for Traits

Examples


example 1

Methods and Materials

1.1 DNA Samples and Selection of Bulls

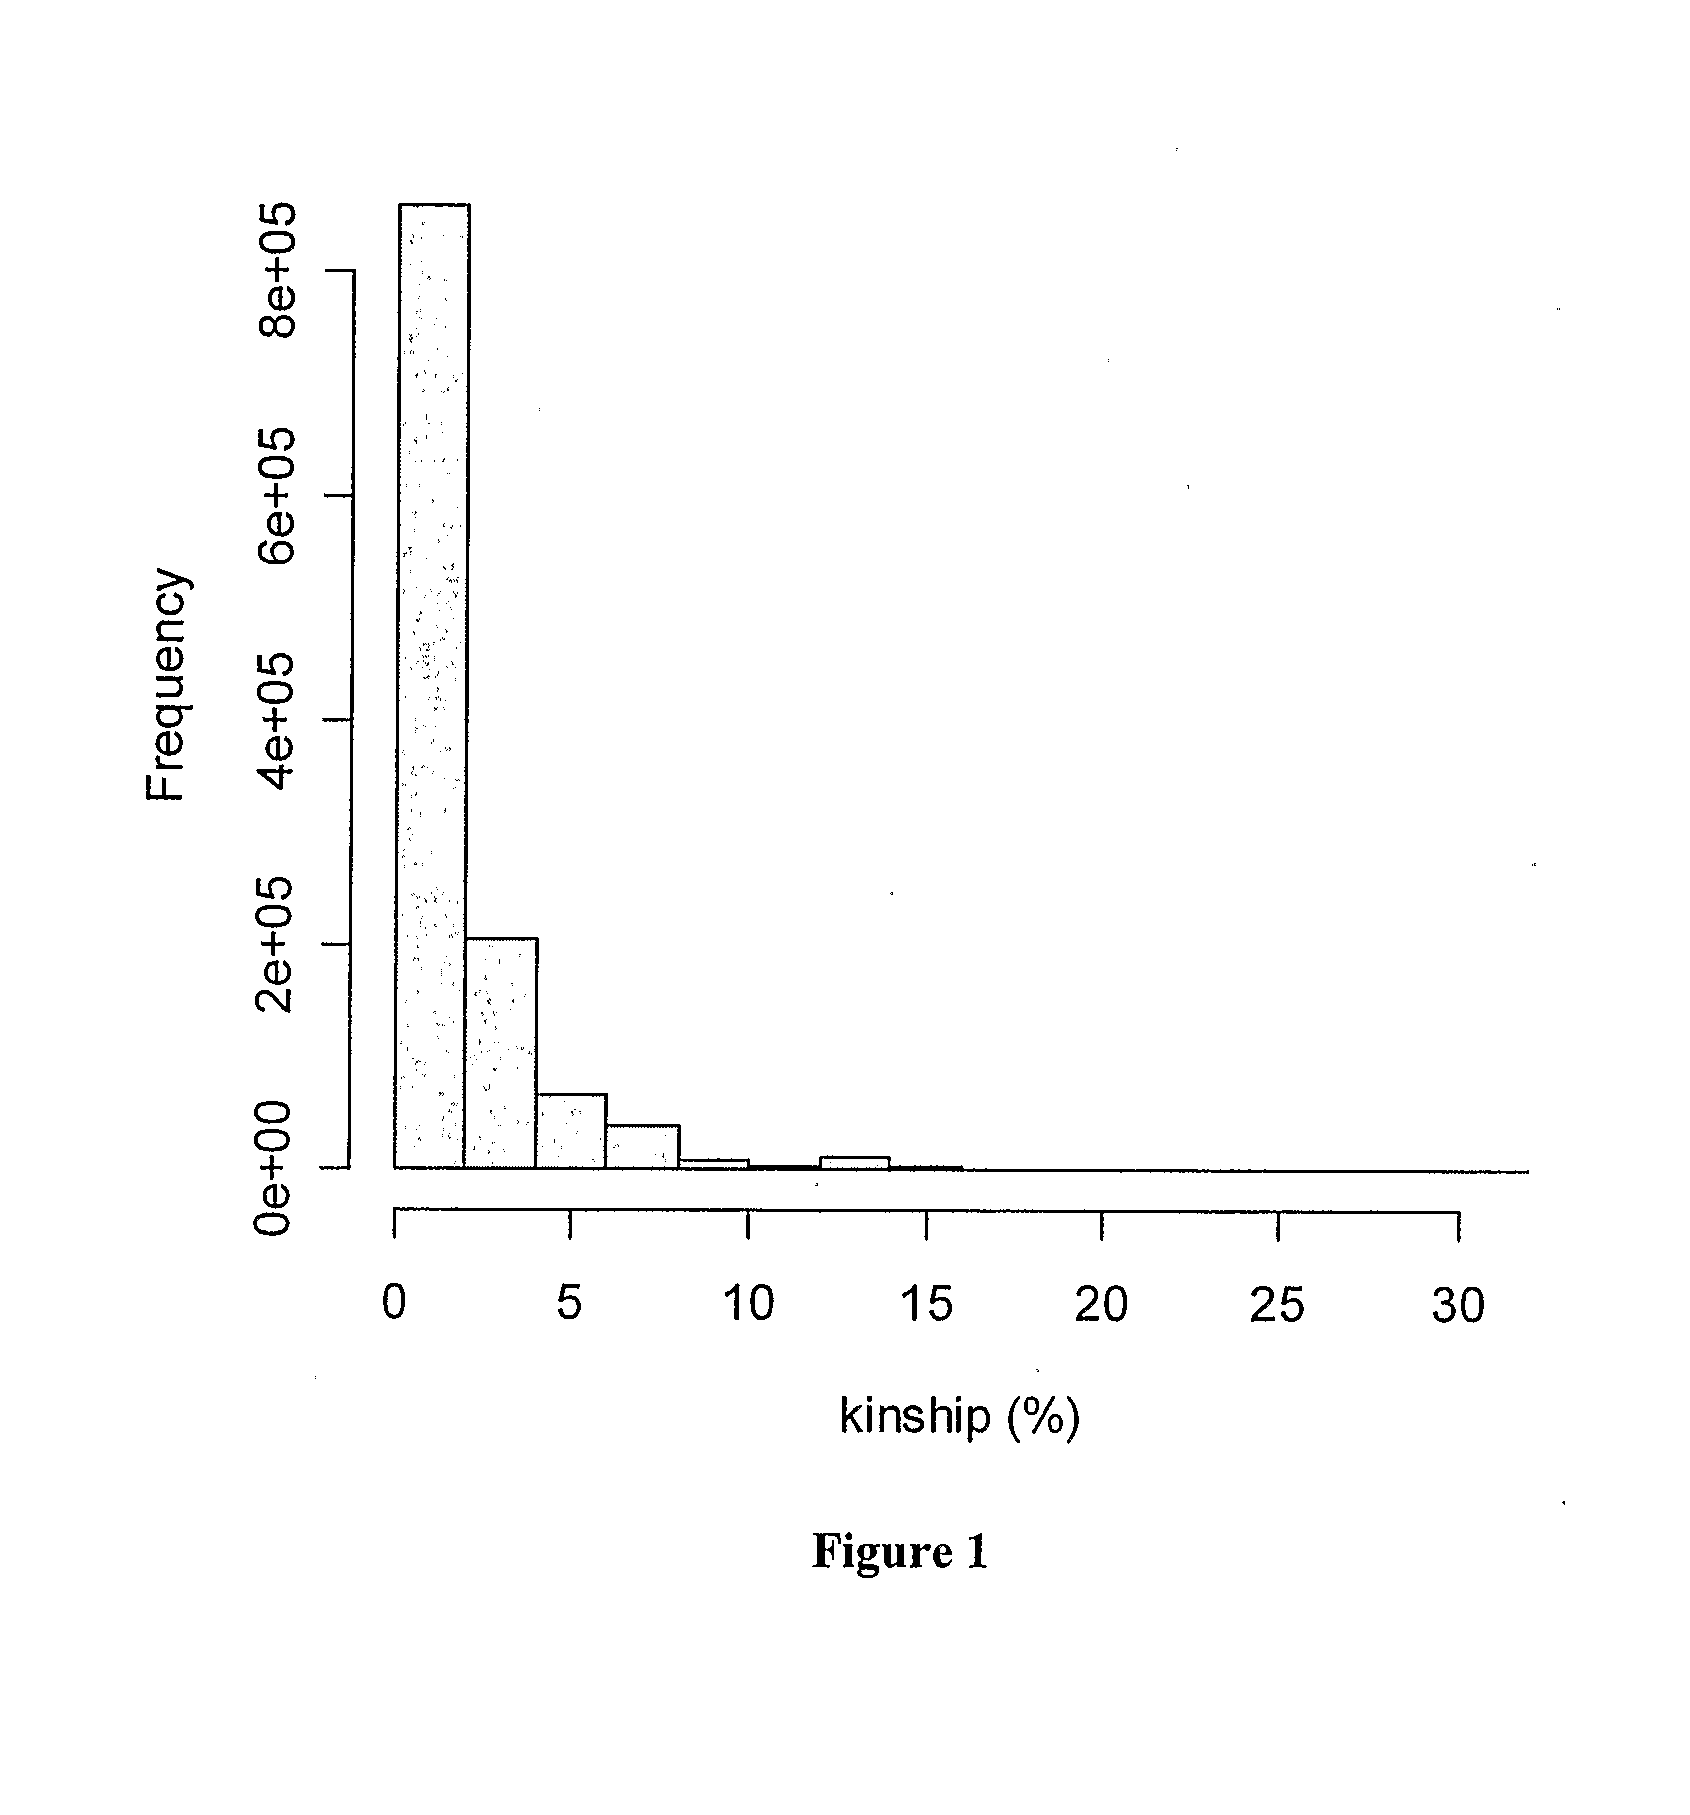
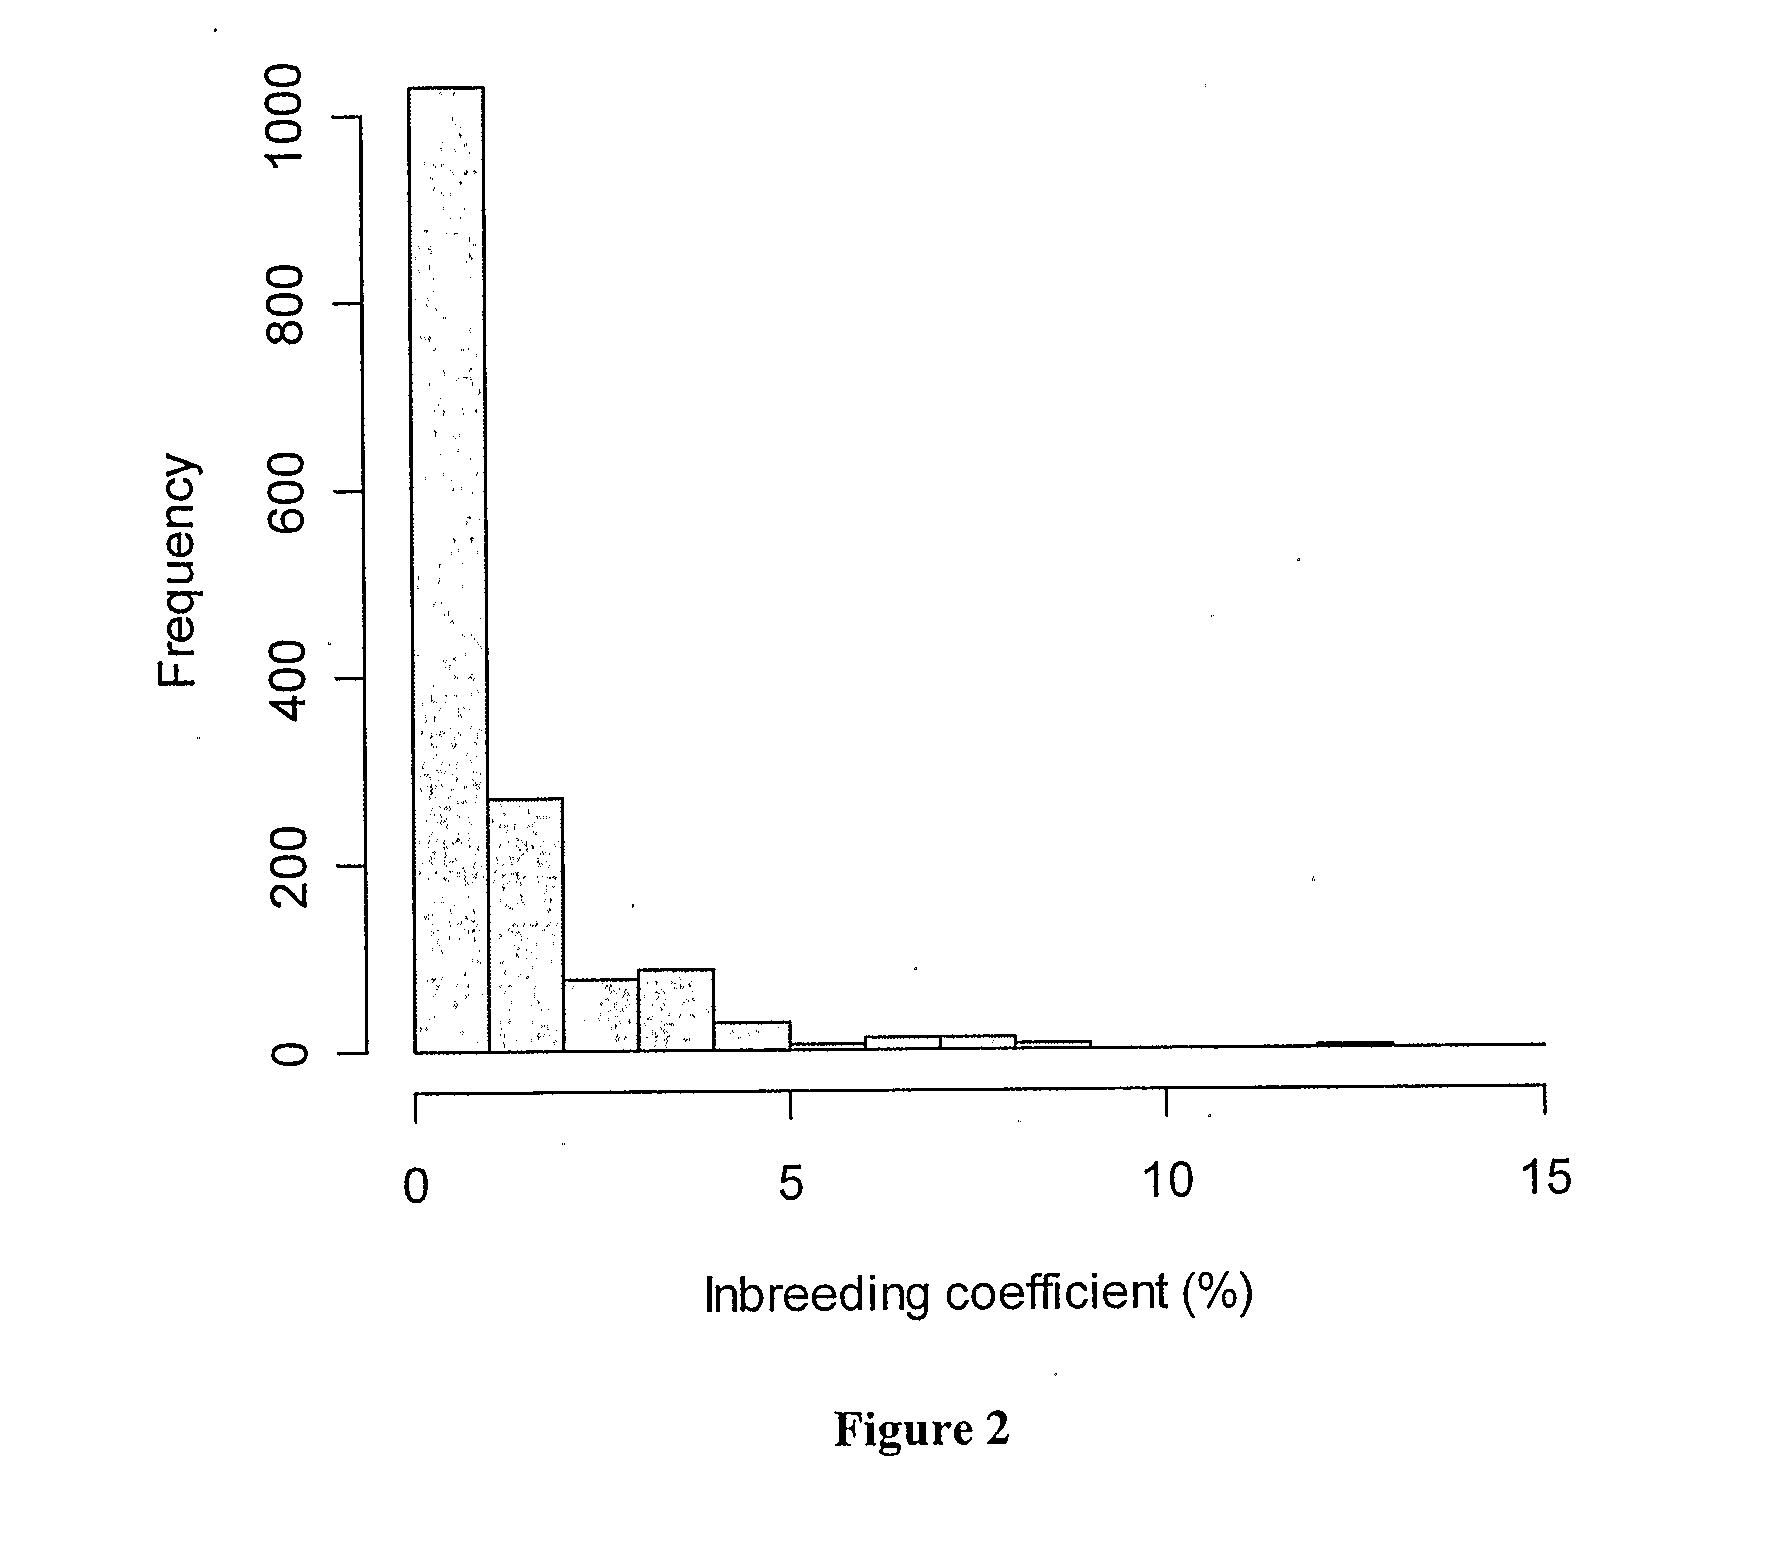
[0058]A panel of 1,546 Holstein Friesian bulls born between 1955 and 2001 was selected for genotyping. Most of these bulls were born in Australia (1,435) with smaller numbers being born in USA (53), Canada (35), New Zealand (8), Netherlands (8), Great Britain (3), France (3) and Germany (1). There were more bulls from the recent cohorts than from older cohorts. This panel of bulls represents near-to-normal distributions for Australian Breeding Values (ABVs) for the most common production traits recorded through the Australian Dairy Herd Improvement Scheme (ADHIS; http: / / www.adhis.com.au / ). From ADHIS pedigree information (http: / / www.adhis.com.au / , ADHIS Pty. Ltd, Level 6 84 William Street, Melbourne 3000 Victoria Australia) and using FORTRAN programs in the PEDIG package of D. Boichard (http: / / dga.jouy.inra.fr / sgqa / diffusions / pedig / pedigE.htm), kinship (coefficient of coancestry) was calculated for each pairwise combinations...

example 2

Development of LD Maps for BTA-1 to BTA-29

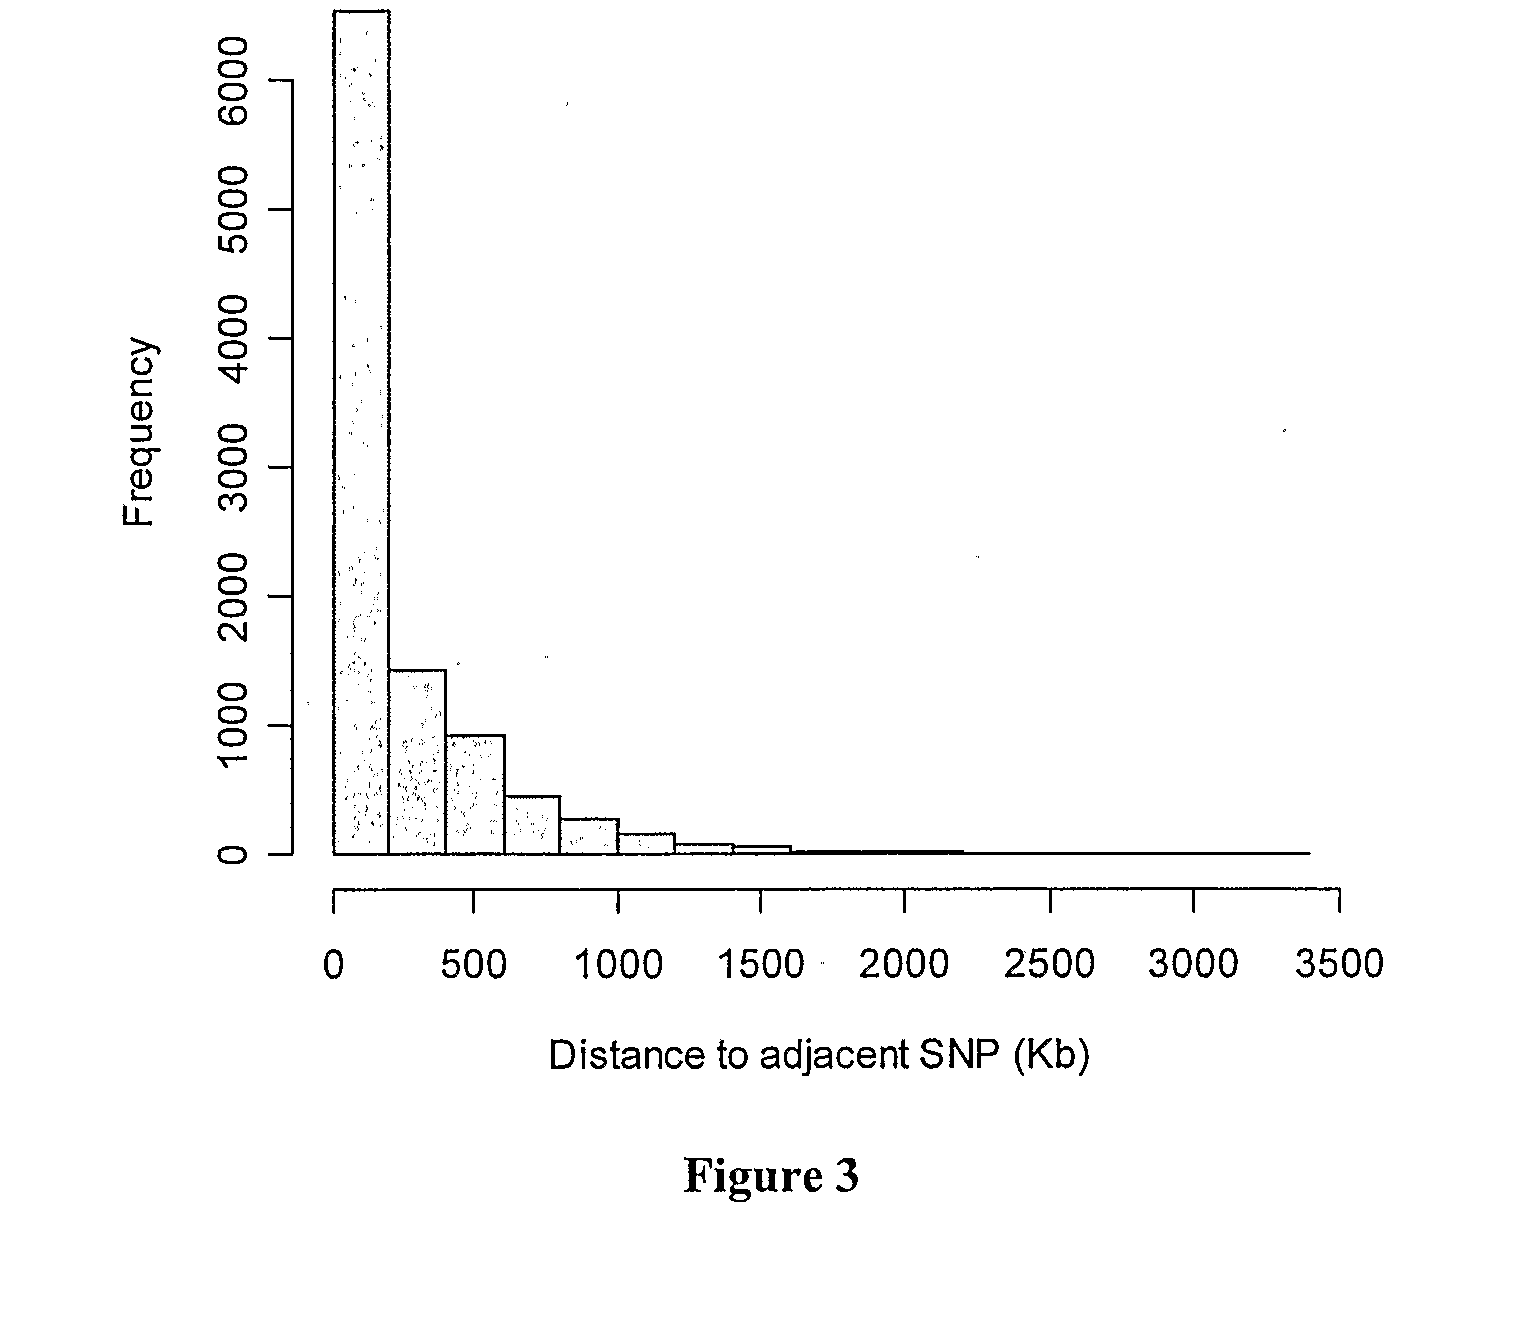
[0082]Of the 15,036 SNPs which were genotyped, 13,049 (87%) were polymorphic (minor allele frequency (MAF)>0) in the bulls included in this study. A further 1,776 (14% of the biallelic) SNPs had less than 0.05 MAF. Of the polymorphic SNPs on the autosomes, 824 (7.0%) showed deviation from Hardy-Weinberg Equilibrium (P<0.0001), and were excluded from this analysis. The SNPs (232) typed in less than 50% of animals were also removed from the analysis. Of the remaining SNPs, 9,195 were able to be located on autosomes in the bovine sequence assembly Btau 3.1 and were included in the present analysis. Of these, 7,057 (77%) of SNPs are from the MegAllele 10 k SNP panel and 2,138 (23%) from the custom SNP panel. The number of SNPs on chromosomes varied from 158 on BTA-27 to 528 on BTA-1. The average inter-marker spacing for the entire genome was 251.8±4.0 kb with a median spacing of 93.9 kb. The distribution of SNP spacing over the genome is shown i...

example 3

Structure of LD Along Bovine Chromosomes BTA-1 to BTA-29

[0085]A total of 204 LD blocks with tracts of consecutive intervals spanning one LDU were observed along bovine chromosomes. These LD blocks collectively cover all of the chromosomes with a mean LD block size of 13 MB. The location of these blocks is set out in Table 1.


PUM

PropertyMeasurementUnit
Fractionaaaaaaaaaa
Fractionaaaaaaaaaa
Fractionaaaaaaaaaa

Abstract

The present invention provided a method for predicting a phenotype in a bovine animal, the method comprising analysing a nucleic acid sample from said animal for the presence of at least one genetic marker known to reside in an Linkage Disequilibrium (LD) block in any one of bovine chromosomes BTA-I to BTA-29, wherein said LD block is associated with said phenotype. The phenotype can be Australia profit ranking (APR), Australian selection index (ASR), protein yield (PROT), protein percent (PROT %), milk volume (MILK), fat yield (FAT), fat percent (FAT %), breeding value overall type (Overall Type), somatic cell count (SCC), and/or breeding value cow fertility (Cow Fertility). Also provided is a linkage disequilibrium unit (LDU) map of any one or more of bovine chromosomes BTA-I to BTA-29, the map comprising a plurality of chromosomal regions, and the regions defined by their co-inheritance across generations substantially as entire linkage disequilibrium (LD) blocks.

Description

TECHNICAL FIELD[0001]The present invention relates to linkage disequilibrium unit maps and methods for predicting phenotypes as traits in domestic animals. In particular, the present invention relates to predicting phenotypes based upon the association of chromosomal linkage disequilibrium blocks with traits.BACKGROUND[0002]Population-wide association studies using a high density of genetic markers provide a powerful means for identifying common genetic variants that underlie complex traits. To be useful, markers tested for associations must be either the causal allele, the so-called quantitative trait nucleotide (QTN) or quantitative trait locus (QTL), or highly correlated (in linkage disequilibrium) with the QTN / QTL.[0003]Linkage disequilibrium (LD) describes a situation in which some combinations of alleles of two or more different loci (haplotypes) occur more or less frequently within a population than would be expected by random chance alone. Information on the structure of LD ...

Claims


Application Information

Patent Timeline
IPC IPC(8): C12Q1/68C07H21/04
CPCC12Q1/6883C12Q2600/124C12Q2600/156
Inventor KHATKAR, MEHAR SINGHRAADSMA, HERMANUS WILLEM
Owner INNOVATIVE DAIRY PRODS TRUSTEE FOR THE PARTICIPANTS OF THE COOP RES CENT FOR INNOVATIVE DAIRY PRODS
Why Eureka
Try Eureka