Fluorescent signal analyzing apparatus and fluorescent signal analyzing method

a fluorescence signal and fluorescent signal technology, applied in the field of optical signal analysis apparatus and optical signal analysis method, can solve the problems of inability to observe the behavior or interaction of living cells on the time axis, and the image of fluorescence intensities at the spatial positions alone does not enable the observation of changes

Active Publication Date: 2009-10-08
OLYMPUS CORP
View PDF2 Cites 68 Cited by
  • Summary
  • Abstract
  • Description
  • Claims
  • Application Information

AI Technical Summary

Problems solved by technology

It is therefore impossible to observe the behavior or interaction of living cells on the time axis.
That is, the image of the fluorescence intensities at the spatial position

Method used


Image

  • Fluorescent signal analyzing apparatus and fluorescent signal analyzing method
  • Fluorescent signal analyzing apparatus and fluorescent signal analyzing method
  • Fluorescent signal analyzing apparatus and fluorescent signal analyzing method

Examples


first embodiment

FCS / FCCS by Extracted Data for the Same Desired Region

[0022]The present embodiment provides a technique for an analysis by extracting data at the same spatial position from data for a plurality of fluorescent images of a sample.

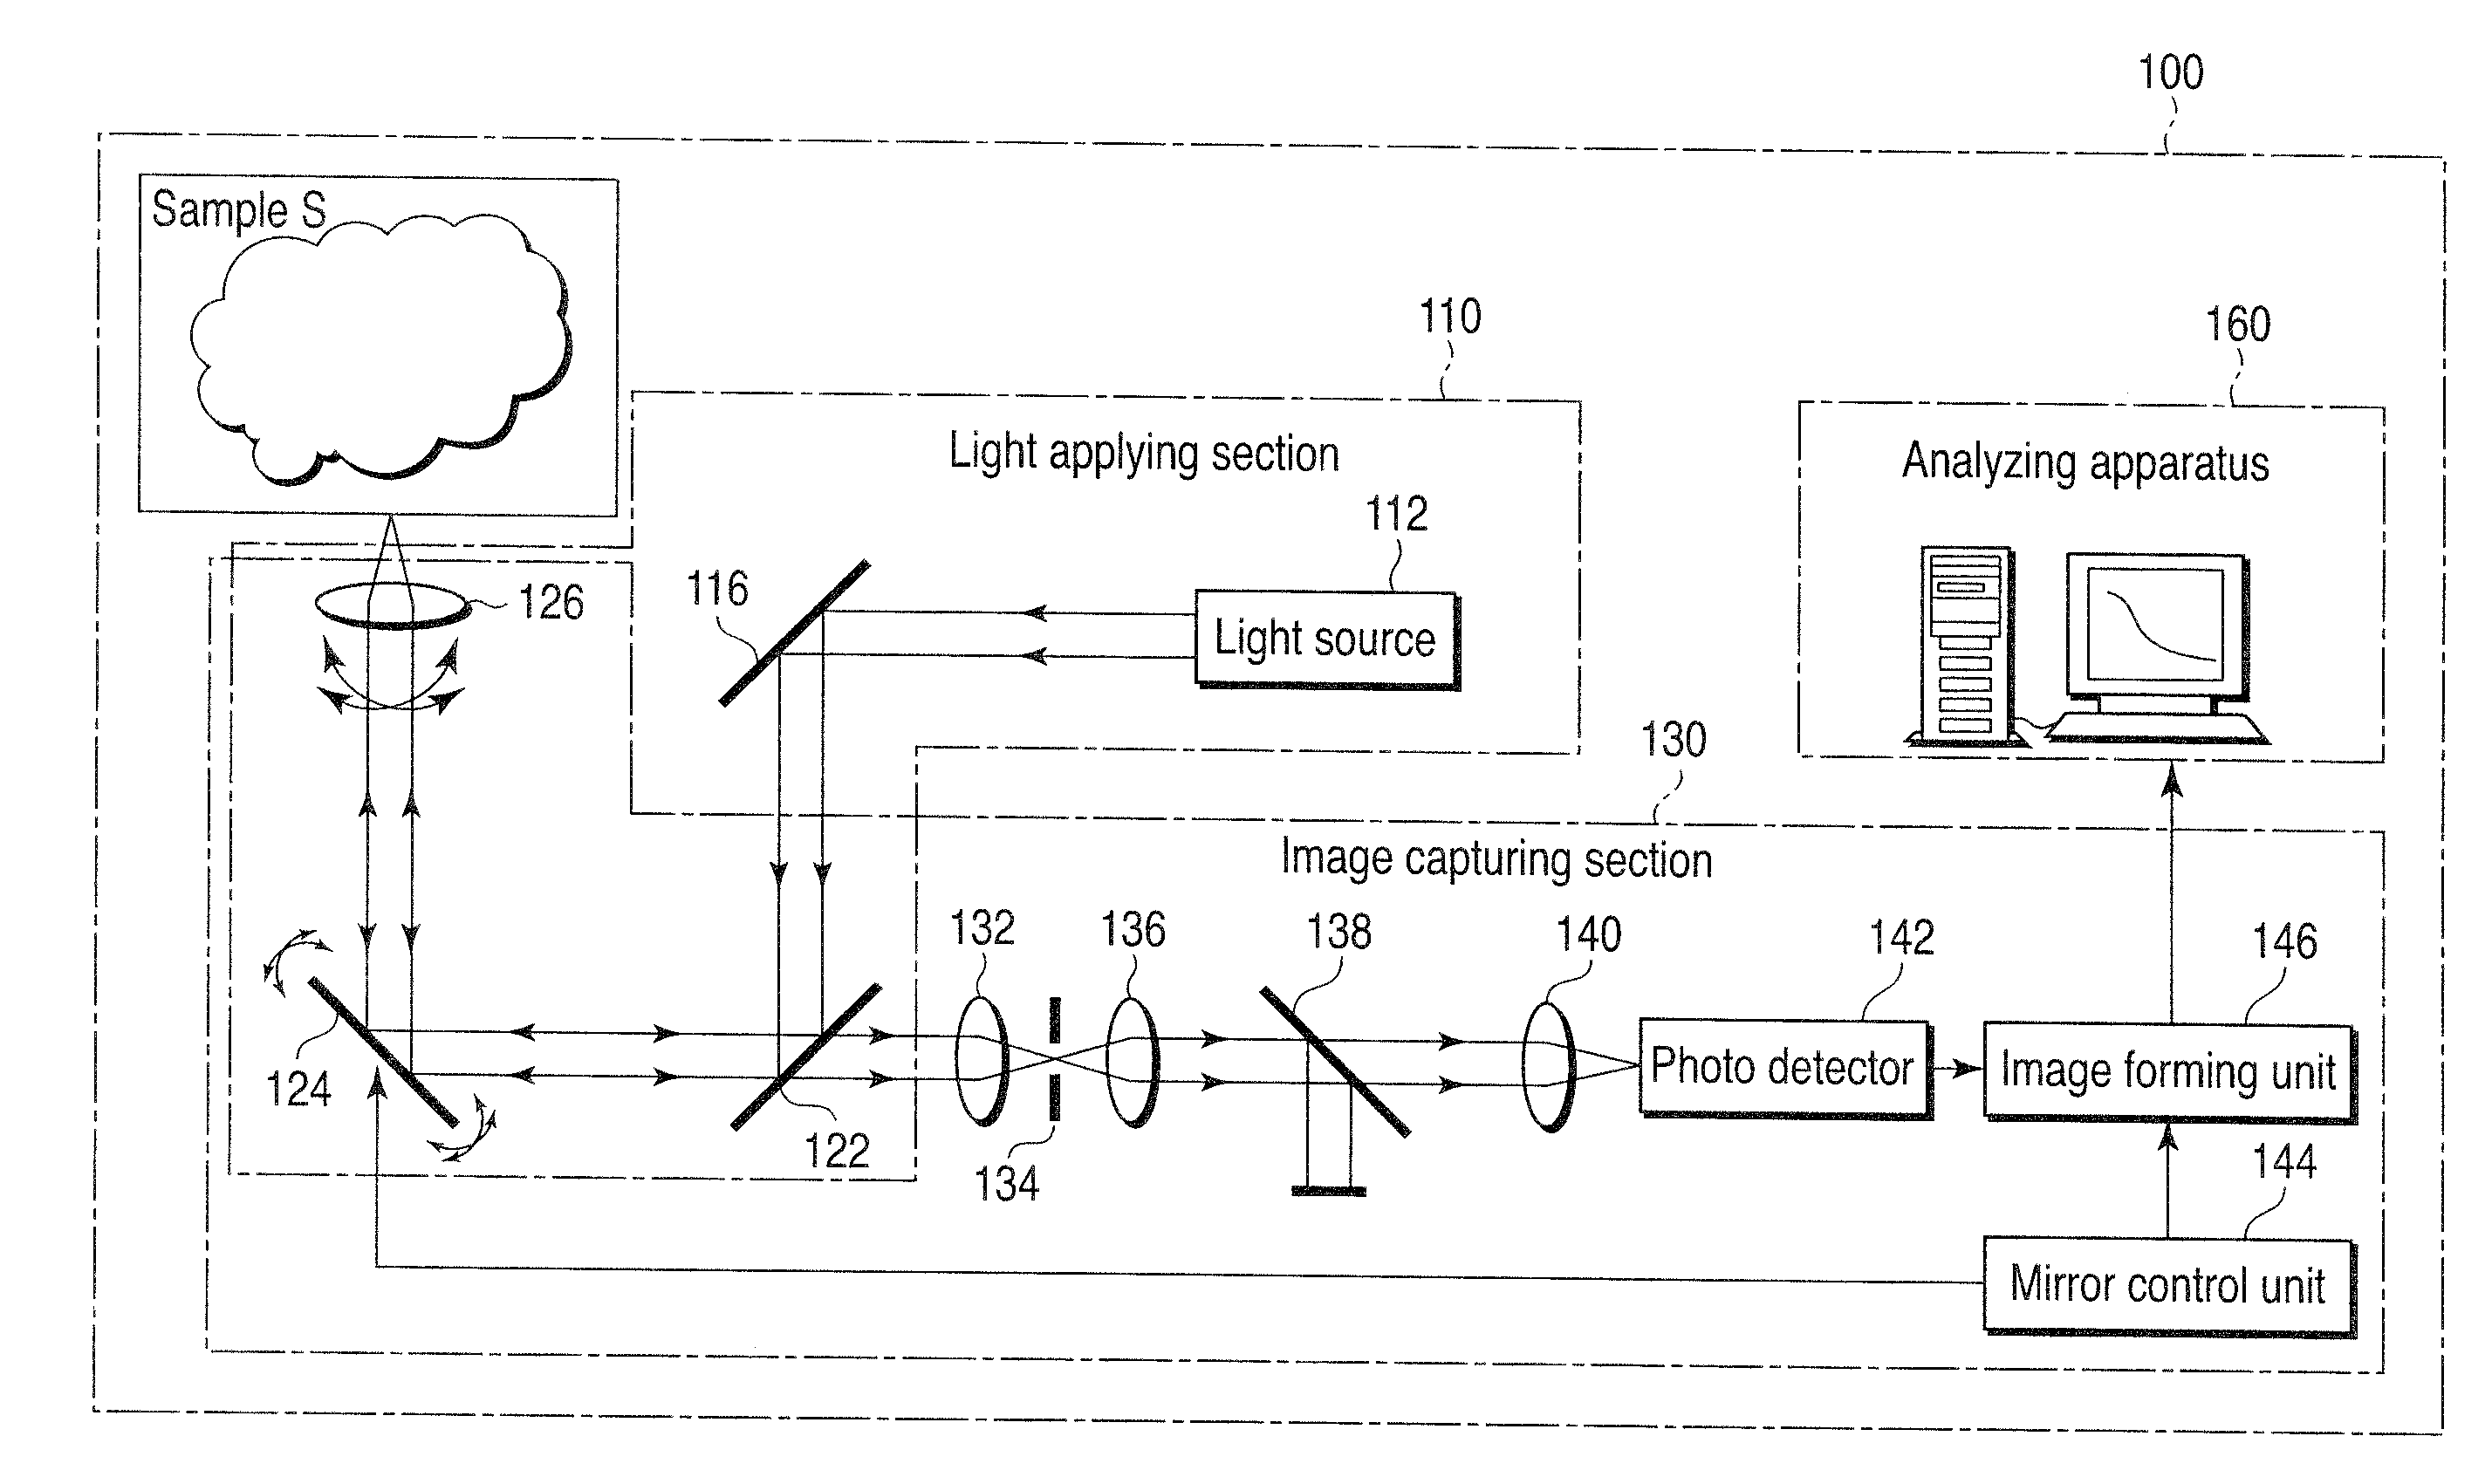
[0023]FIG. 1 schematically shows an optical signal analyzing system according to a first embodiment of the present invention. As shown in FIG. 1, an optical signal analyzing system 100 includes a light applying section 110 to apply excitation light to a sample S, an image capturing section 130 to repetitively capture fluorescent images of the sample S at predetermined time intervals, and an analyzing apparatus 160 to perform an optical signal analysis for the fluorescent images captured by the image capturing section 130.

[0024]The light applying section 110 includes a light source 112, a mirror 116, a dichroic mirror 122, a galvanometer mirror 124, and an objective lens 126. The light source 112 emits the excitation light for exciting fluorescent dyes contain...

second embodiment

FCS / FCCS by Extracted Data for Different Desired Regions

[0061]The present embodiment provides a technique of an analysis by extracting data at different spatial positions from data for a plurality of fluorescent images of a sample.

[0062]An optical signal analyzing system according to the present embodiment is basically the same in configuration as the optical signal analyzing system in the first embodiment. The present embodiment is different in that instead of only extracting data for the same desired region from a plurality of fluorescent images, data for a plurality of specified different desired regions are extracted and correlationally analyzed.

[0063]That is, the present embodiment is the same as the first embodiment in the procedure ranging from the capture to storage of a plurality of fluorescent images.

[0064]However, the main point in the technique of the present embodiment is that the photon counting histogram analyzing method and a correlation analysis method for different...


PUM


Abstract

A fluorescent signal analyzing apparatus includes an image input unit, a storage unit, an extracting unit, and an analyzing unit. At least one fluorescent image of a sample is input to the input unit. The storage unit stores data on the at least one fluorescent image input to the image input unit. The extracting unit extracts, for each of the fluorescent images, data on a fluorescence intensity in a desired region on the at least one fluorescent image from the data on the at least one fluorescent image stored in the storage unit. The analyzing unit calculates at least one of a correlation and a photon counting histogram for the desired region by use of the data on the fluorescence intensity.

Description

CROSS-REFERENCE TO RELATED APPLICATIONS[0001]This is a Continuation Application of PCT Application No. PCT / JP2008 / 050039, filed Jan. 7, 2008, which was published under PCT Article 21(2) in Japanese.[0002]This application is based upon and claims the benefit of priority from prior Japanese Patent Application No. 2007-007280, filed Jan. 16, 2007, the entire contents of which are incorporated herein by reference.BACKGROUND OF THE INVENTION[0003]1. Field of the Invention[0004]The present invention relates to an optical signal analyzing apparatus and an optical signal analyzing method.[0005]2. Description of the Related Art[0006]An optical signal analyzing method using LSM image data has heretofore been disclosed in “Image Correlation Spectroscopy. II. Optimization for Ultrasensitive Detection of Preexisting Platelet-Derived Growth Factor-β Receptor Oligomers on Intace Cells.”, Paul W. Wiseman and Nils o. Petersen, Biophysical Journal, Vol. 76, P 963, 1999. In this document, the LSM imag...

Claims


Application Information

Patent Timeline
IPC IPC(8): G06K9/00
CPCG01N21/6456G01N21/6408
Inventor SUZUKI, AKEMI
Owner OLYMPUS CORP
Why Eureka
Try Eureka