Techniques to Predict Three-Dimensional Thermal Distributions in Real-Time

a technology of thermal distribution and real-time temperature, applied in the field of data centers, can solve the problems of increasing the energy consumption of computing hardware systems installed in data centers, limiting the future growth of the field of information technology, and common undesirable trade-offs

Active Publication Date: 2009-12-31
IBM CORP
View PDF15 Cites 99 Cited by
  • Summary
  • Abstract
  • Description
  • Claims
  • Application Information

AI Technical Summary

Benefits of technology

[0006]The present invention provides techniques for monitoring and predicting environmental operating conditions in a data center. In one aspect of the invention, a method for real-time, three-dimensional analysis of environmental operating conditions in a data center is provided. The method comprises the following steps. High spatial resolution three-dimensional measurements of one or more environmental variables in the data center made at a time t1 are obtained. Real-time measurements of the environmental variables in the data center made at a time t2, wherein t2 is later in time than t1, are obtained. The high spatial resolution three-dimensional measurements are combined with the real-time measurements to derive a model for the environmental variables in the data center at the time t2. The model is used to predict three-dimensional distributions of the environmental variables in the data center at the time t2. The high spatial resolution three-dimensional measurements can be used to create a base model and the base model can be combined with the real-time measurements to derive the model for the environmental variables in the data center at the time t2.

Problems solved by technology

The continuing rise of energy consumption of computing hardware systems installed in data centers combined with the cooling infrastructure required to provide operable conditions for this hardware has emerged as a key limitation for future growth in the field of information technology (IT).
As a result, undesirable tradeoffs commonly must be made between energy / cooling requirements, space limitations and cost constraints on the one hand and increased IT performance on the other.
However, due to the complex physical composition of a data center, current monitoring and / or complete computational fluid dynamics (CFD) modeling techniques can only either provide a one-time snapshot of the entire data center or continuous measurements in a few locations.
Making continuous measurements or continuous modeling of an entire data center using conventional techniques is impractical, if at all possible, from both an efficiency and cost standpoint.

Method used


Image

  • Techniques to Predict Three-Dimensional Thermal Distributions in Real-Time
  • Techniques to Predict Three-Dimensional Thermal Distributions in Real-Time
  • Techniques to Predict Three-Dimensional Thermal Distributions in Real-Time

Examples


example 1

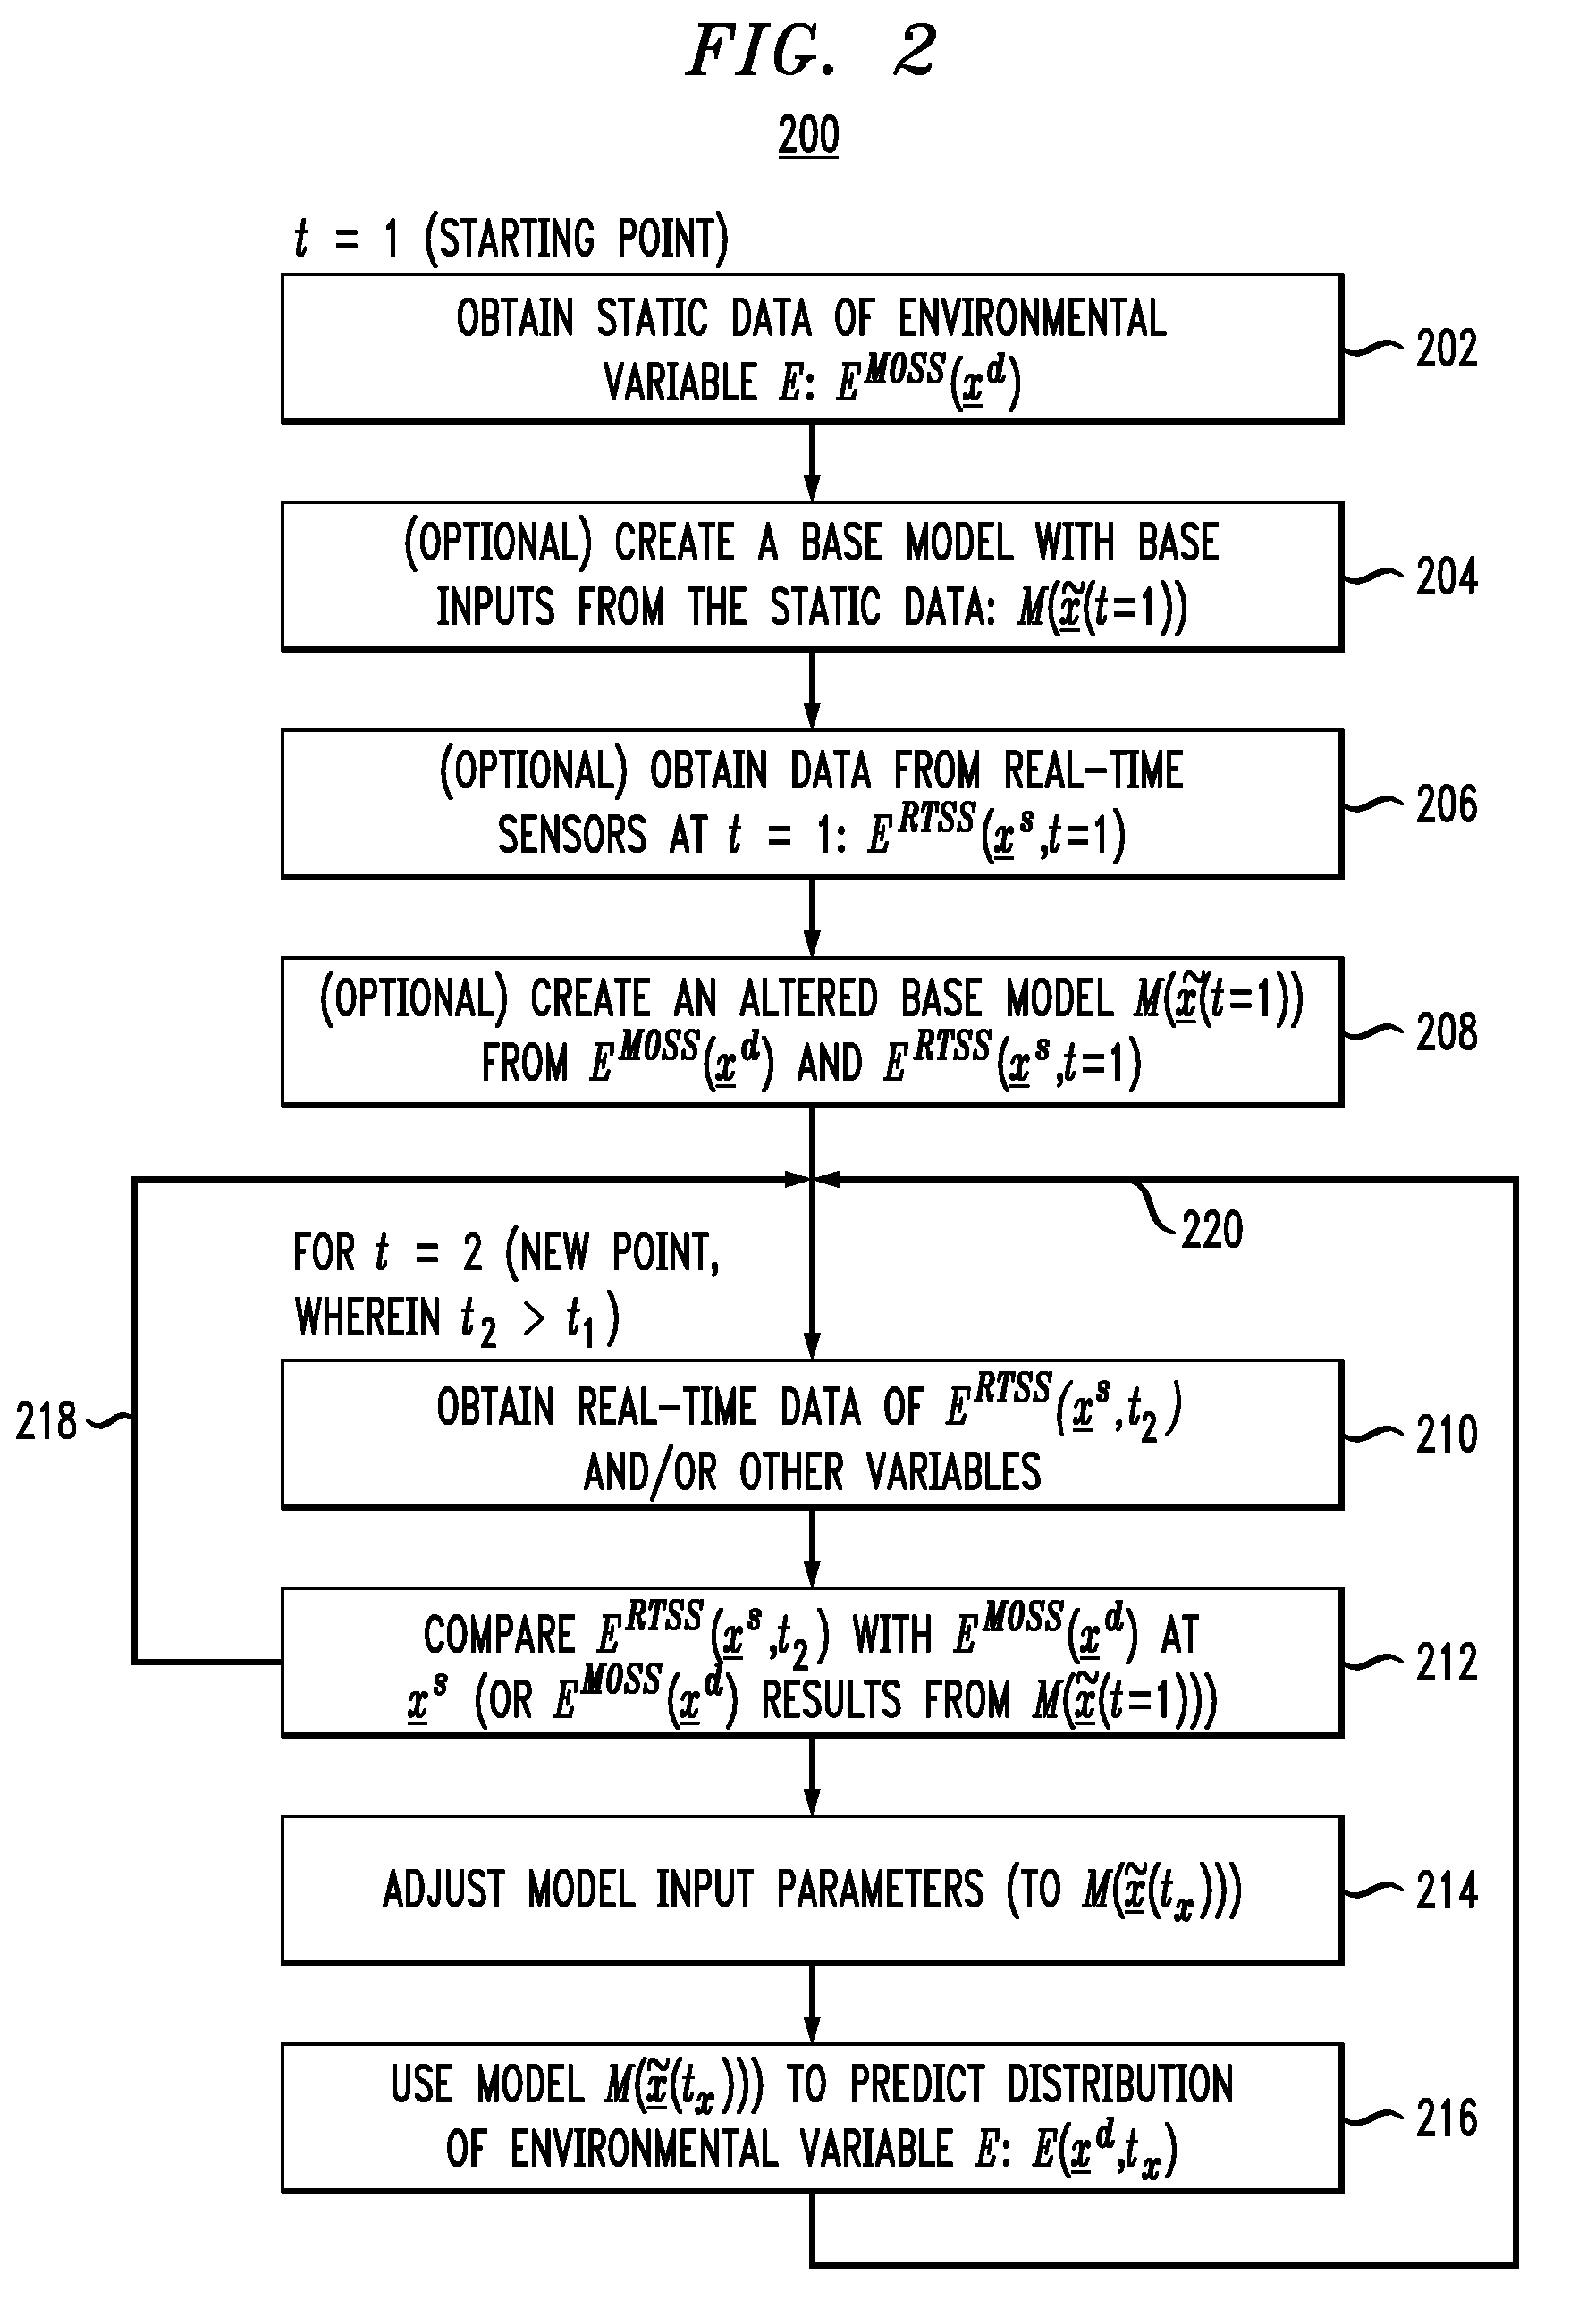
[0083]Thermal data (EMOSS(xd)) was obtained via MMT V1.0 at time t1. Because MMT V1.0 provided such a dense data grid, a base model was not constructed. The real-time sensors were placed on the MMT V1.0 data grid and thus a sensor calibration was not required. New data was then gathered from the real-time sensors at a time, i.e., time t2, i.e., ERTSS(xs,t2) where no EMODS(xd) is available (see line 3 of example code below where value and, x, y, and z coordinates are read from the sensors). The ERTSS(xs,t2) was then compared with the initial EMOSS(xd) (at time t1) results at xs (see line 12 of example code below, where the initial values (room.GTemp) are compared with the latest readings (at time t2) (value)). The difference between ERTSS(xs,t2) and EMOSS(xd) was then modeled using a griding function (see line 15 of example code below). The model was then used to predict a complete temperature field at time t2 (see line 19 of example code below, where a new three-dimensional temperat...

example 2

[0084]EMOSS(xd) was obtained using temperature results from CFD calculations. Because these calculations are too slow to be repeated in real-time, the data was represented and modeled by a simple model, such as the Laplacian model approach as described in Attorney Reference No. YOR920080114US1 or a simple provisioning model (create M({tilde over (x)}(t1))). In the example using a Laplacian model approach, the complete data center was described by the physical dimensions and locations of its infrastructure and equipment, as well as by the power levels and the different air flow boundaries (and / or temperature boundaries) (see Attorney Reference No. YOR920080114US1 for a detailed discussion). Because the real-time sensors were not on the same grid as the CFD model results (compare with Example 1, described above), the real-time sensor data and the CFD model results had to be referenced to each other. In this example, the real-time data at time t1 ERTSS(xs,t1) was compared with the MOSS...

example 3

[0085]To demonstrate the effectiveness of the present real-time, three-dimensional analysis techniques, both MMT measurements (FIG. 10) and real-time sensor measurements (FIG. 11) were obtained for a sample data center. FIG. 10 is graph 1000 illustrating MMT measurements obtained from the sample data center, wherein circles (◯) are the MMT measurements, triangles (Δ) indicate server inlets and outlets and plus symbols (+) indicate sensors. Both the x-axis and the y-axis represent the data center dimensions measured in feet. As described above and as exemplified from graph 1000, the MMT V1.0 measurement data has high spatial resolution. As also described above, however, the MMT measurement data is temporally sparse, since for any given data center such measurements are typically performed only once or twice a year. FIG. 11 is graph 1100 illustrating real-time sensor observations, i.e., measurements from the sample data center, with 30-minute average temperature (measured in ° C.) plo...


PUM


Abstract

Techniques for monitoring and predicting environmental operating conditions in a data center are provided. In one aspect, a method for real-time, three-dimensional analysis of environmental operating conditions in a data center includes the following steps. High spatial resolution three-dimensional measurements of one or more environmental variables in the data center made at a time t1 are obtained. Real-time measurements of the environmental variables in the data center made at a time t2, wherein t2 is later in time than t1, are obtained. The high spatial resolution three-dimensional measurements are combined with the real-time measurements to derive a model for the environmental variables in the data center at the time t2. The model is used to predict three-dimensional distributions of the environmental variables in the data center at the time t2. A base model can be created and used to derive the model for the data center at the time t2.

Description

CROSS-REFERENCE TO RELATED APPLICATIONS [0001]This application is related to the commonly owned U.S. application Ser. No. 12 / 146,852, entitled “Techniques for Thermal Modeling of Data Centers to Improve Energy Efficiency,” designated as Attorney Reference No. YOR920080114US1, filed herewith on the same day of Jun. 26, 2008, the contents of which are incorporated by reference herein.FIELD OF THE INVENTION [0002]The present invention relates to data centers, and more particularly, to techniques for monitoring and predicting environmental operating conditions in a data center.BACKGROUND OF THE INVENTION [0003]The continuing rise of energy consumption of computing hardware systems installed in data centers combined with the cooling infrastructure required to provide operable conditions for this hardware has emerged as a key limitation for future growth in the field of information technology (IT). As a result, undesirable tradeoffs commonly must be made between energy / cooling requirement...

Claims


Application Information

Patent Timeline
Patent Type & Authority Applications(United States)
IPC IPC(8): G06G7/48G06F7/60
CPCG06F1/206Y02B60/1275G06F17/5009H05K7/20836Y02D10/00G06F30/20
Inventor AMEMIYA, YASUOHAMANN, HENDRIK F.HIRT, WALTERHUNG, YINGSHEN, JING
Owner IBM CORP
Why Eureka
Try Eureka