
Data analysis method

a data analysis and data technology, applied in the field of data analysis, can solve the problems of wasting a lot of space, difficult to determine if a cell is blank, and difficult to determine if an occupied cell should be occupied or blank

Inactive Publication Date: 2009-12-31
RAPOSO STEVEN
View PDF6 Cites 58 Cited by
  • Summary
  • Abstract
  • Description
  • Claims
  • Application Information

AI Technical Summary

Benefits of technology

[0015]The present invention provides an improved method for analyzing data with a pivot table. In particular, the present invention provides a single table approach that does not rely on any relationships between the tables, so the relationships between the tables can

Problems solved by technology

Moreover, the '666 patent listed many disadvantages for the “single table” approach.
These disadvantages include:1. Data tables that are very wide, and include a large number of fields,2. The existence of a lot of wasted space, because the records will be for one of the data sets only, and the schema, or table structure of the single table, will include the fields for all the data sets.3. Opportunity for errors in the data, because of the large amount of blank cells.
It can be difficult to recognize if a cell is blank because it should be, or because the cell is in error.
In addition, it may be difficult to determine if an occupied cell should be occupied or blank.4. It is difficult to dynamically alter the structure of the database once it is populated with data.

Method used


Image

  • Data analysis method
  • Data analysis method
  • Data analysis method

Examples


Embodiment Construction

[0024]To provide a context for the present invention, the basic fundamentals of a pivot table will be briefly explained.

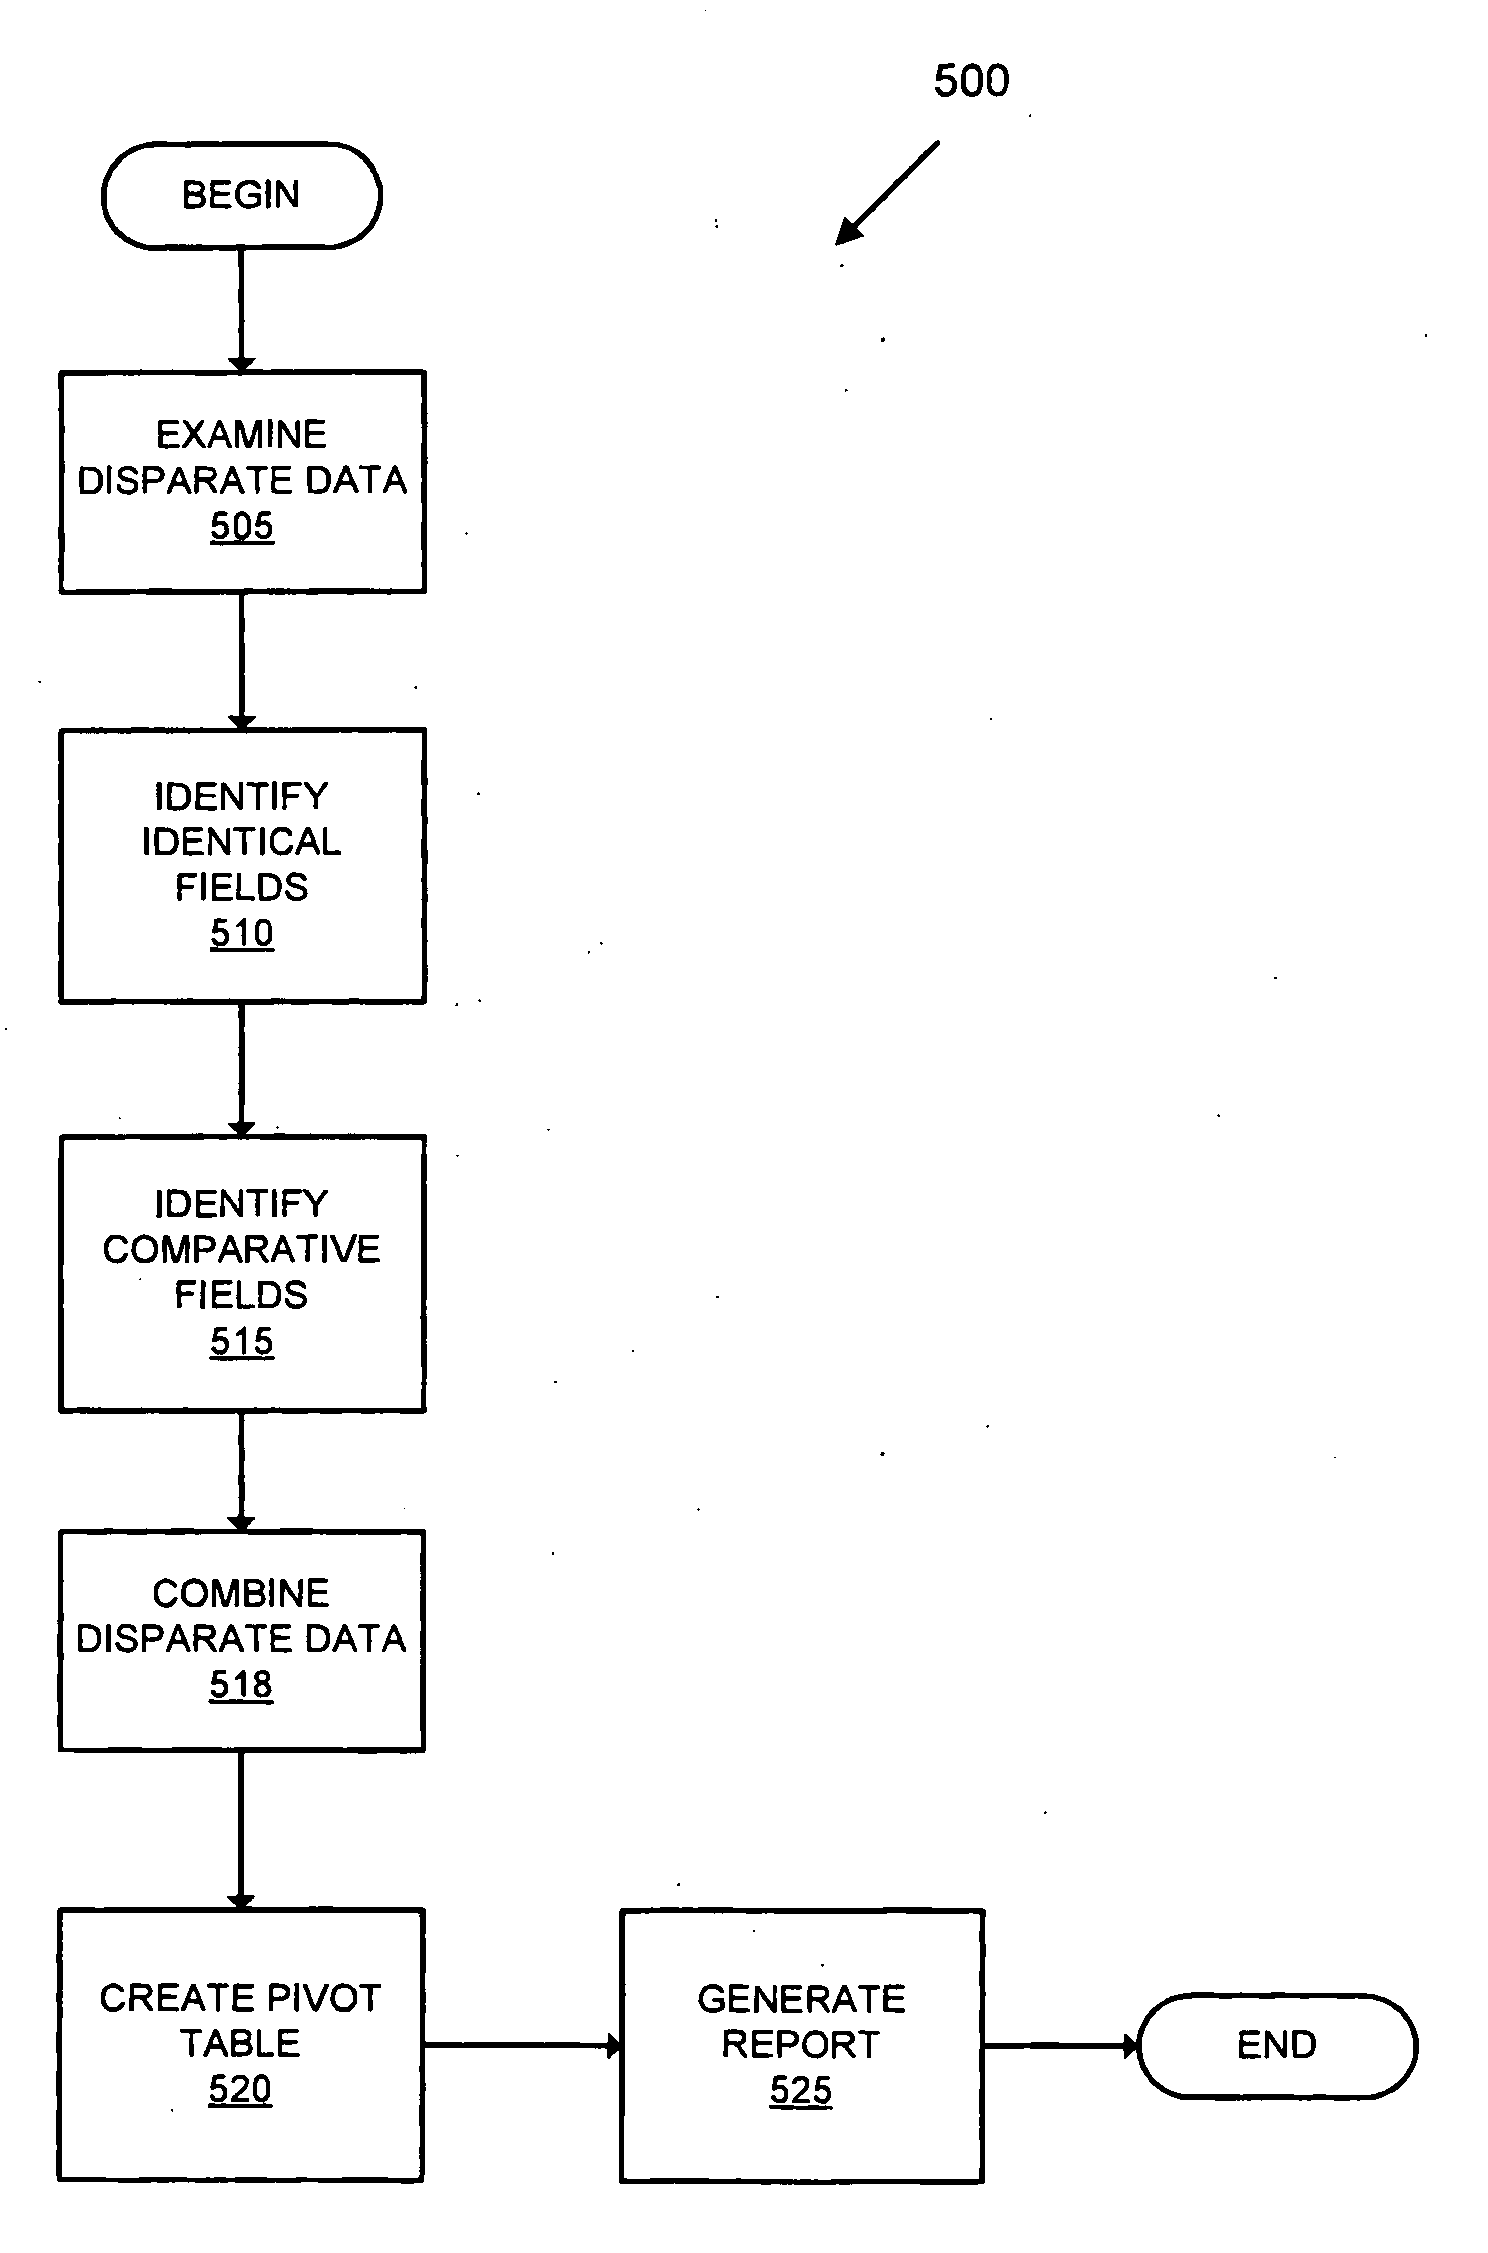
[0025]The invention is a method comprising the steps of creating a single data table from at least two disparate data sets; activating a pivot table function, choosing at least two fields for a pivot table field list and using at least two fields from the pivot table field list to create a pivot table report.

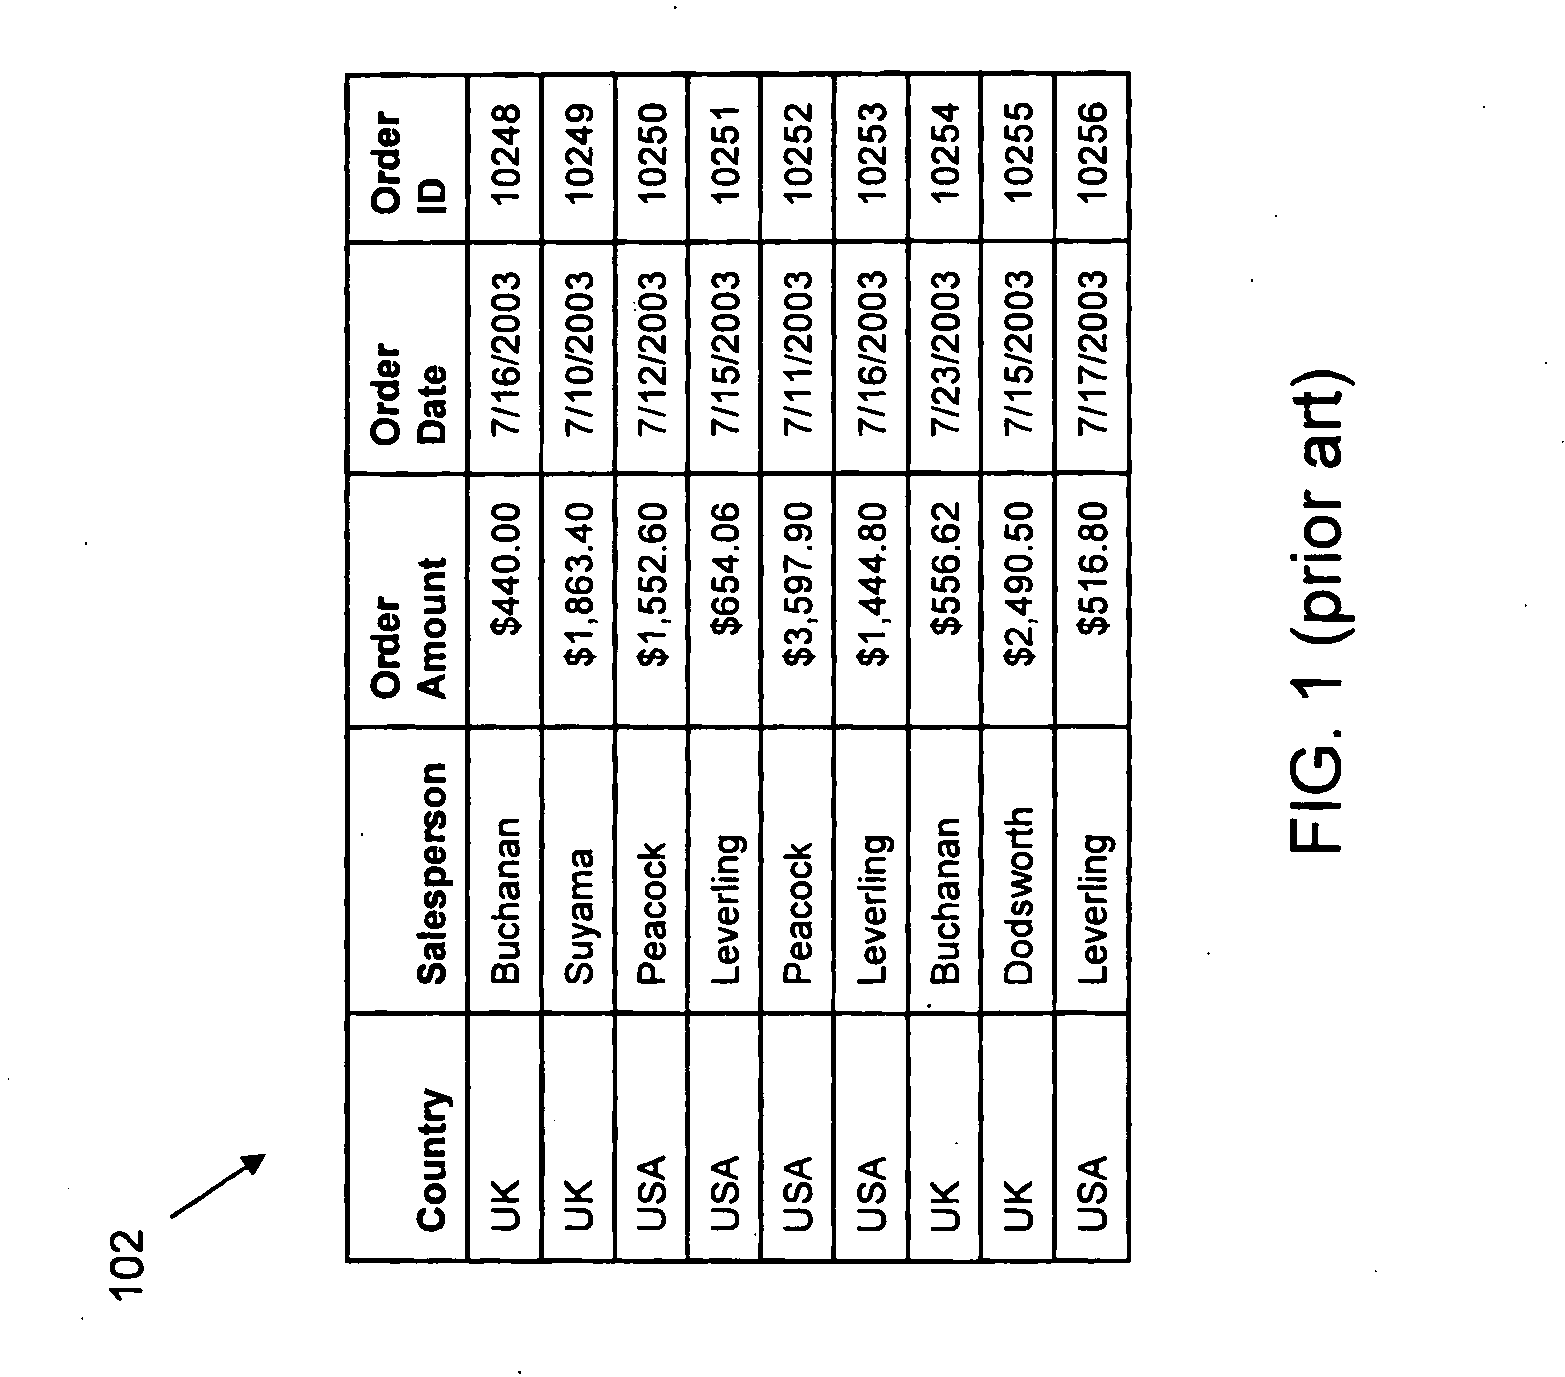
[0026]FIGS. 1-4 show the basic steps of creating a pivot table. In FIG. 1, a portion of the source data is shown in spreadsheet 102. The data comprises five columns. Each column represents a different field (e.g. country, salesperson, etc. . . ). Each row represents a tuple of values for the five field set. For example, row 5 represents the tuple .

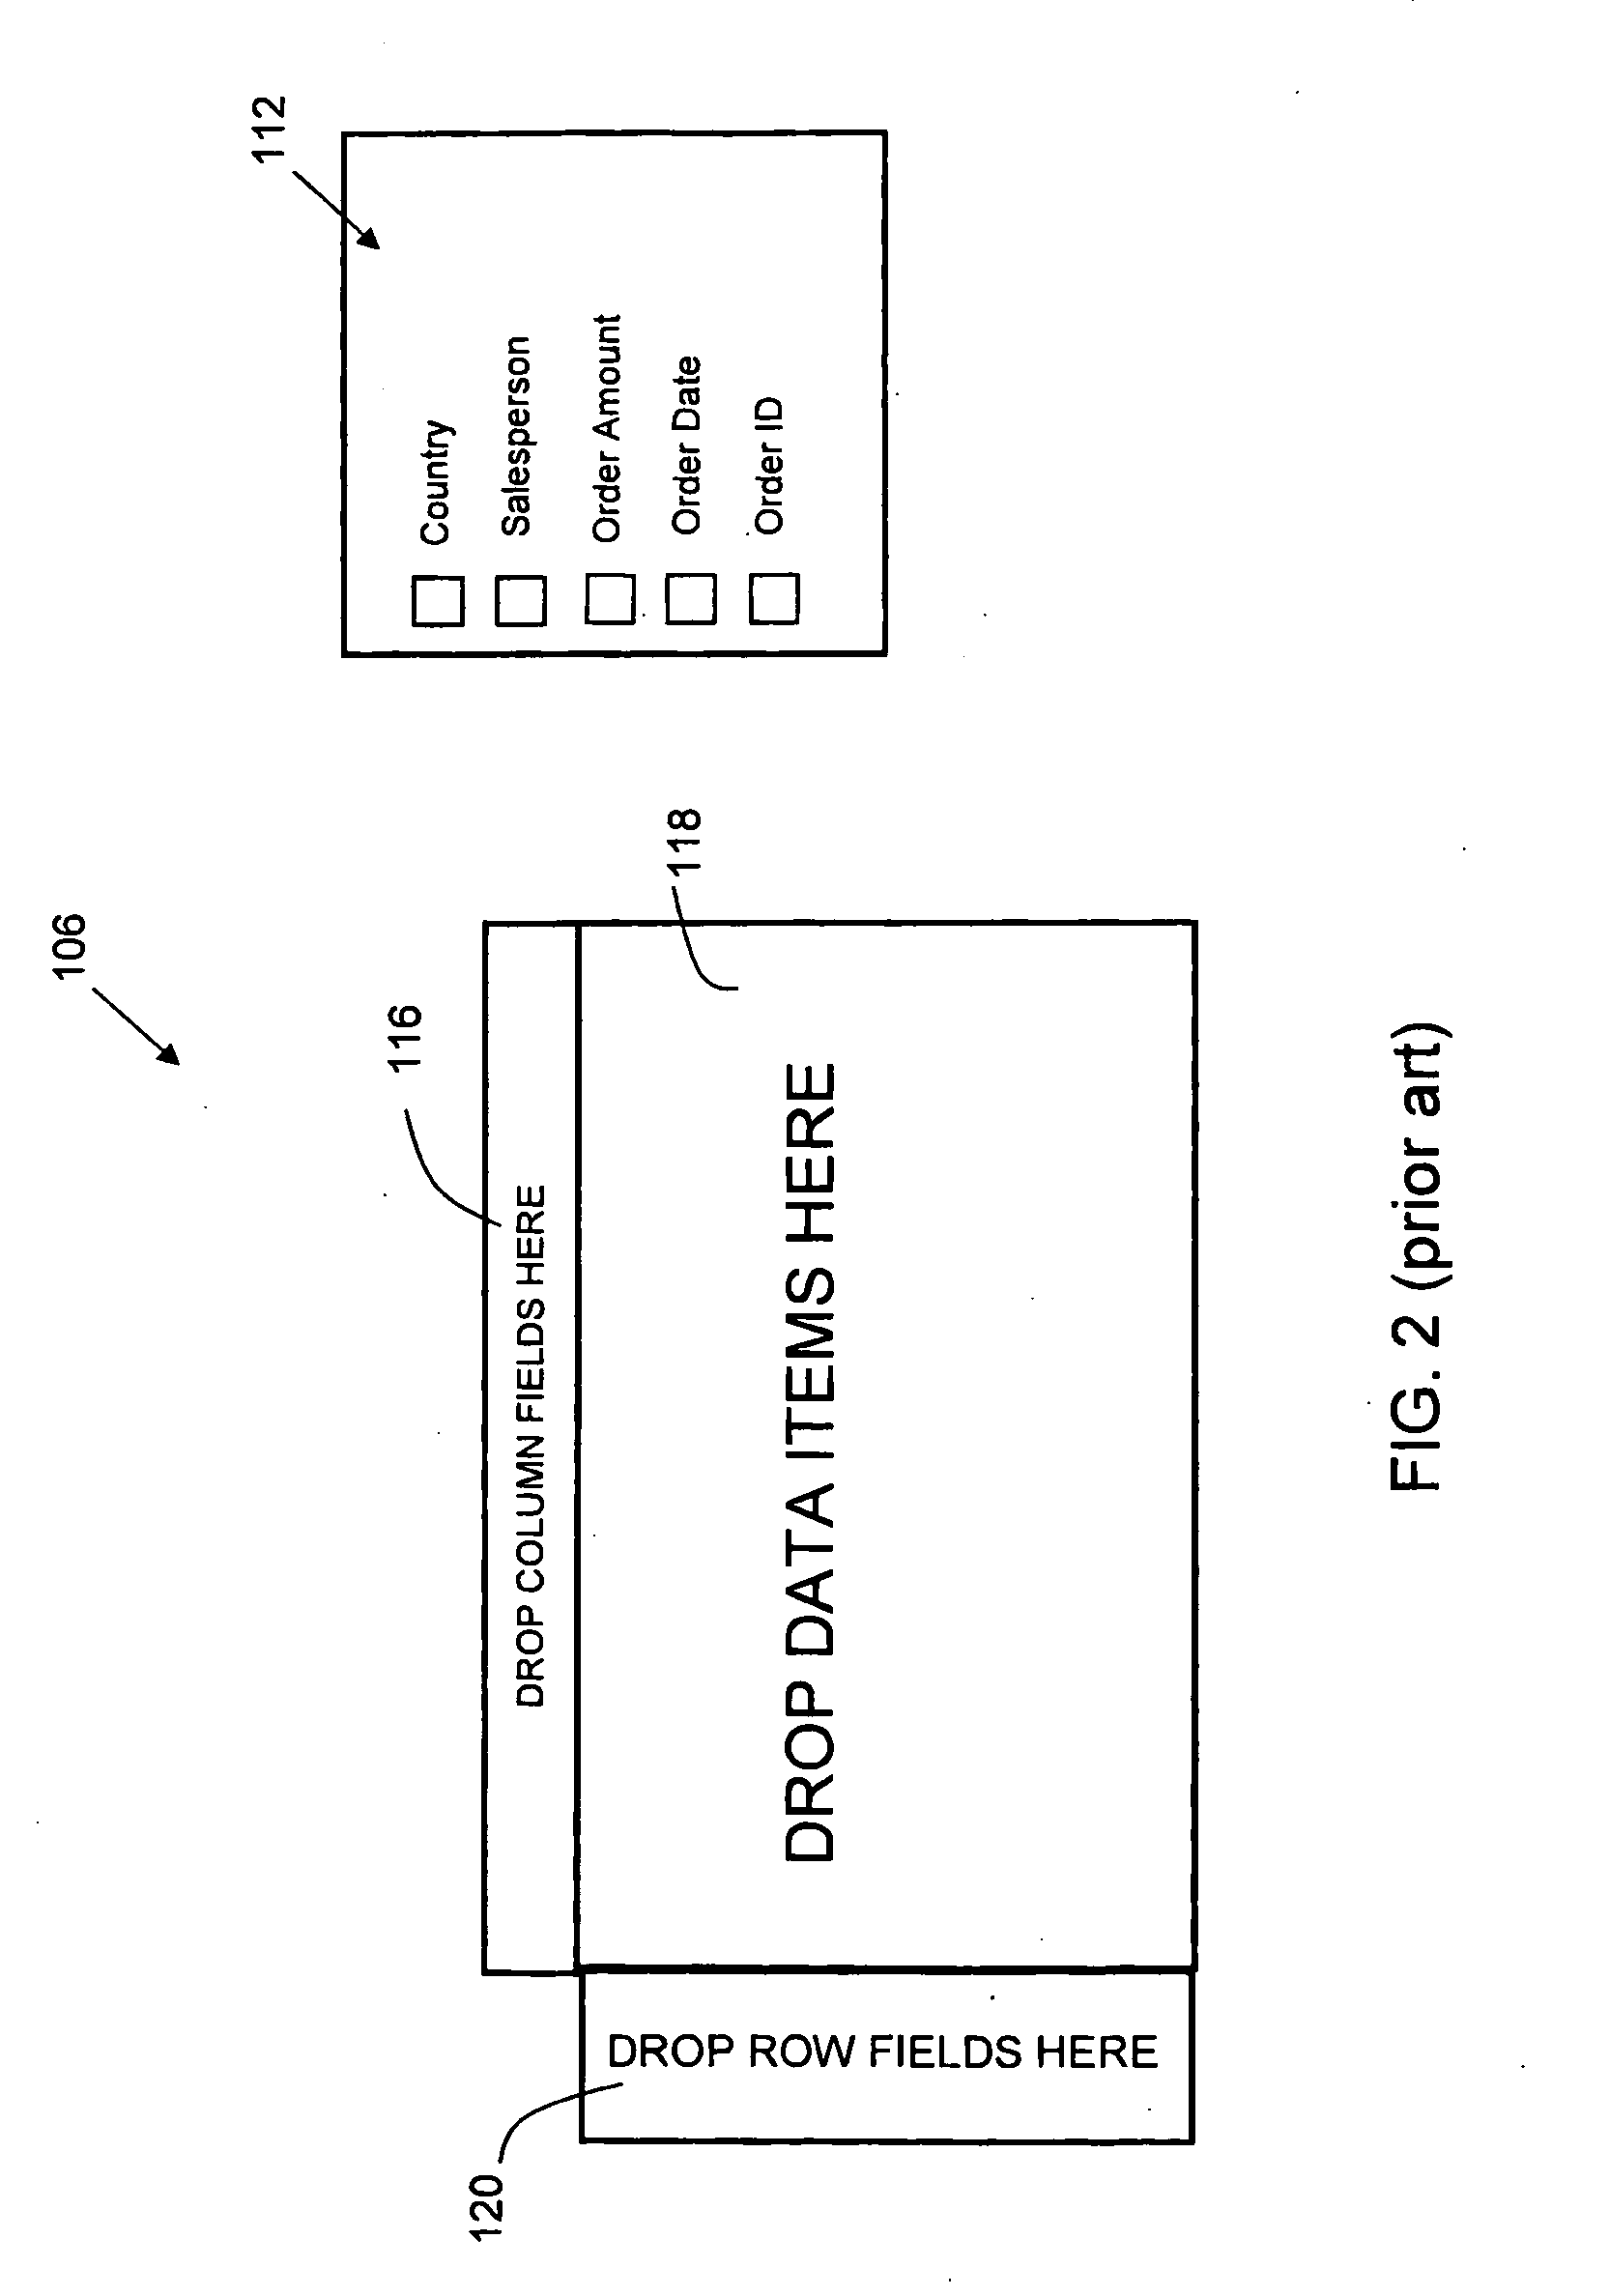
[0027]FIG. 2 shows the pivot table wizard 106 similar to that of MICROSOFT EXCEL. Other spreadsheet programs may have a similar wizard feature. In the wizard, the five fields are shown in the pivot table field list 11...


PUM


Abstract

A data analysis method is disclosed. The method comprises aggregating related data tables with dissimilar data structures, and combining the tables, and data structures, into a single table that incorporates all the individual data structures. The single table is then analyzed via a pivot table function of a spreadsheet program, such as Microsoft Excel. The method is suited for quickly comparing related but dissimilar sets of data—an important task in virtually every field of human endeavor, from manufacturing to health care to financial services. The present invention provides an improved way to quickly access important strategic information using multiple sources of data.

Description

CLAIM OF PRIORITY[0001]This application claims the priority of U.S. Ser. No. 61 / 076,159 filed on Jun. 27, 2008, the contents of which are fully incorporated herein by reference.FIELD OF THE INVENTION[0002]The present invention relates to data analysis. More particularly, the present invention relates to an improved system and method for creating pivot tables.BACKGROUND[0003]Pivot tables have been provided in numerous spreadsheet programs for several years. A pivot table provides an efficient way to display and summarize data that is included in a database or in the data listing of a spreadsheet by automatically displaying fields of the data in a manner determined by the user and by determining and displaying selected parameters such as the sum, variance, count, standard deviation, etc. of selected data fields. Relatively structured spreadsheets that already have subtotals, data entry cells, and summaries of fields are generally not appropriately expressed using a pivot table. In con...

Claims


Application Information

Patent Timeline
IPC IPC(8): G06F17/00
CPCG06F17/30289G06F17/246G06F16/21G06F40/18
Inventor RAPOSO, STEVEN
Owner RAPOSO STEVEN
Learn More