Method For Determining Hemodynamic Effects Of Positive Pressure Ventilation

a positive pressure ventilation and hemodynamic effect technology, applied in the field of determining the hemodynamic effect of positive pressure ventilation, can solve the problems of adjusting the blood distribution, the change of optical response and modulation, and the difficulty in estimating the heart's total stroke volum

Active Publication Date: 2010-03-18
TYCO HEALTHCARE GRP LP
View PDF99 Cites 177 Cited by
  • Summary
  • Abstract
  • Description
  • Claims
  • Application Information

AI Technical Summary

Benefits of technology

[0013]According to some embodiments, a method of predicting the effect of changes in ventilation settings on stroke volume of a ventilated subject may comprise sensing pressure in the subject's airway during at least one breathing cycle comprising an inhalation and an exhalation, producing a photoplethysmogram spanning the at least one breathing cycle, determining the ratio of the amplitude of the photoplethysmogram during inhalation to the amplitude of the photoplethysmogram during exhalation, determining the change in cardiac output or stroke volume of the sub

Problems solved by technology

This may also lead to changes in optical response and modulation.
Shock, trauma or infection may cause adjustments in blood distribution.
These factors may make it difficult to estimate the heart's total stroke volume based on the measurement of blood volume changes at a single sensor site.
A “perfusion index” may be used on some occ

Method used


Image

  • Method For Determining Hemodynamic Effects Of Positive Pressure Ventilation
  • Method For Determining Hemodynamic Effects Of Positive Pressure Ventilation
  • Method For Determining Hemodynamic Effects Of Positive Pressure Ventilation

Examples


example 1

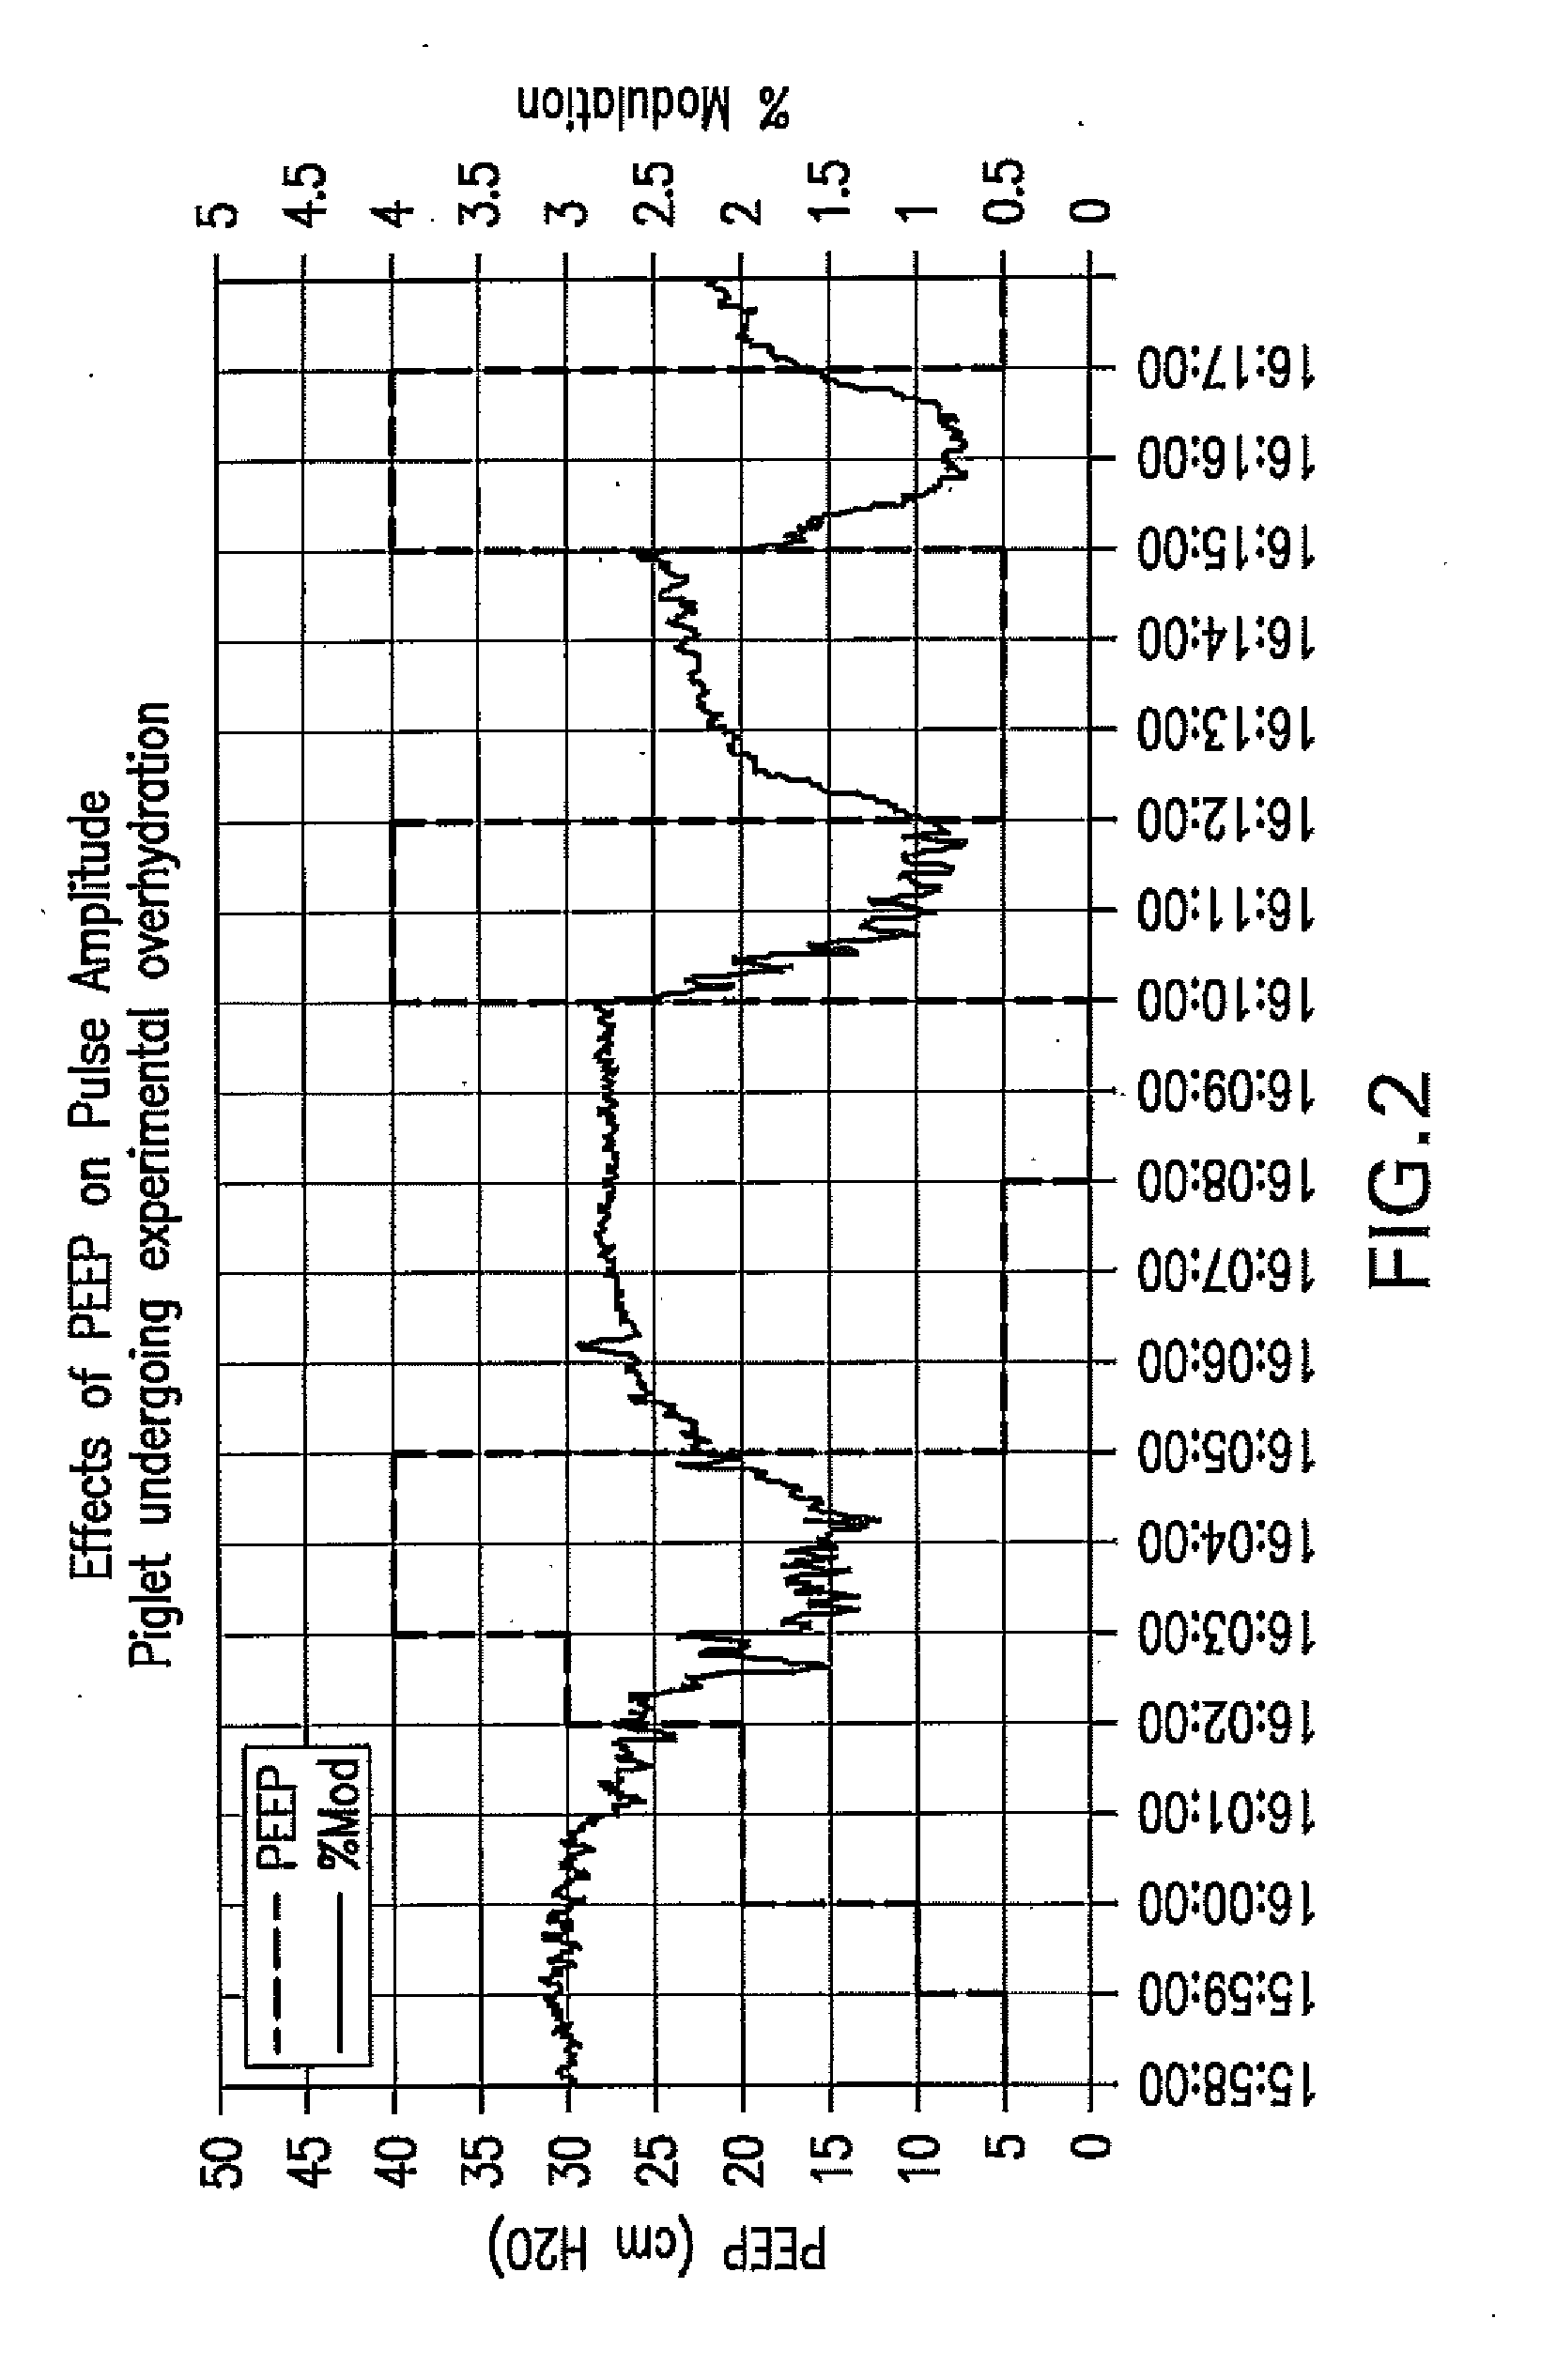
[0038]In a ventilated animal subject, PEEP was gradually increased over five minutes from 5 to 40 cm H2O and a roughly 50% decrease in PPG modulation (from 3.0% to 1.5%) was observed (FIG. 2). In addition, a 65-70% decrease in PPG modulation (from 2.7% to % 0.9 and subsequently 2.4% to 0.8%) each of the two times that PEEP was increased in a single step from zero to 40 cm H2O (FIG. 2). Thus, modest reductions in PPG modulation occurred at 16:02:00 with when PEEP was increased from 20 to 30 cm H2O, with very pronounced reductions in PPG amplitude for each of the periods when PEEP was increased to 40 cm H2O.

[0039]This example indicates that that this particular animal subject experienced roughly 50% and later 65-70% reductions in stroke volume at a result of experiencing an airway pressure at or above 40 cm H2O. Without necessarily limiting any particular embodiment to any specific mechanism of action, the smaller relative reduction in PPG modulation when PEEP was increased gradually ...


PUM


Abstract

The present disclosure relates, in some embodiments, to devices, systems, and/or methods for collecting, processing, and/or displaying stroke volume and/or cardiac output data. For example, a device for assessing changes in cardiac output and/or stroke volume of a subject receiving airway support may comprise a processor; an airway sensor in communication with the processor, wherein the airway sensor is configured and arranged to sense pressure in the subject's airway, lungs, and/or intrapleural space over time; a blood volume sensor in communication with the processor, wherein the blood volume sensor is configured and arranged to sense pulsatile volume of blood in a tissue of the subject over time; and a display configured and arranged to display a representative of an airway pressure, a pulsatile blood volume, a photoplethysmogram, a photoplethysmogram ratio, the determined cardiac output and/or stroke volume, or combinations thereof. A method of assessing changes in cardiac output or stroke volume of a subject receiving airway support from a breathing assistance system may comprise sensing pressure in the subject's airway as a function of time, sensing pulsatile volume of blood in a tissue of the subject as a function of time, producing a photoplethysmogram from the sensed pulsatile volume, determining the ratio of the amplitude of the photoplethysmogram during inhalation to the amplitude of the photoplethysmogram during exhalation, and determining the change in cardiac output or stroke volume of the subject using the determined ratio.

Description

FIELD OF THE DISCLOSURE[0001]The present disclosure relates, in some embodiments, to devices, systems, and / or methods for collecting, processing, and / or displaying stroke volume and / or cardiac output data.BACKGROUND OF THE DISCLOSURE[0002]Most oxygen delivered to tissue is carried by hemoglobin. The proportion of oxygen delivered by hemoglobin may drop somewhat for a patient breathing very high levels of oxygen, however. A pulse oximeter may use the time-varying optical response of different wavelengths of light traveling through tissue to estimate pulse rate and the fraction of hemoglobin that carries oxygen molecules in the pulsatile portion. Each data point in the pulse oximeter's time series of optical response measurements represents the quantity of those photons of light that travel on a path from light emitter to light detector and are successfully measured by the detector. The signal level may be reduced by, for example, optical attenuation and scattering of tissue along the...

Claims


Application Information

Patent Timeline
IPC IPC(8): A61B5/0205A61B5/021
CPCA61B5/029A61B5/0806A61B5/0205A61B5/14551A61B5/4035
Inventor KARST, EDWARDVANDINE, JOSEPH DOUGLASPORGES, CHARLES E.BAKER, JR., CLARK RAYMOND
Owner TYCO HEALTHCARE GRP LP
Why Eureka
Try Eureka