
Data processing, analysis method of gene expression data to identify endogenous reference genes

Inactive Publication Date: 2010-06-03
SEOUL NAT UNIV R&DB FOUND
View PDF1 Cites 13 Cited by
  • Summary
  • Abstract
  • Description
  • Claims
  • Application Information

AI Technical Summary

Benefits of technology

[0016]Introduced with the concepts of ‘Zero's proportion’ and CV, the method of the present invention allows different datasets to be integrally analyzed, thereby searching for novel reference genes. By the method, 2,087 genes were first found as housekeeping genes which are expressed in most tissues, and the usefulness thereof in the relative quantification of different target genes was determined by analyzing their expression stability. Out of the 2,087 genes, 13 genes were found to show higher expression stability with lower expression levels across a wide range of samples than traditional reference genes such as GAPDH and ACTB, and therefore are suitable for the normalization of universal genes having relatively low expression levels.

Problems solved by technology

The use of inappropriate reference genes in the relative quantification of gene expression may result in biased expression profiles.
As is well-known, the microarray technique has some problems and limitations (errors) due to the potential for inaccurate cross hybridization between probes and unintended transcripts, the potential for differences in hybridization efficiency between probe sets, and the potential for the incorrect annotation of transcripts (Haverty P M et al., Bioinformatics 20(18):3431-3441, 2004; van Ruissen F et al., BMC Genomics 6:91, 2005).

Method used


Image

  • Data processing, analysis method of gene expression data to identify endogenous reference genes
  • Data processing, analysis method of gene expression data to identify endogenous reference genes
  • Data processing, analysis method of gene expression data to identify endogenous reference genes

Examples


example 1

Gene Expression Dataset Construction

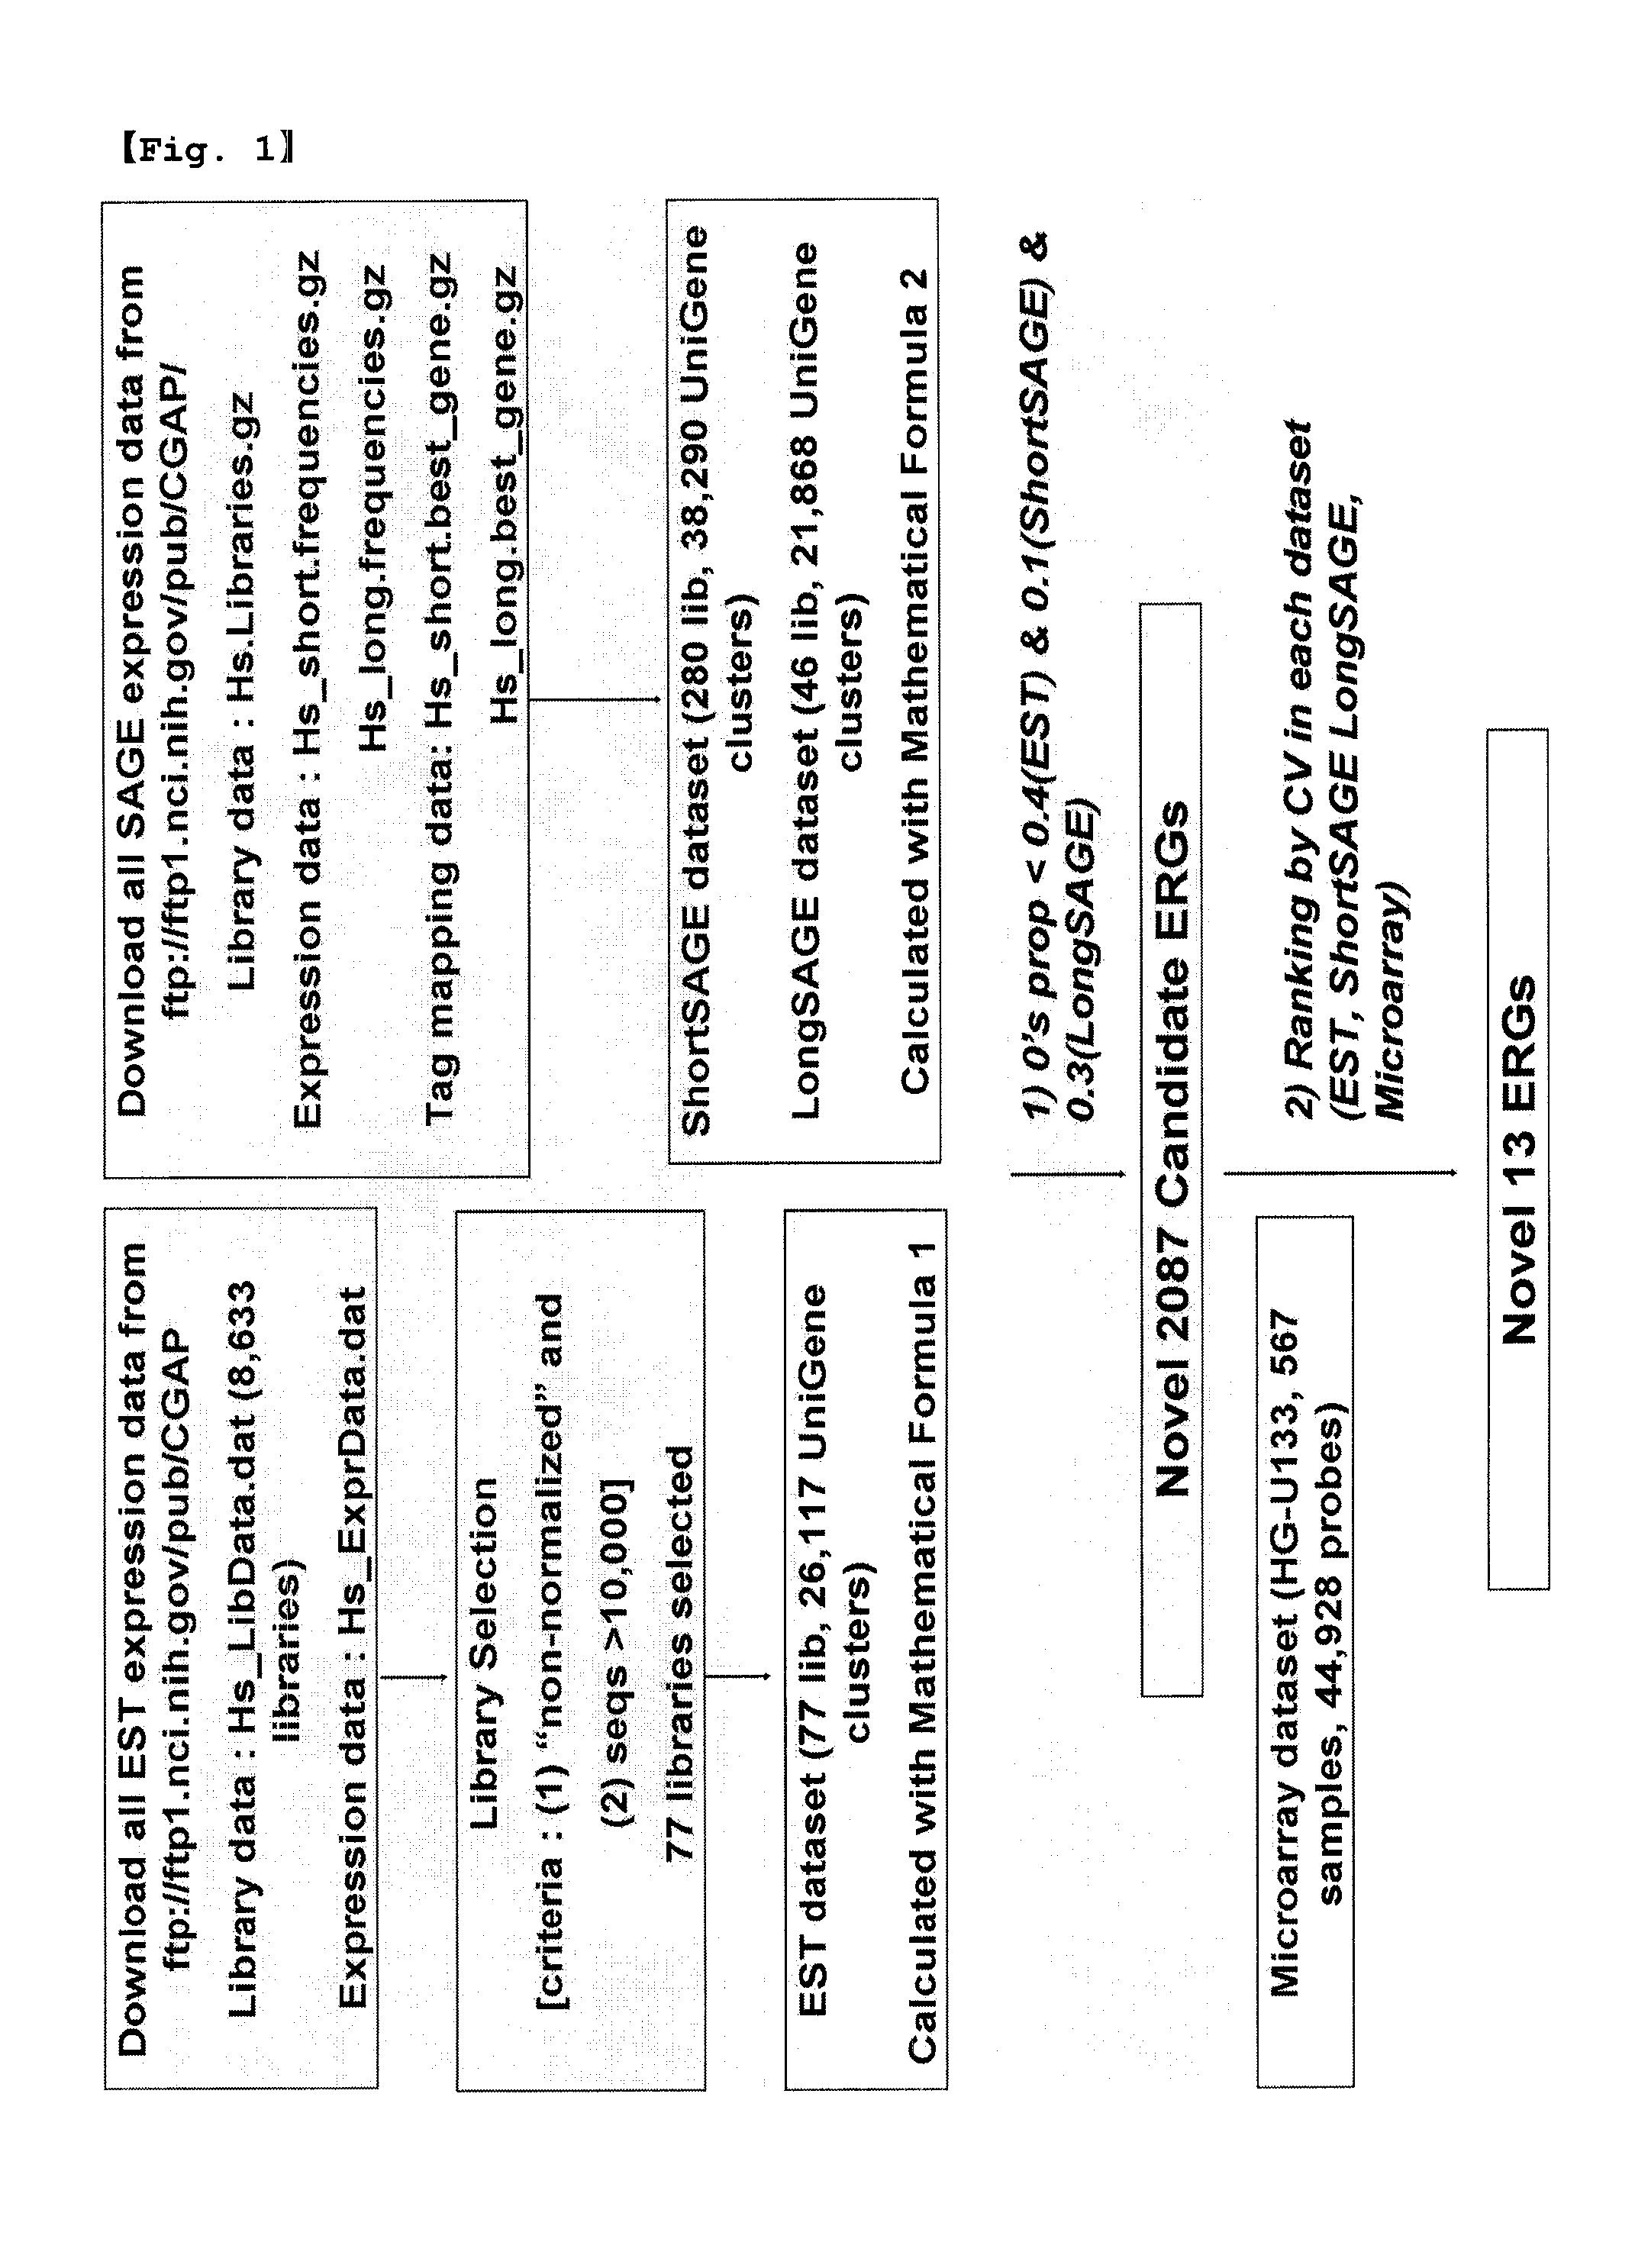
[0075]EST (expressed sequence tag) and SAGE (serial analysis of gene expression) human gene expression data were collected from the publicly available CGAP site (The Cancer Genome Project, http: / / cgap.nci.nih.gov / ). Microarray gene expression data were obtained from the GeneExpress Oncology Datasuite™ of Gene Logic Inc., based on the Affymetrix Human Genome U133 array set.

[0076]Out of a total of 8,633 libraries in Hs_LibData.dat (31 / Oct / 05) file, 77 libraries meeting the requirements: 1) non-normalized and 2) >10,000 sequences, were included in the EST dataset constructed from the CGAP site. EST frequency in each library was obtained from Hs_ExprData.dat (31 / Oct / 05) file. 29 different tissues, including normal and tumor samples, and 26,117 UniGene clusters were included in these libraries.

[0077]SAGE short data for all 280 libraries (Hs_short.frequencies.gz, 05 / Dec / 06), representing 38,290 UniGene clusters, and SAGE long data (Hs_long.frequencies.g...

example 2

Selection of Candidate ERG

[0079]Using the datasets constructed in Example 1, expression level was calculated for UniGene clusters so as to search for housekeeping genes which are constitutively expressed in most human tissues.

[0080]Gene expression levels of EST dataset for each gene were calculated as the number of ESTs of a gene in a given library, divided by the total number of ESTs in all genes in a given library and then multiplied by 1,000,000, as expressed by Mathematical Formula 1.

[0081]Likewise, Gene expression levels of SAGE dataset for each gene were calculated as the number of tags (sum of tag frequency) of a gene in a given library, divided by the total number of tags and then multiplied by 1,000,000, as expressed by Mathematical Formula 2.

<MathematicalFormula1>ETSgeneexpression= NoofESTofaGivenGeneinLibraryTotalNo.ofESTsinLibaray×1,000,000<MathematicalFormula2>SAGEgeneexpression=NoofTagsofaGivenGeneinLibraryTotalNo.ofTagsinLibaray×1,000,000

[0082]Expression l...

experimental example 1

Analysis of Candidate ERG

[0089] Functional Classification of Candidate ERG

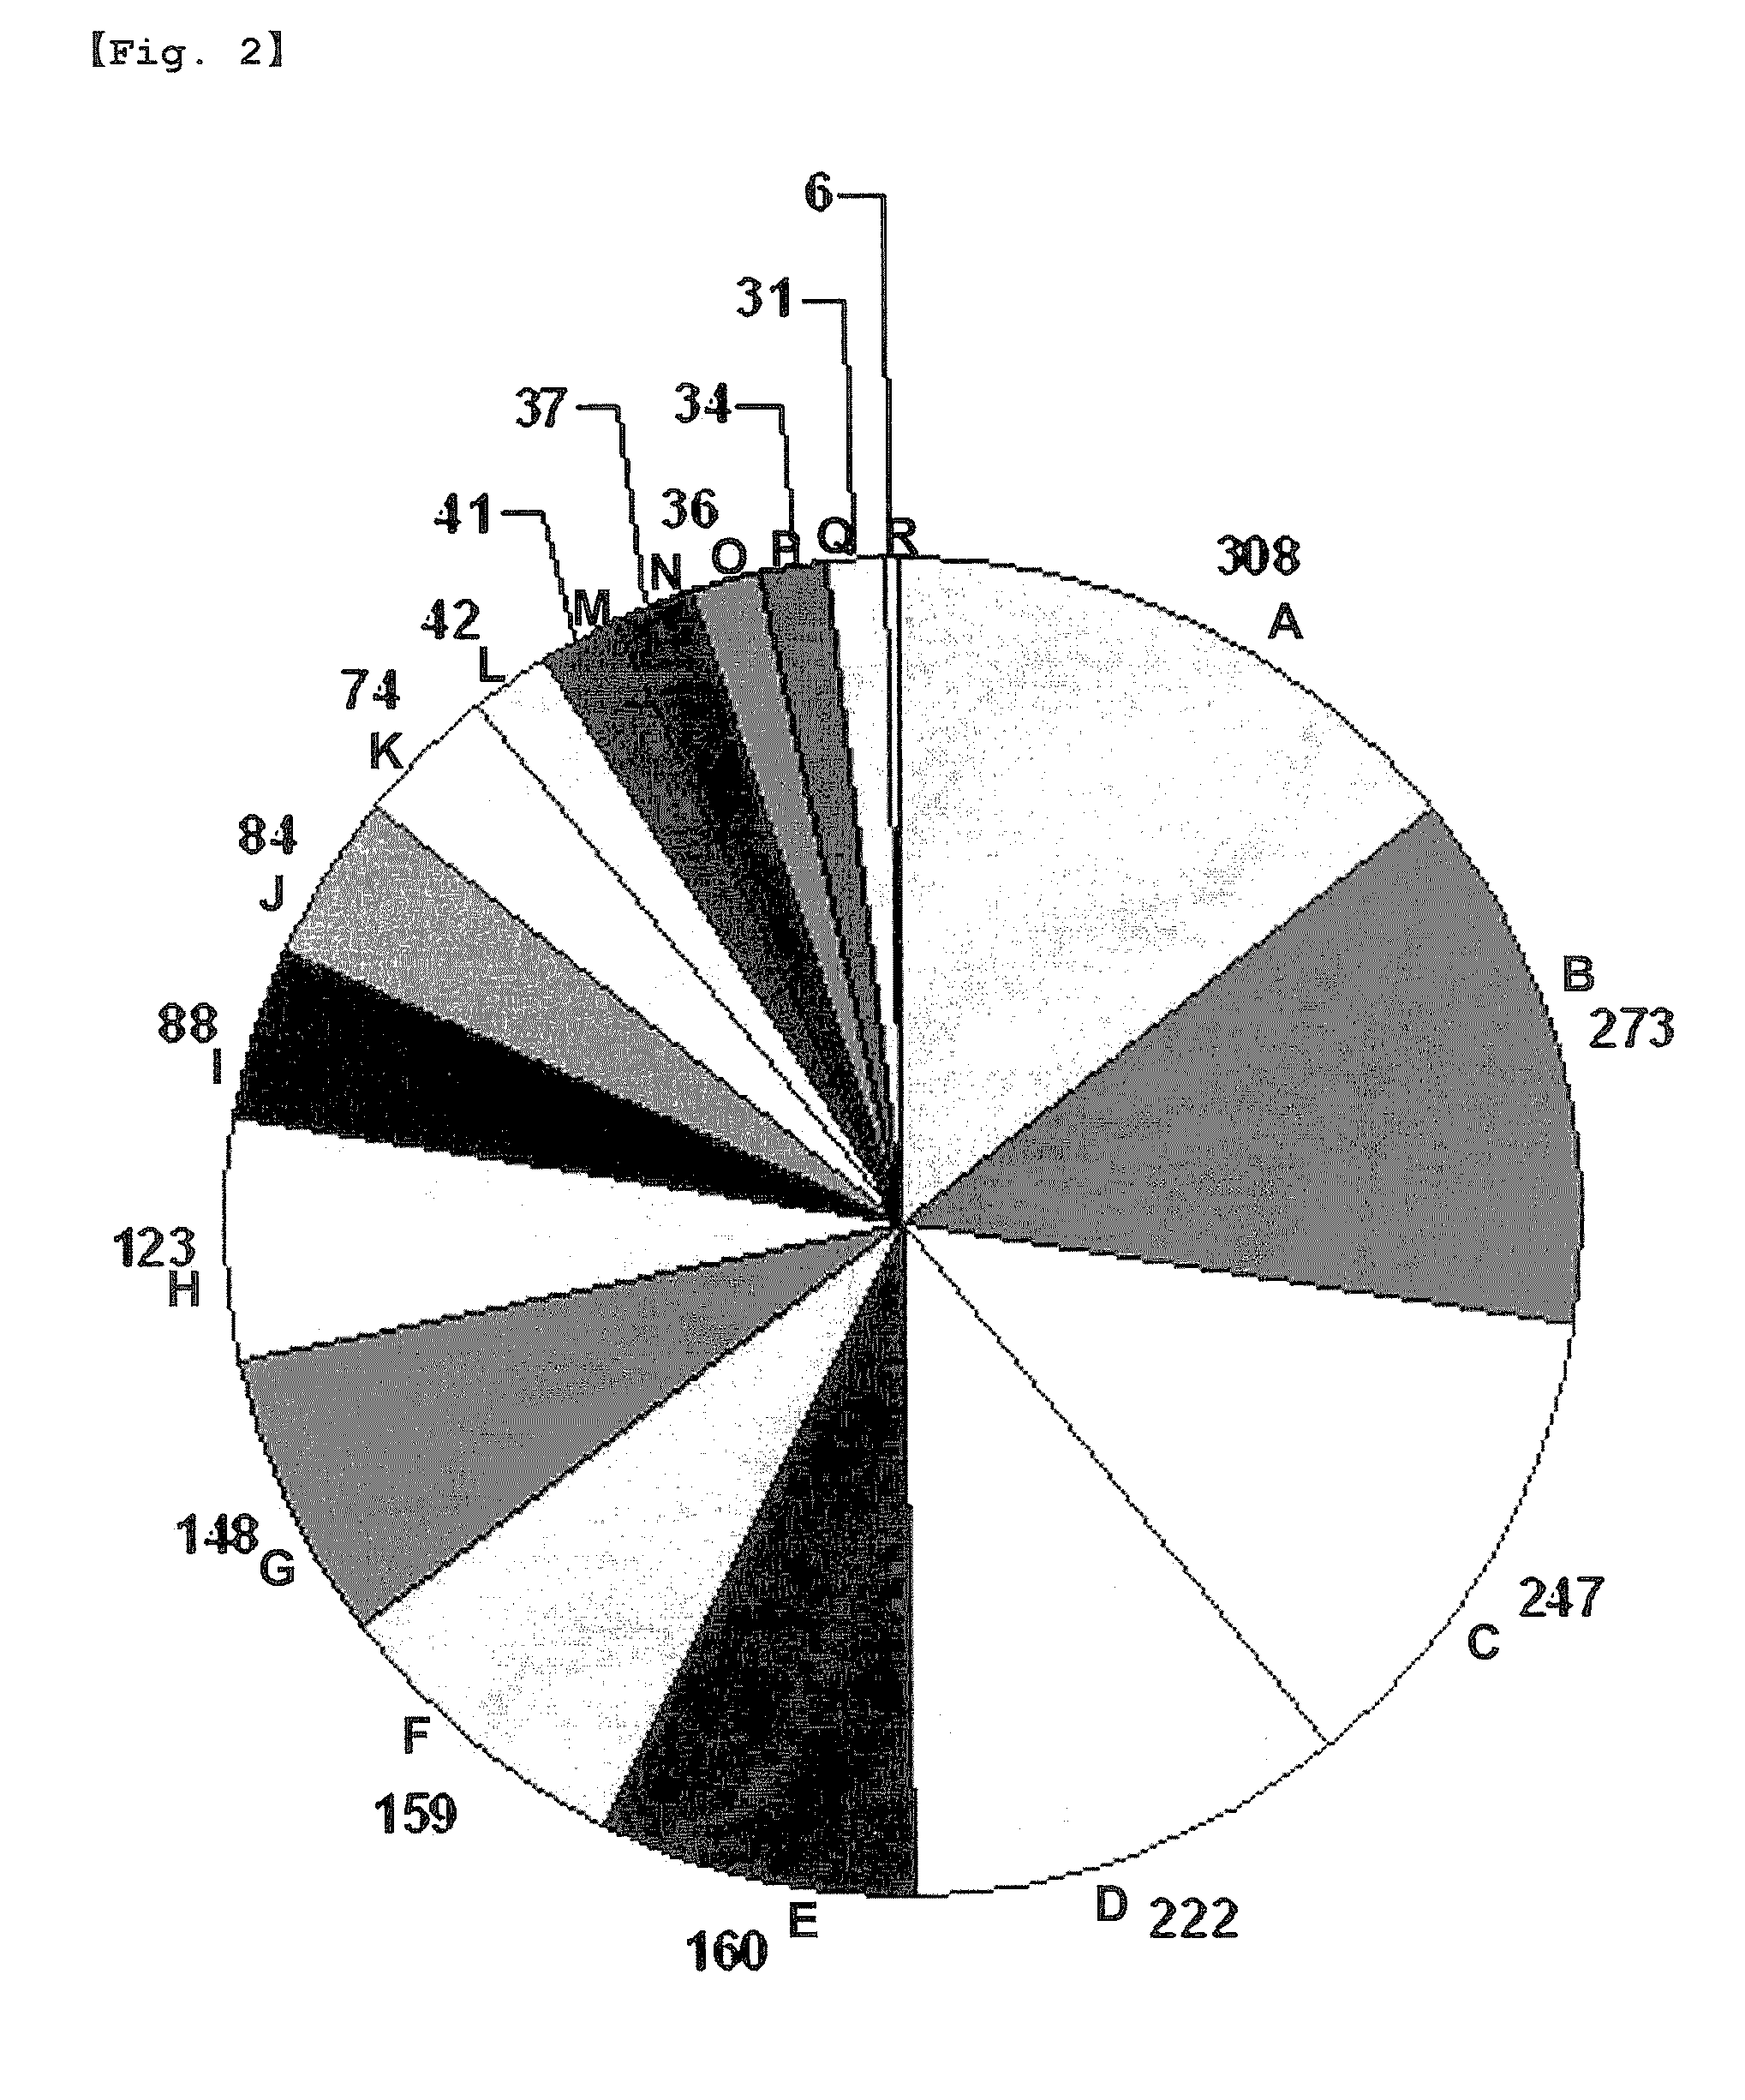
[0090]Using FunCat (Functional Classification Catalogue, Version 2.0, Ruepp, A., et al. Nucleic Acids Res, 32, 5539-45, 2004), the 2,087 genes obtained above were classified.

[0091]Out of the 2,087 candidate ERGs, 1,689 UniGene clusters were associated with GO terms allocated to MIPS (Munich Information Center for Protein Sequences) FunCat (Functional Catalogue). Among the 1,689 UniGene clusters, 1,318 UniGene clusters were functionally classified to be associated with GO terms corresponding to biological processes. These 1,318 genes were identified to be involved in various basic cellular functions. While a high proportion of the previously reported traditional HKGs encode metabolism and ribosome proteins (Eisenberg E & Levanon E Y, Trends Genet 19:362-5, 2003; Hsiao L L et al., Physiol Genomics 7:97-104, 2001), genes encoding proteins involved in protein fate (23%, 308 / 1318) and cellular transport (21%, 273 / 1...


PUM

PropertyMeasurementUnit
Electric chargeaaaaaaaaaa
Volumeaaaaaaaaaa
Volumeaaaaaaaaaa

Abstract

Disclosed are a data processing and analysis method of gene expression data for identifying endogenous reference genes and a composition for the quantitative analysis of gene expression, comprising a pair of primers and / or probes useful in the amplification of the identified endogenous reference genes. Introduced with the concepts of “Zero's proportion’ and CV, the me allows different datasets to be integrally analyzed, thereby searching for novel reference genes. By the method, 2,087 genes are first found as housekeeping genes which are expressed in most tissues, and the usefulness thereof in the relative quantification of different target genes is determined by analyzing their expression stability. Out of the 2,087 genes, 13 genes are found to show higher expression stability with lower expression levels across a wide range of samples than traditional reference genes such as GAPDH and ACTB, and therefore are suitable for the normalization of universal genes having relatively low expression levels.

Description

TECHNICAL FIELD [0001]The present invention relates to a data processing and analysis method of gene expression data for identifying endogenous reference genes and a composition for the quantitative analysis of gene expression, comprising a pair of primers and / or probes useful in the amplification of the identified endogenous reference genes. More particularly, the present invention relates to a data processing and analysis method for identifying novel endogenous reference genes using gene expression data from EST, SAGE and microarray datasets with zero's proportion and coefficient of variation, and a composition for the quantitative analysis of gene expression, comprising a pair of primers and / or probes useful in the amplification of the identified endogenous reference genes.BACKGROUND ART [0002]As many as 50,000-100,000 genes can be found in each human cell, but are selectively used in each cell. Of them, a significant number of genes are involved in basic functions and routine ce...

Claims


Application Information

Patent Timeline
IPC IPC(8): C40B30/02C40B40/08C12Q1/68G06F19/00G16B25/10
CPCC12Q1/6813C12Q1/6851G06F19/20C12Q2545/113C12Q2545/101C12Q2600/166G16B25/00G16B25/10C40B40/06
Inventor SHINKWON, MI JEONGOH, EN SELIN, YONG HOKOH, SANG SEOK
Owner SEOUL NAT UNIV R&DB FOUND
Learn More