
Demand Control System, Demand Controller, Demand Program, and Demand Controlling Method

Inactive Publication Date: 2010-08-12
SANYO ELECTRIC CO LTD
View PDF6 Cites 27 Cited by
  • Summary
  • Abstract
  • Description
  • Claims
  • Application Information

AI Technical Summary

Benefits of technology

[0011]In view of the foregoing problems, it is an object of the present invention to provide a demand control system, a demand controller, a demand program, and a demand controlling method, which are capable of improving accuracy of calculating a predicted integration value and optimizing a power target value.
[0029]According to the present invention, it is possible to improve accuracy of calculating a predicted integration value and to optimize a power target value.

Problems solved by technology

Therefore, approximation of the transition after the present time is not guaranteed at all.
Accordingly, the predicted integration value is not always calculated with high accuracy.
For this reason, the contract rate may become high if the power target value is set too high as a result of failure to set up the power target value properly.
In contrast, the environment may be deteriorated if the power target value is set too low.

Method used


Image

  • Demand Control System, Demand Controller, Demand Program, and Demand Controlling Method
  • Demand Control System, Demand Controller, Demand Program, and Demand Controlling Method
  • Demand Control System, Demand Controller, Demand Program, and Demand Controlling Method

Examples


first embodiment

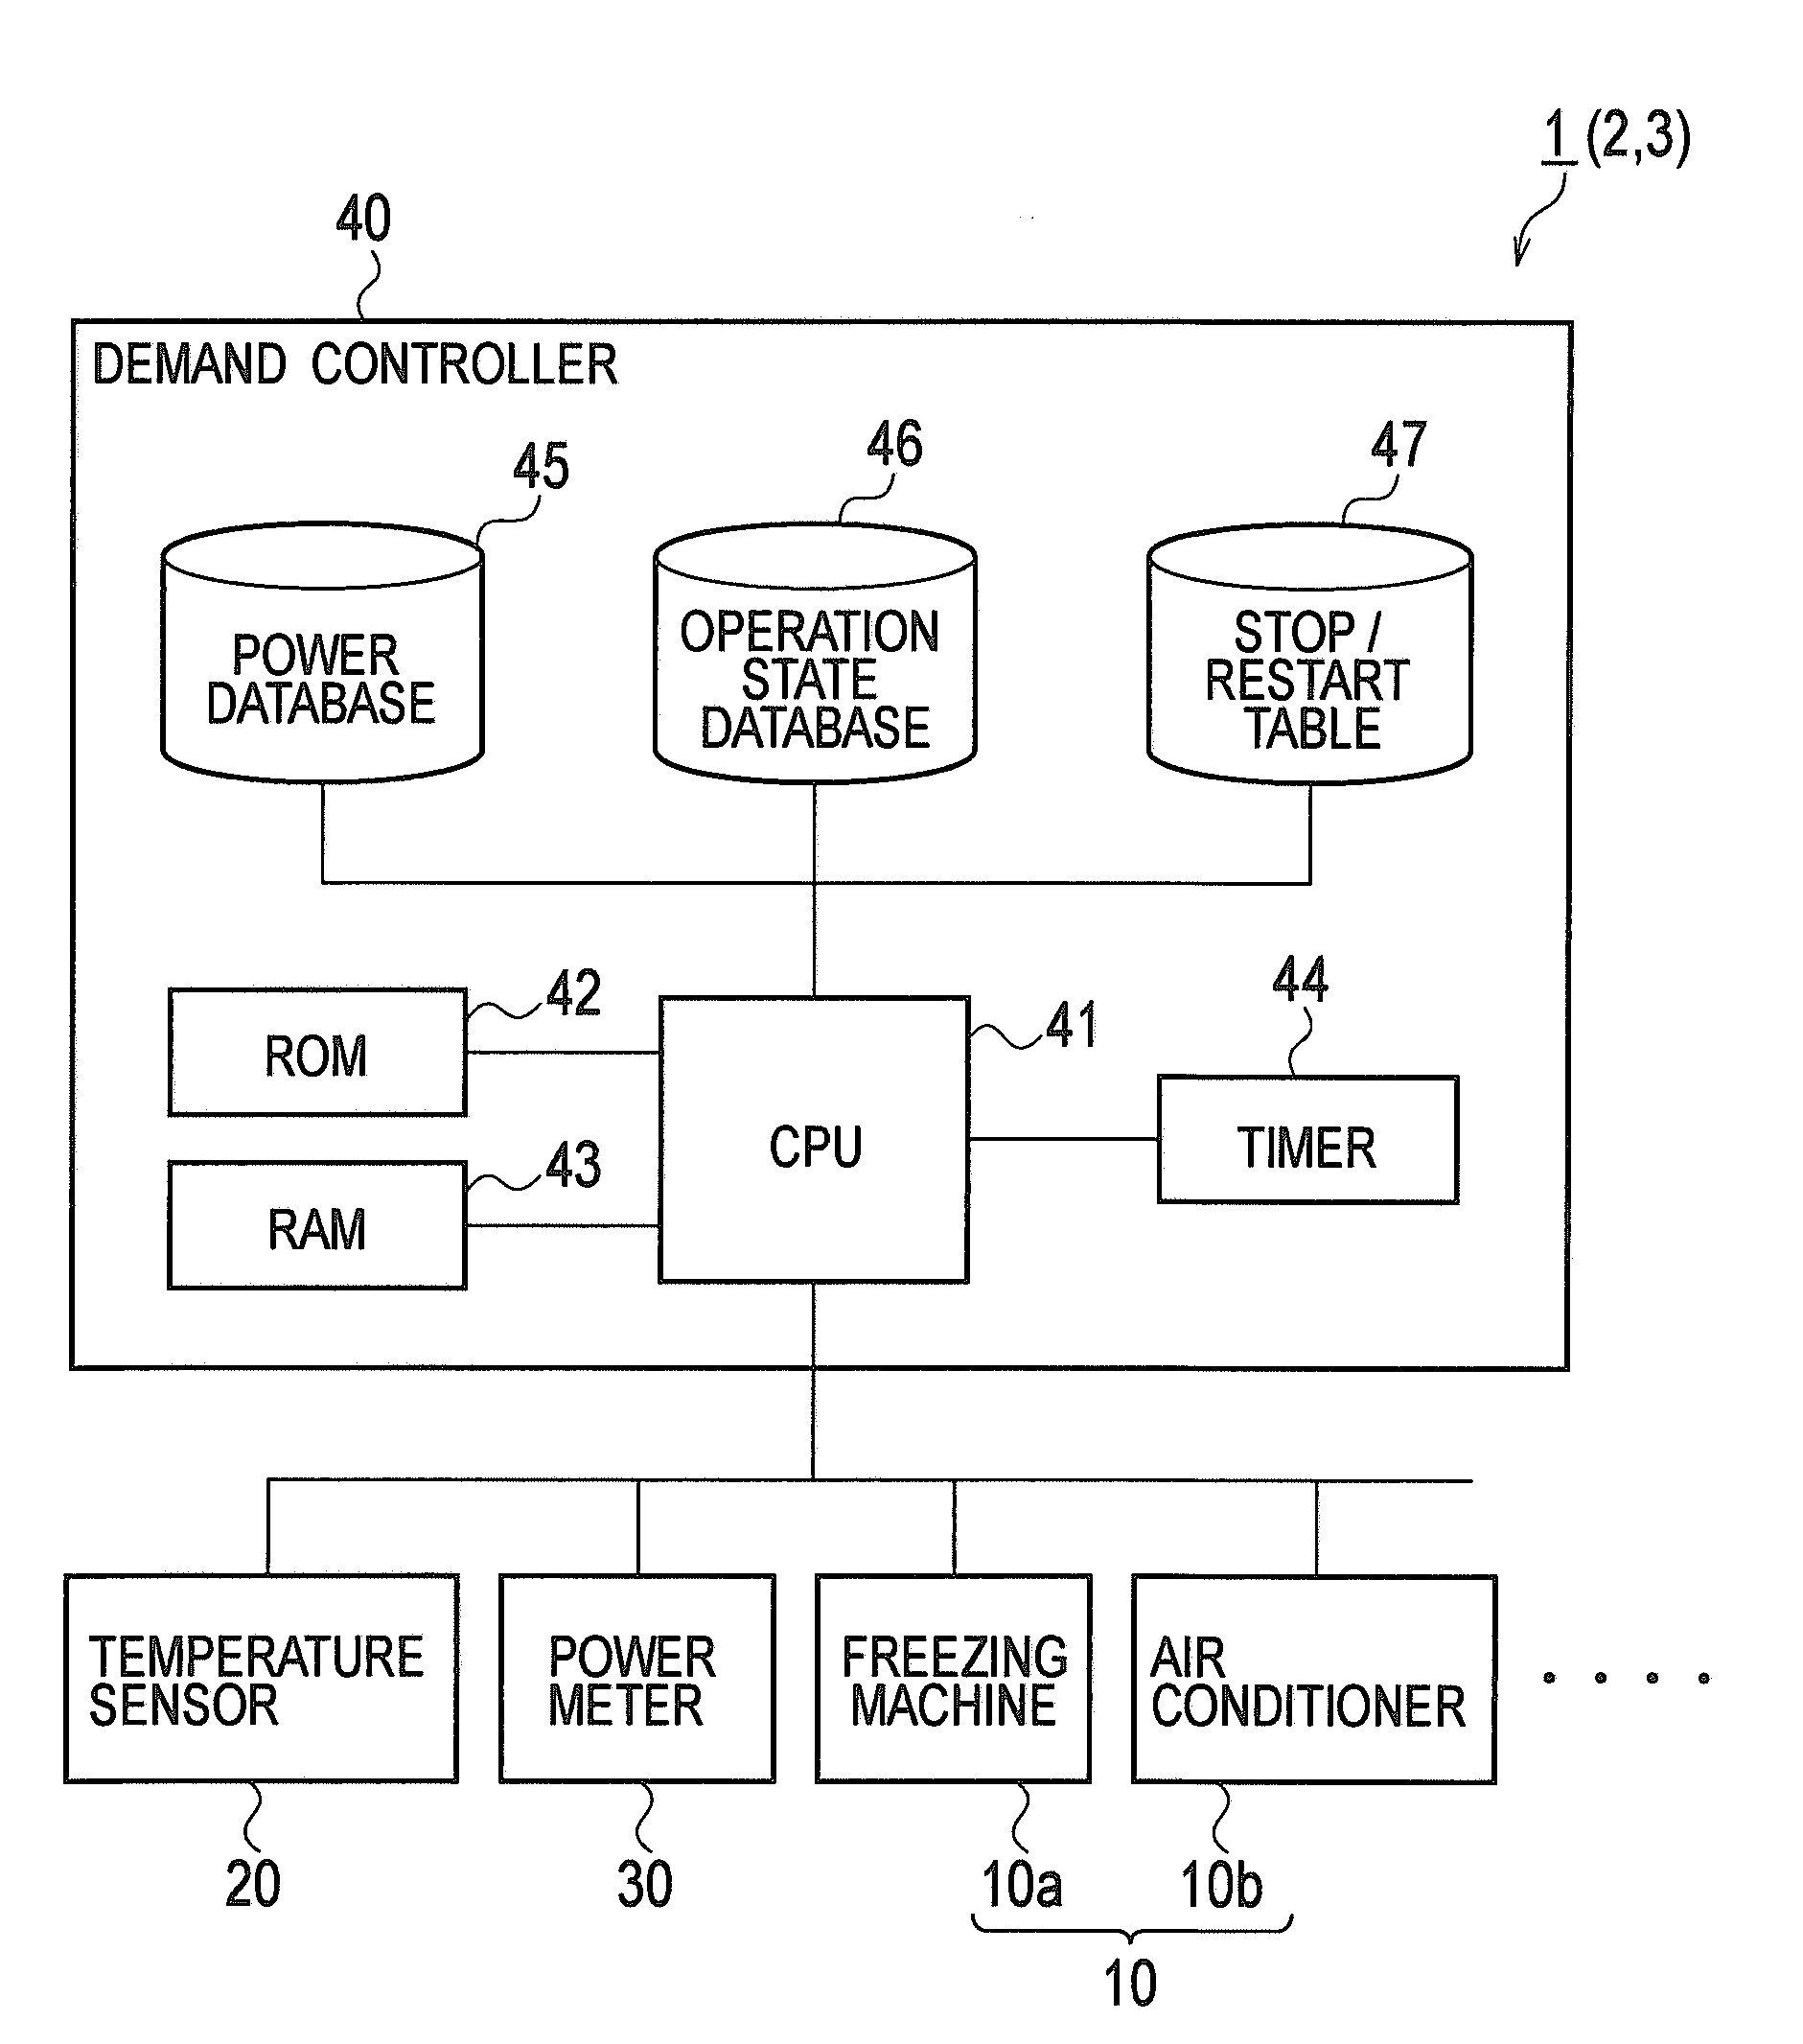
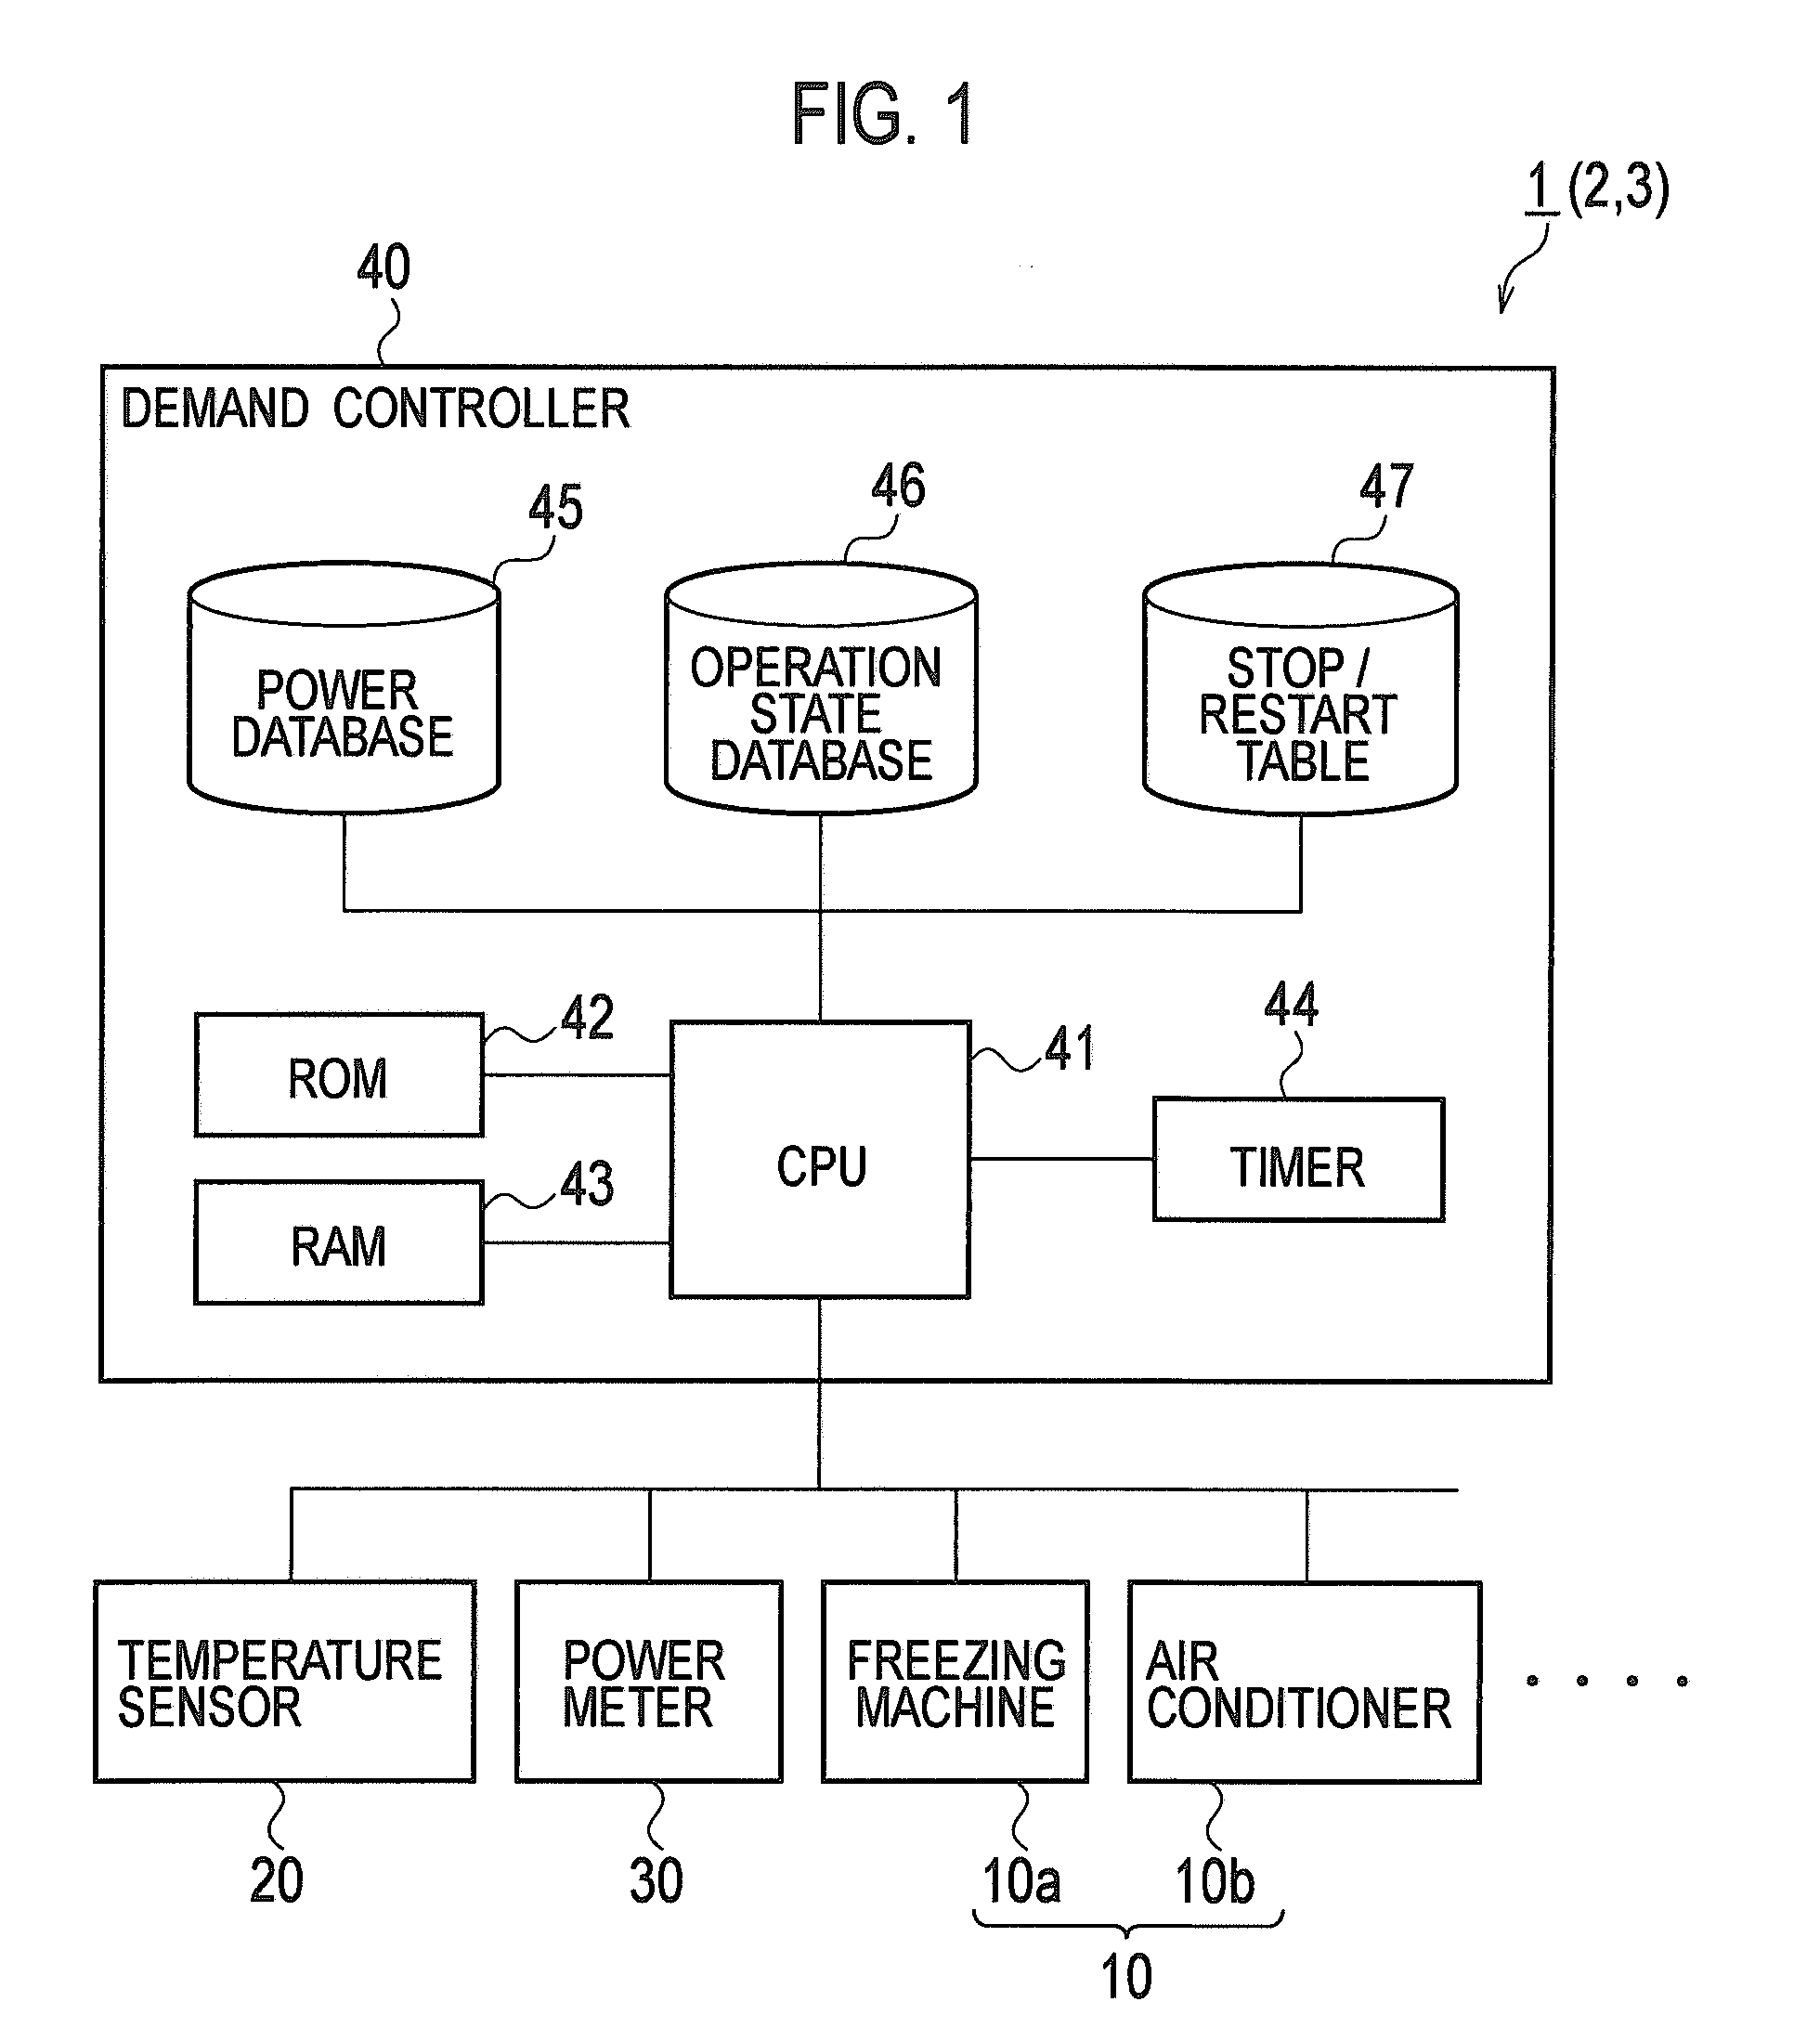
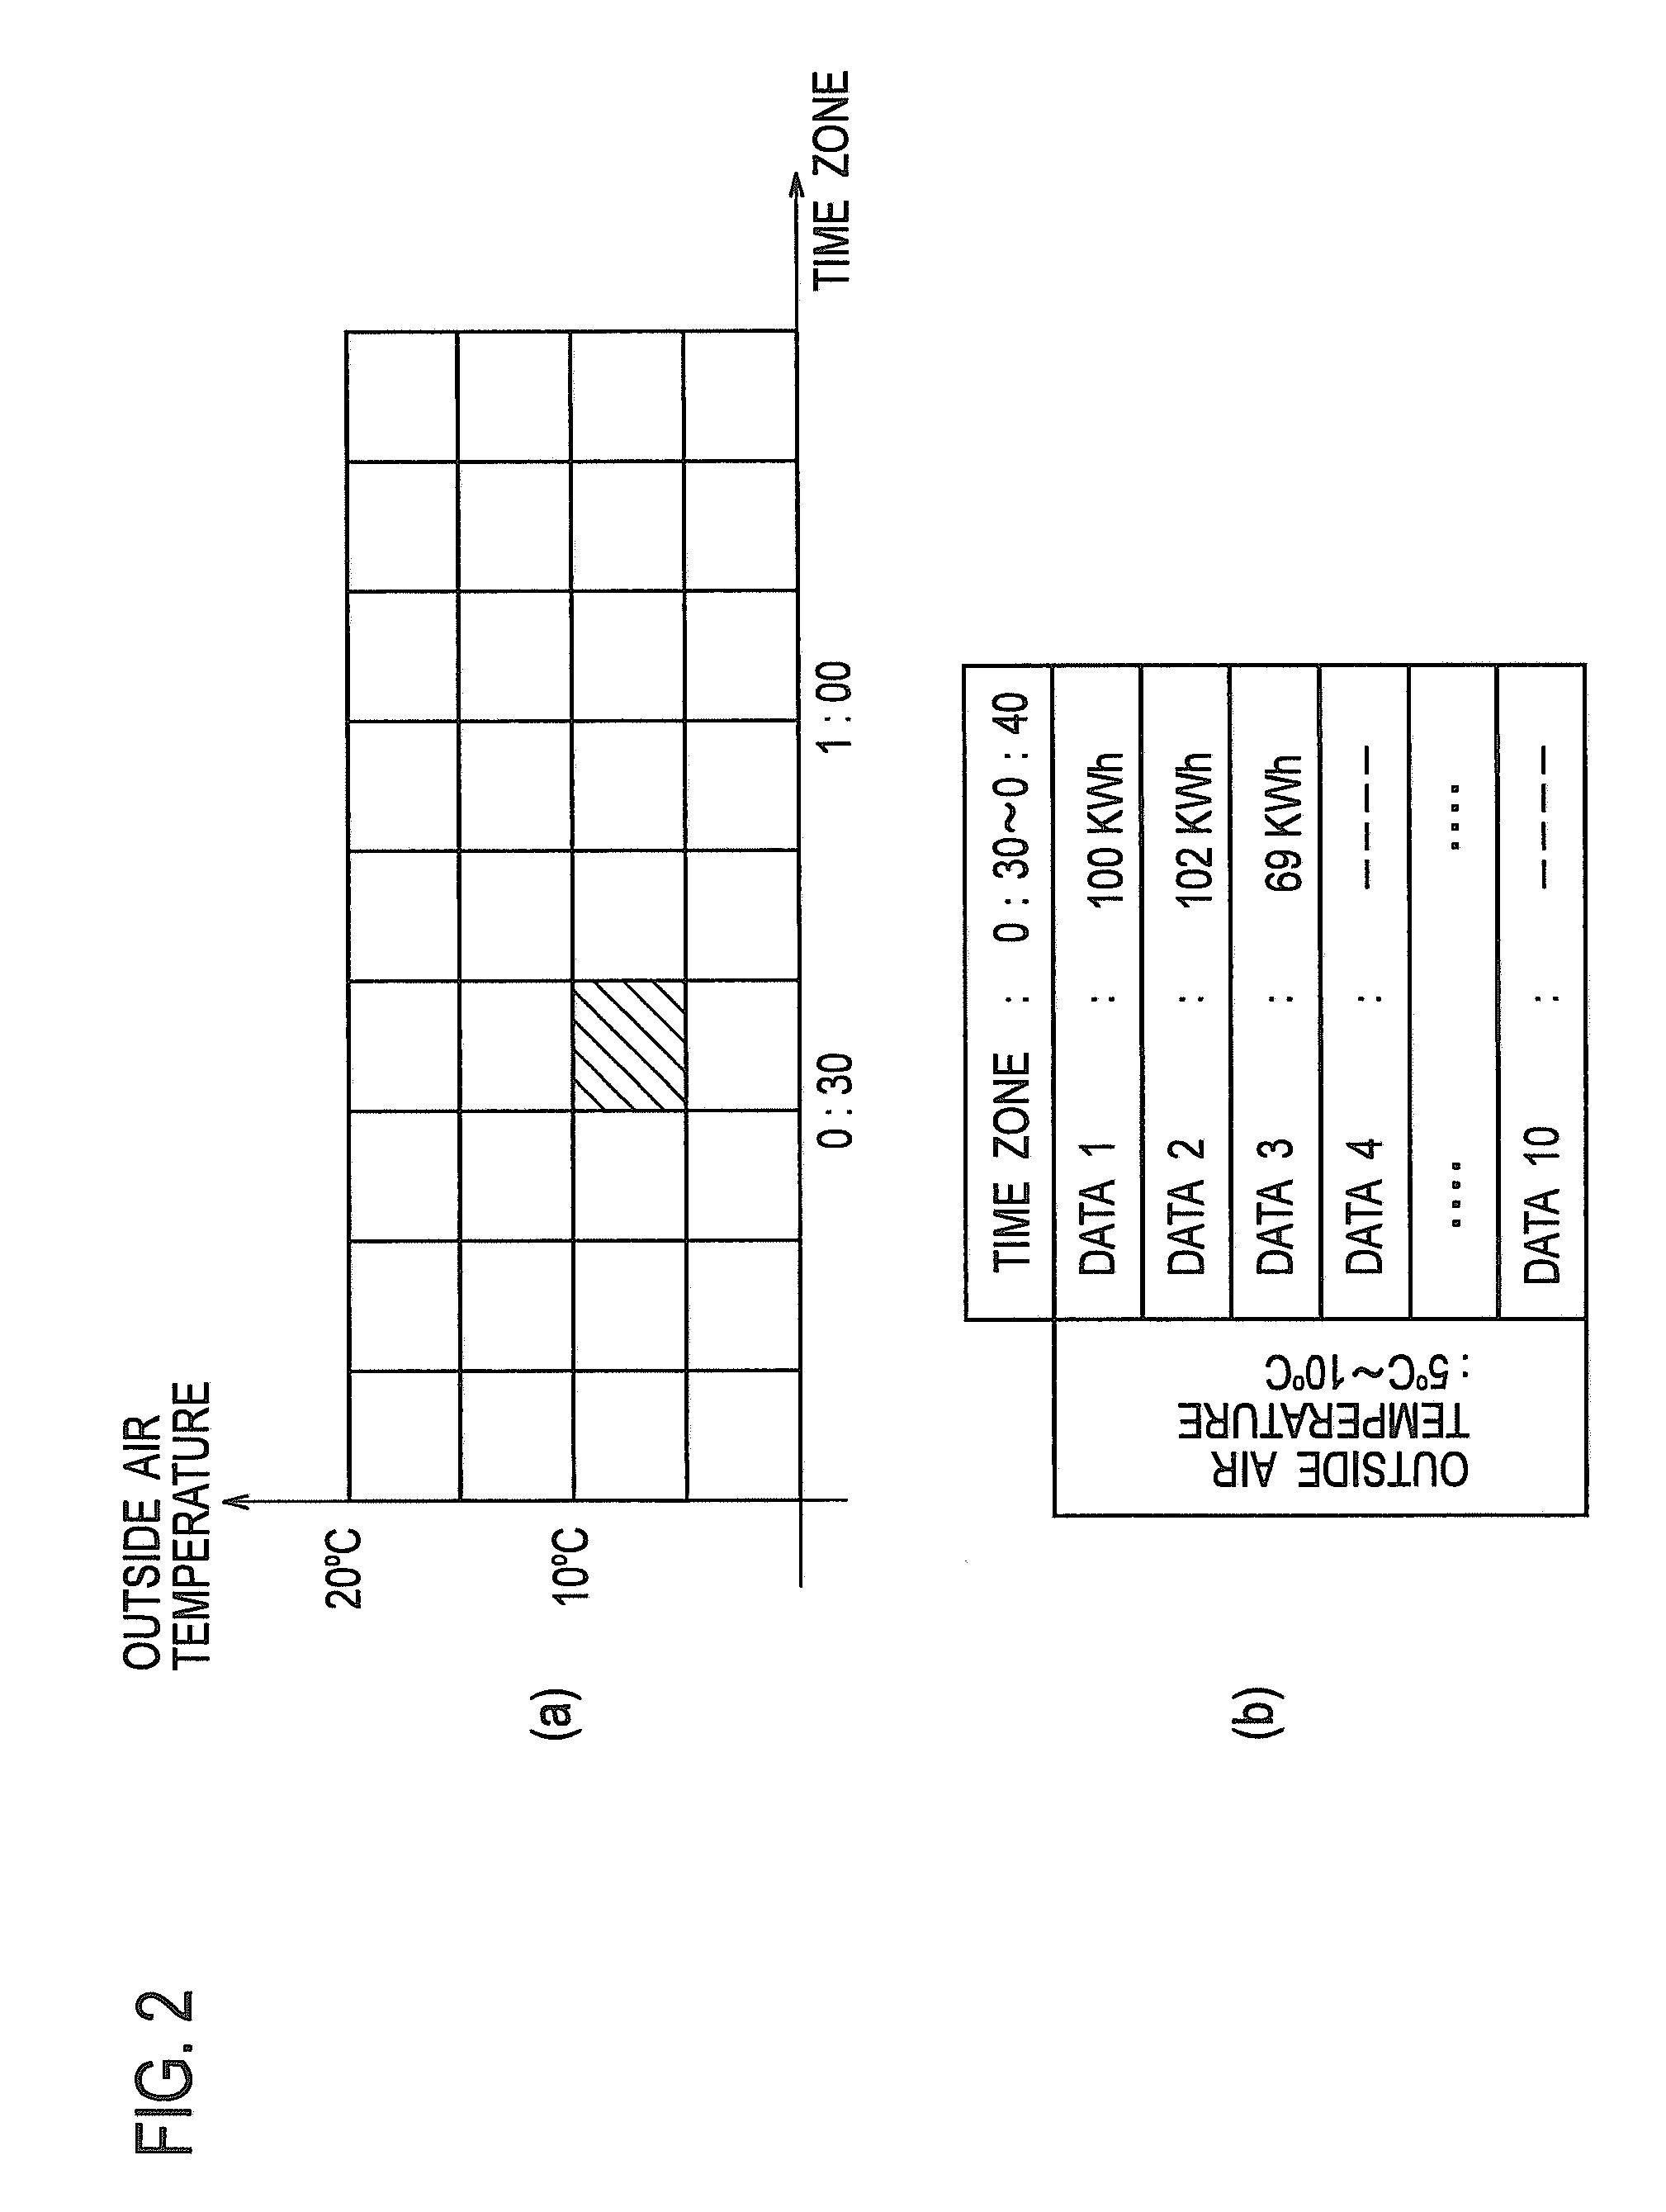
[0053]Here, in this embodiment, the CPU 41 is configured to calculate the predicted integration value of the power predicted to be consumed in a current demand time period at the start of the current demand time period. For example, when the demand time period is sectioned by 30 minutes, the CPU 41 calculates the predicted integration value of the power predicted to be consumed from 0:30 to 1:00 at the time of 0:30. Similarly, the CPU 41 calculates the predicted integration value of the power predicted to be consumed from 1:00 to 1:30 at the time of 1:00, and calculates the predicted integration value of the power predicted to be consumed from 1:30 to 2:00 at the time of 1:30. Alternatively, the CPU 41 may be configured to calculate the predicted integration value of the power predicted to be consumed in the current demand time period before the start of the current demand time period. Now, in a first embodiment, an example is described in which the predicted integration value is ca...

second embodiment

[0086]FIG. 11 is a flowchart showing the demand controlling method and illustrates details of the prediction control processing (step S11) at the start of the demand time period shown in FIG. 6. Here, the processing from step S71 to step S85 shown in FIG. 11 is similar to the processing from step S21 to step S35 shown in FIG. 7, and description thereof will be omitted.

[0087]In step S77, when a determination is made that the predicted integration value X does not exceed the power target value Y (step S77: NO), the CPU 41 calculates the predicted integration value Xn+1 in the subsequent demand time period (step S86). The predicted integration value Xn+1 in the subsequent demand time period is calculated by the processing similar to step S72 to step S76.

[0088]Thereafter, the CPU 41 determines whether or not the predicted integration value Xn+1 in the subsequent demand time period exceeds the power target value Y (step S87). When a determination is made that the predicted integration v...

third embodiment

[0093]In a demand control system 3 the CPU 41 causes the RAM (a maximum power storage unit) 43 to store a maximum integration value among the consumption integration values of power actually consumed in respective demand time periods in a current month. Here, instead of the RAM 43, the CPU 41 may cause other storage media to store the value.

[0094]Moreover, the CPU 41 is configured to execute processing as shown in FIG. 12. FIG. 12 is a view showing processing contents of the demand control system 3 according to the third embodiment. FIG. 12(a) shows a case where the predicted integration value X in the current demand time period Y is equal to or below the power target value Y as well as being equal to or below a maximum integration value Smax. In this case, the CPU 41 changes the power target value Y in the current demand time period to the maximum integration value Smax (see FIG. 12(b)). Note that, in the demand contract method, the rate is set up based on the maximum integration ...


PUM


Abstract

A demand control system 1 according to the present invention includes a CPU 41 and a power database 45. The power database 45 stores actual data in a state where the actual data are classified according to environmental conditions, the actual data being based on a consumption integration value of power actually consumed by the power consuming device. The CPU 41 calculates a predicted integration value of power predicted to be consumed in the demand time period, by using contents stored in the power database 45 at a start or before the start of the current demand time period. Further, the CPU 41 lowers a power target value when the calculated predicted integration value falls below the power target value being a target value of the power to be consumed in the demand time period.

Description

TECHNICAL FIELD[0001]The present invention relates to a demand control system, a demand controller, a demand program, and a demand controlling method.BACKGROUND ART[0002]An demand contract method is known as one of contract methods used for an electricity rate contract made between a shop or facility owner and a power company. In the demand contract method, a contract rate is determined in the following way. Specifically, an integration value of power consumption (hereinafter referred to as a power consumption integration value) is calculated for each predetermined time period (hereinafter referred to as a demand time period). Then, the contract rate is set based on the highest power consumption integration value among the power consumption integration values for the respective demand time periods in one year.[0003]Here, the demand time period includes: time periods defined by a predetermined value such as 15 minutes or 30 minutes; time periods defined by a time zone set as having a...

Claims


Application Information

Patent Timeline
IPC IPC(8): G05B19/00
CPCH02J3/14Y04S20/222Y02B70/3225H02J2310/60
Inventor OHUCHI, ATSUSHIKAWAAI, TSUYOSHI
Owner SANYO ELECTRIC CO LTD
Features
  • Generate Ideas
  • Intellectual Property
  • Life Sciences
  • Materials
  • Tech Scout
  • Unparalleled Data Quality
  • Higher Quality Content
  • 60% Fewer Hallucinations
Learn More