Method of Visualization of Contrast Intensity Change Over Time in a DSA Image
- Summary
- Abstract
- Description
- Claims
- Application Information
AI Technical Summary
Benefits of technology
Problems solved by technology
Method used
Image
Examples
Embodiment Construction
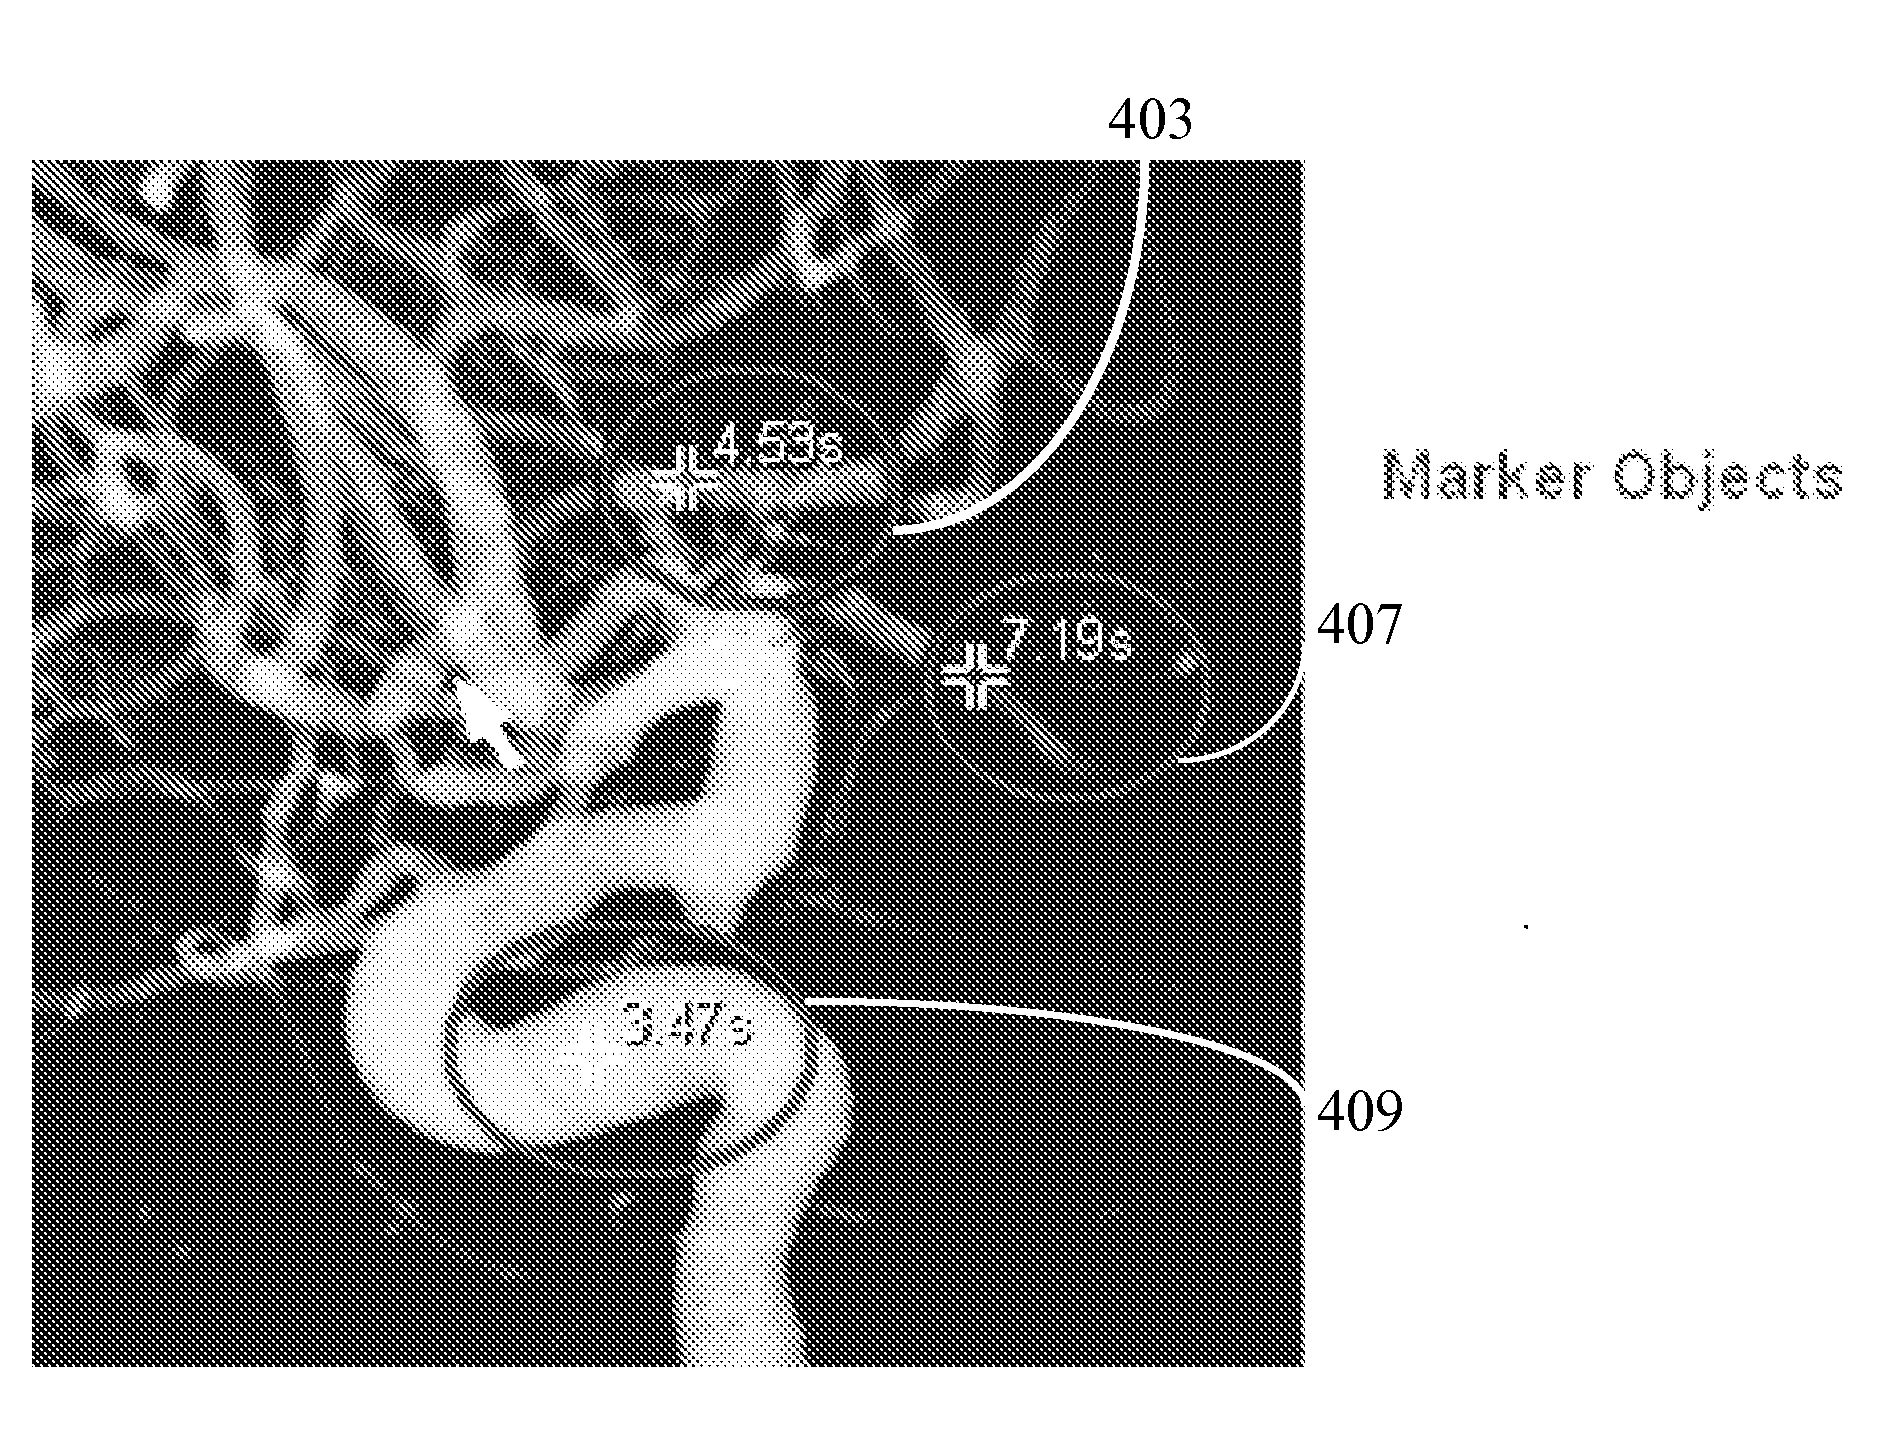
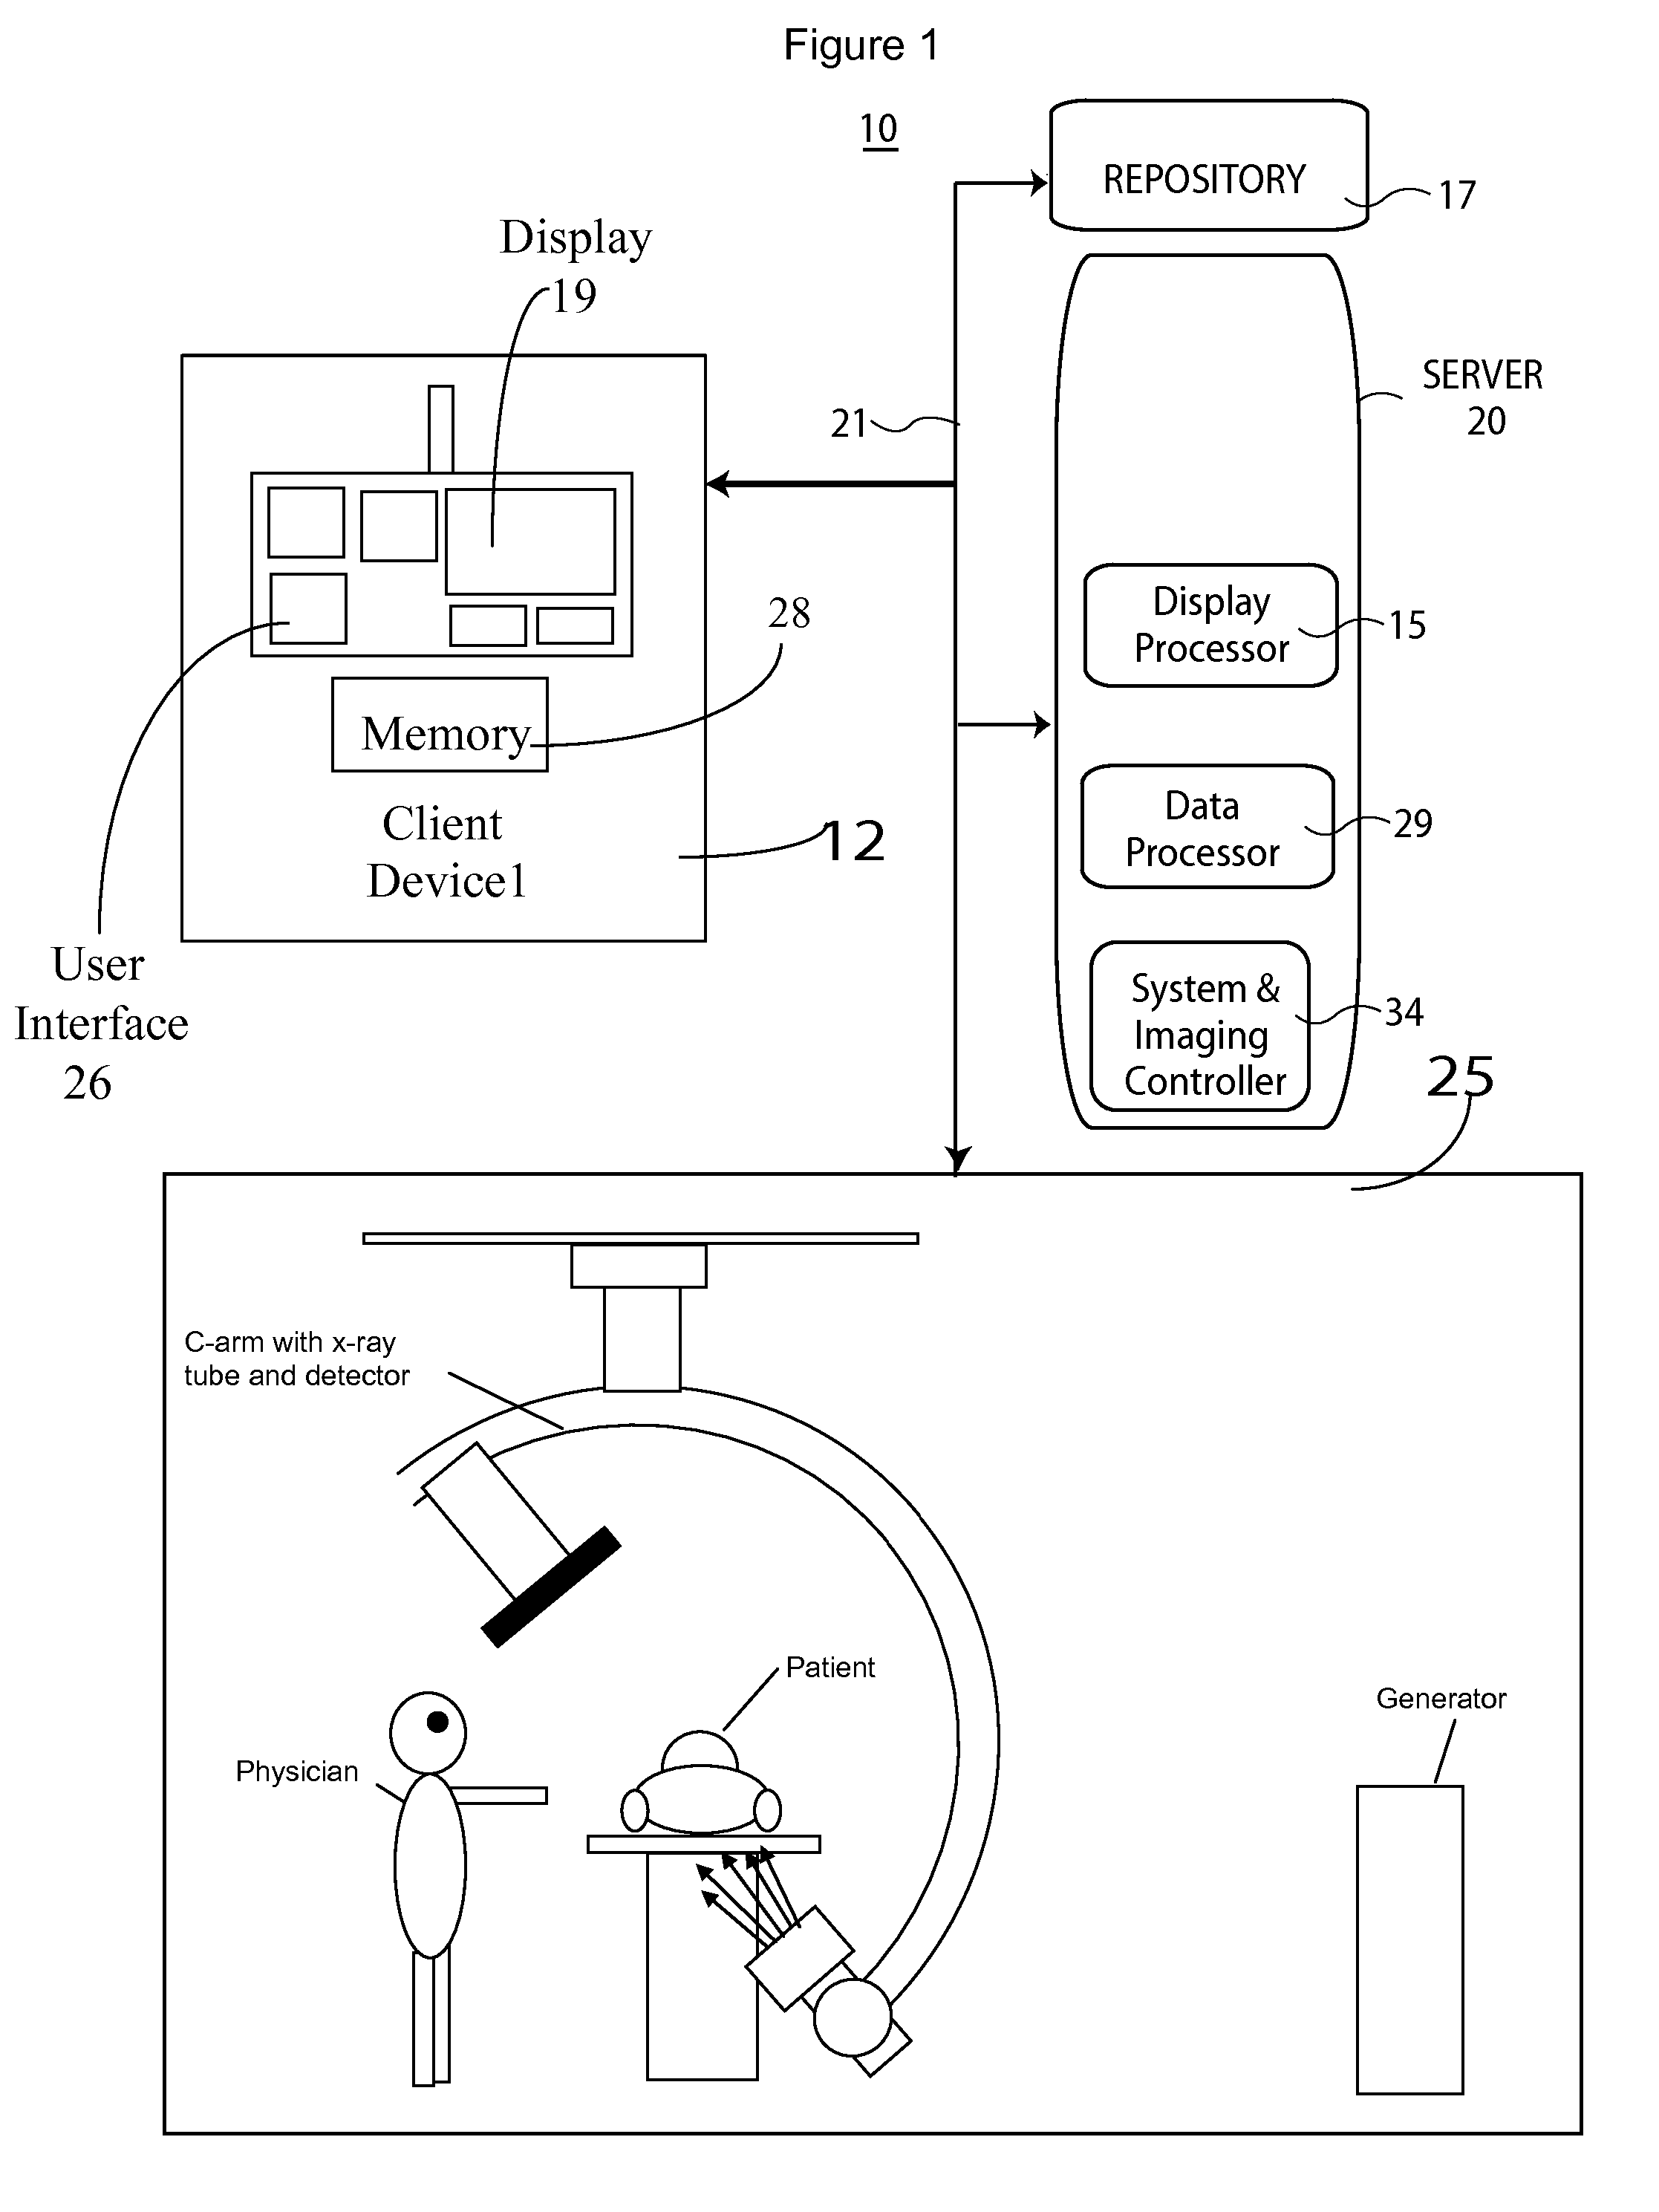
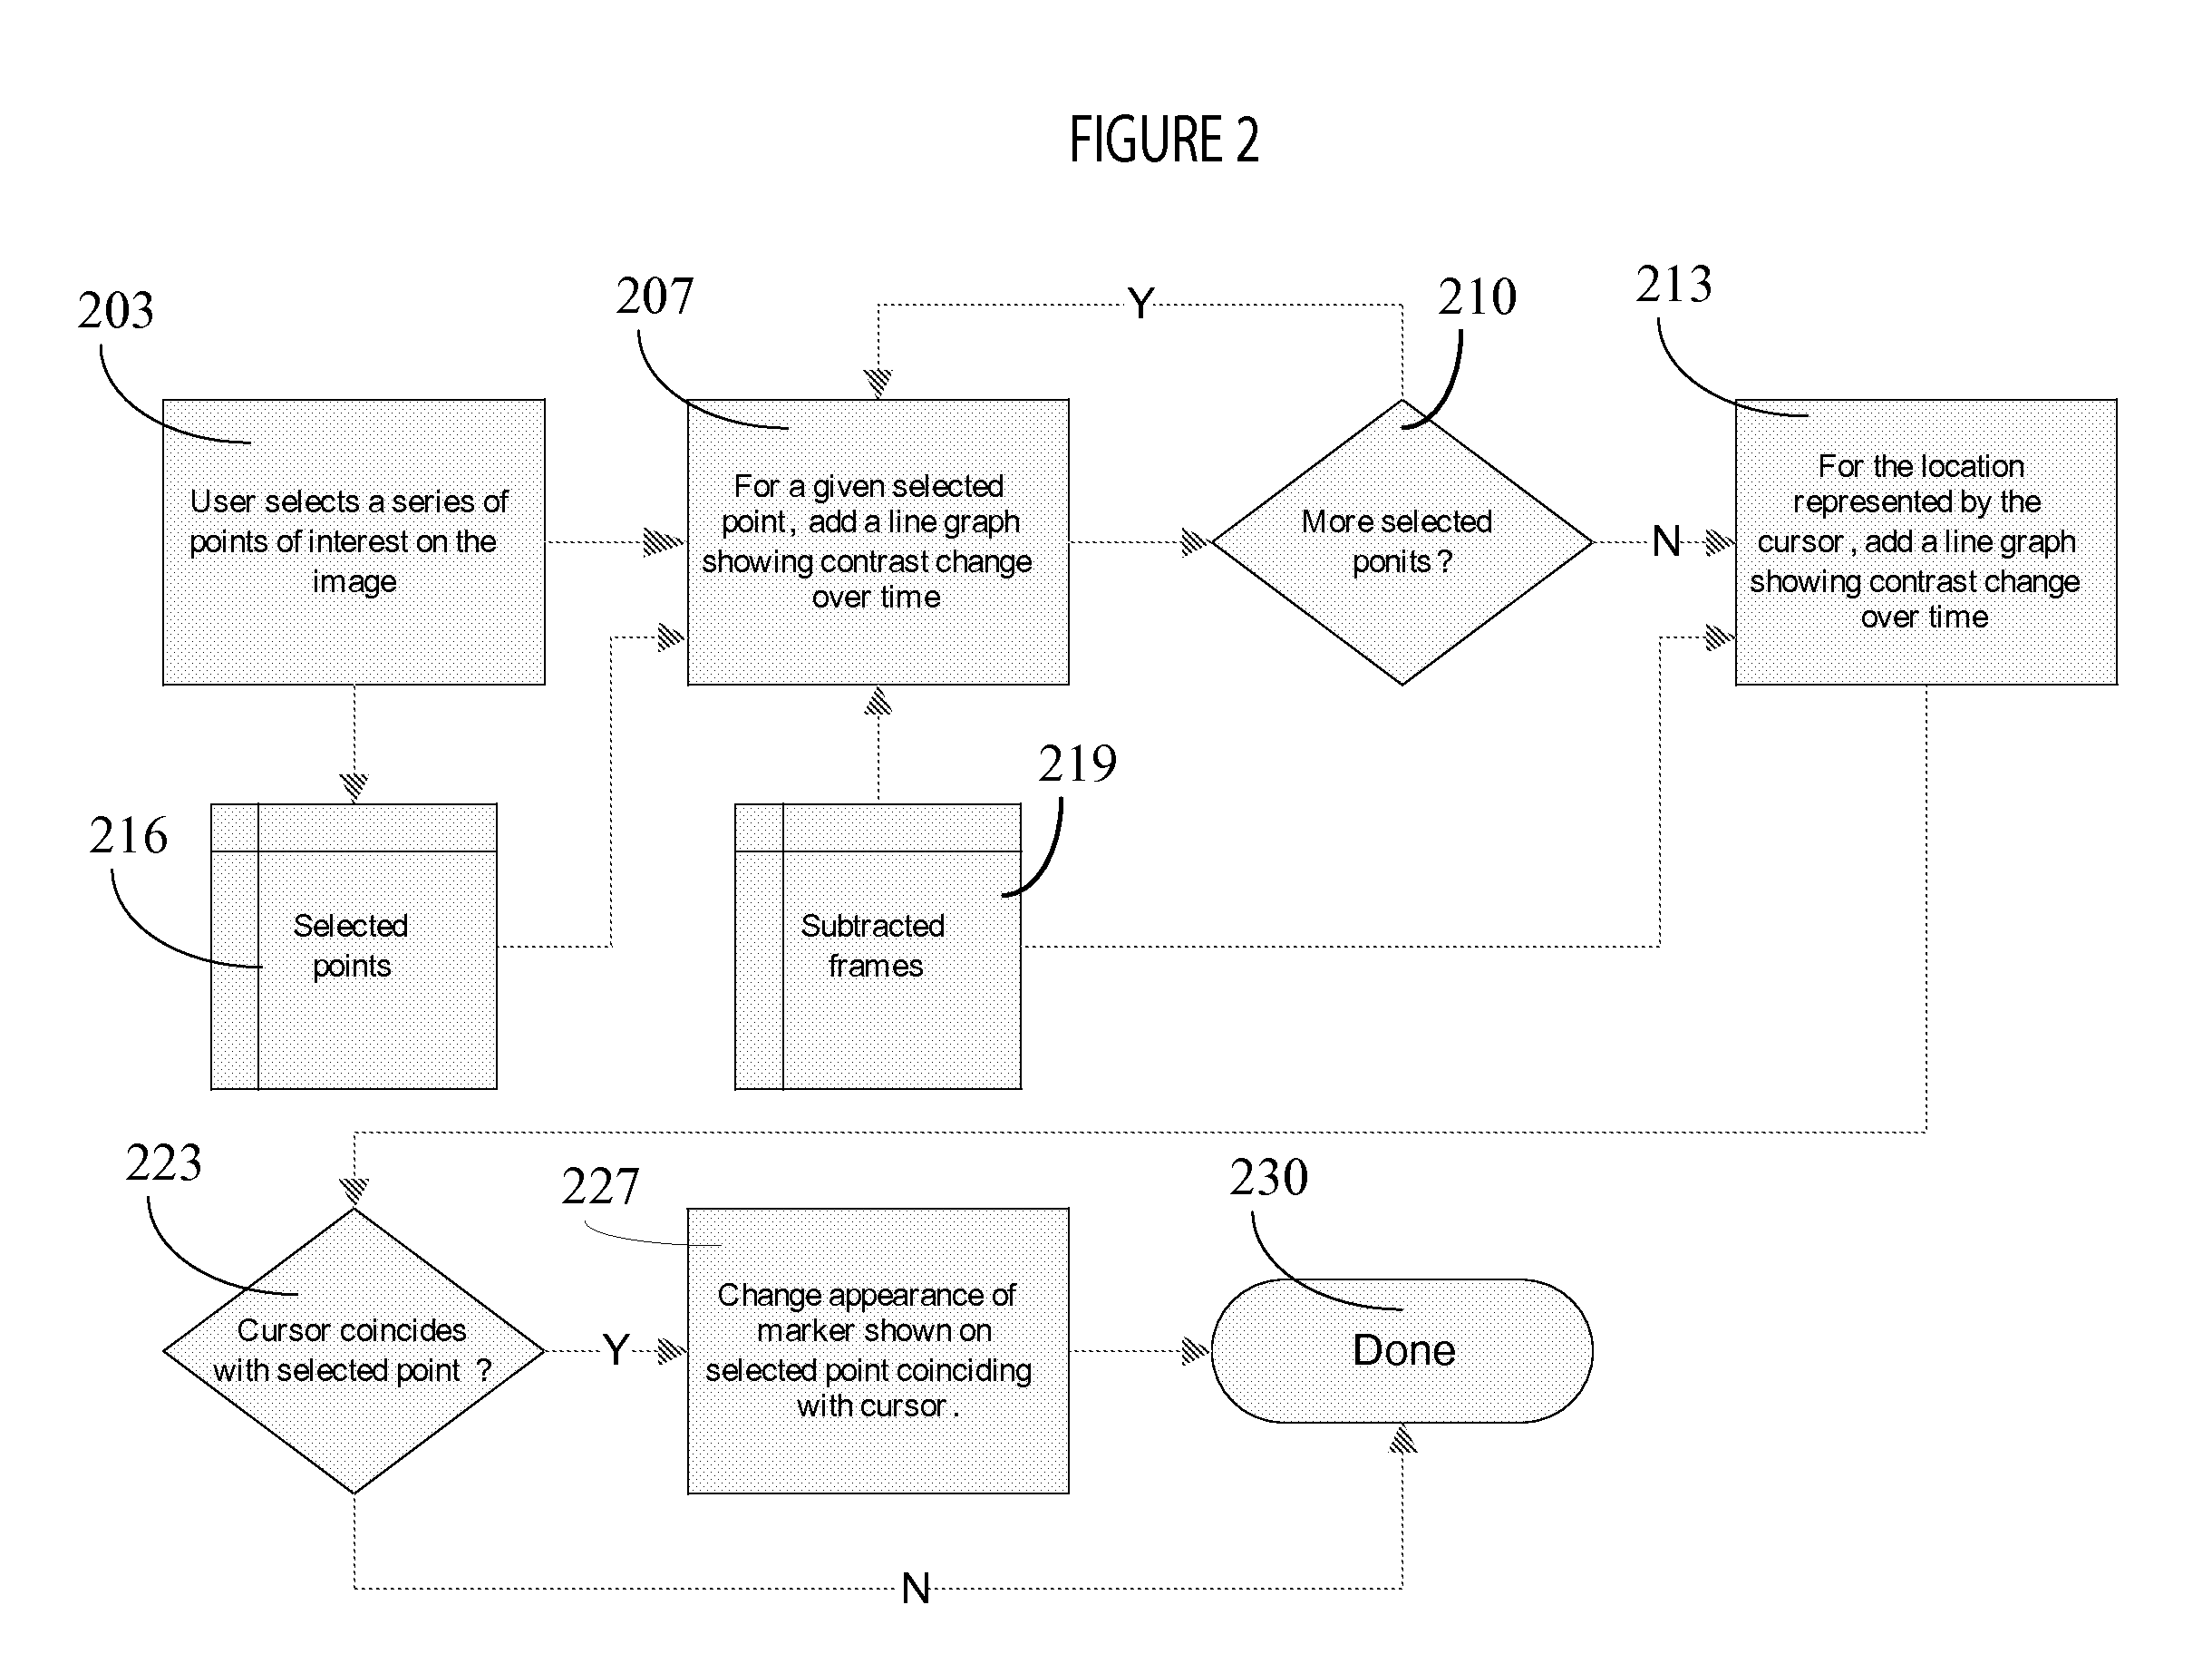
[0011]A system provides a display image enabling a user to visualize and compare blood flow characteristics over time at selected points in an angiographic X-ray image. The system generates a graph of contrast agent intensity (representing blood flow) over time during display of a DSA (digitally subtracted angiography) image, in response to user selection of a point of interest in the DSA image. DSA involves acquiring a reference image (called a mask) which contains only static background detail and is acquired before injection of a contrast agent (e.g., an X-ray opaque dye) into patient anatomy. In order to remove static background detail from images, a mask image is subtracted from subsequent images acquired when a contrast agent is in patient blood which yields a clear picture of blood vessels filled with the contrast agent.
[0012]FIG. 1 shows system and user interface 10 enabling user interaction with a medical vessel structure image to determine individual vessel blood flow char...
PUM
 Abstract
Description
Claims
Application Information
 - R&D
- Intellectual Property
- Life Sciences
- Materials
- Tech Scout
- Unparalleled Data Quality
- Higher Quality Content
- 60% Fewer Hallucinations
Browse by: Latest US Patents, China's latest patents, Technical Efficacy Thesaurus, Application Domain, Technology Topic, Popular Technical Reports.
© 2025 PatSnap. All rights reserved.Legal|Privacy policy|Modern Slavery Act Transparency Statement|Sitemap|About US| Contact US: help@patsnap.com


