Visualization and information display for shapes in displayed graphical images based on user zone of focus

a visualization and information display technology, applied in the field of graphical display by computer systems, can solve the problems of designers losing their place or context, designers often “lost touch” with the layout, and designers may lose context, so as to increase and maintain the user's awareness of the user's context, and improve design efficiency and user satisfaction

Inactive Publication Date: 2011-06-02
CADENCE DESIGN SYST INC
View PDF53 Cites 11 Cited by
  • Summary
  • Abstract
  • Description
  • Claims
  • Application Information

AI Technical Summary

Benefits of technology

[0015]The present inventions allow a user to work within a graphical interface and image to view and edit displayed shapes by viewing descriptive information for the shapes based on a zone of focus for the user's eyes, and thereby increase and maintain the user's awareness of the user's context within the image, leading to greater design efficiency and user satisfaction.

Problems solved by technology

When using existing layout editors, designers often “lose touch” with the layout, i.e. lose their place or context within the layout, during a variety of common tasks.
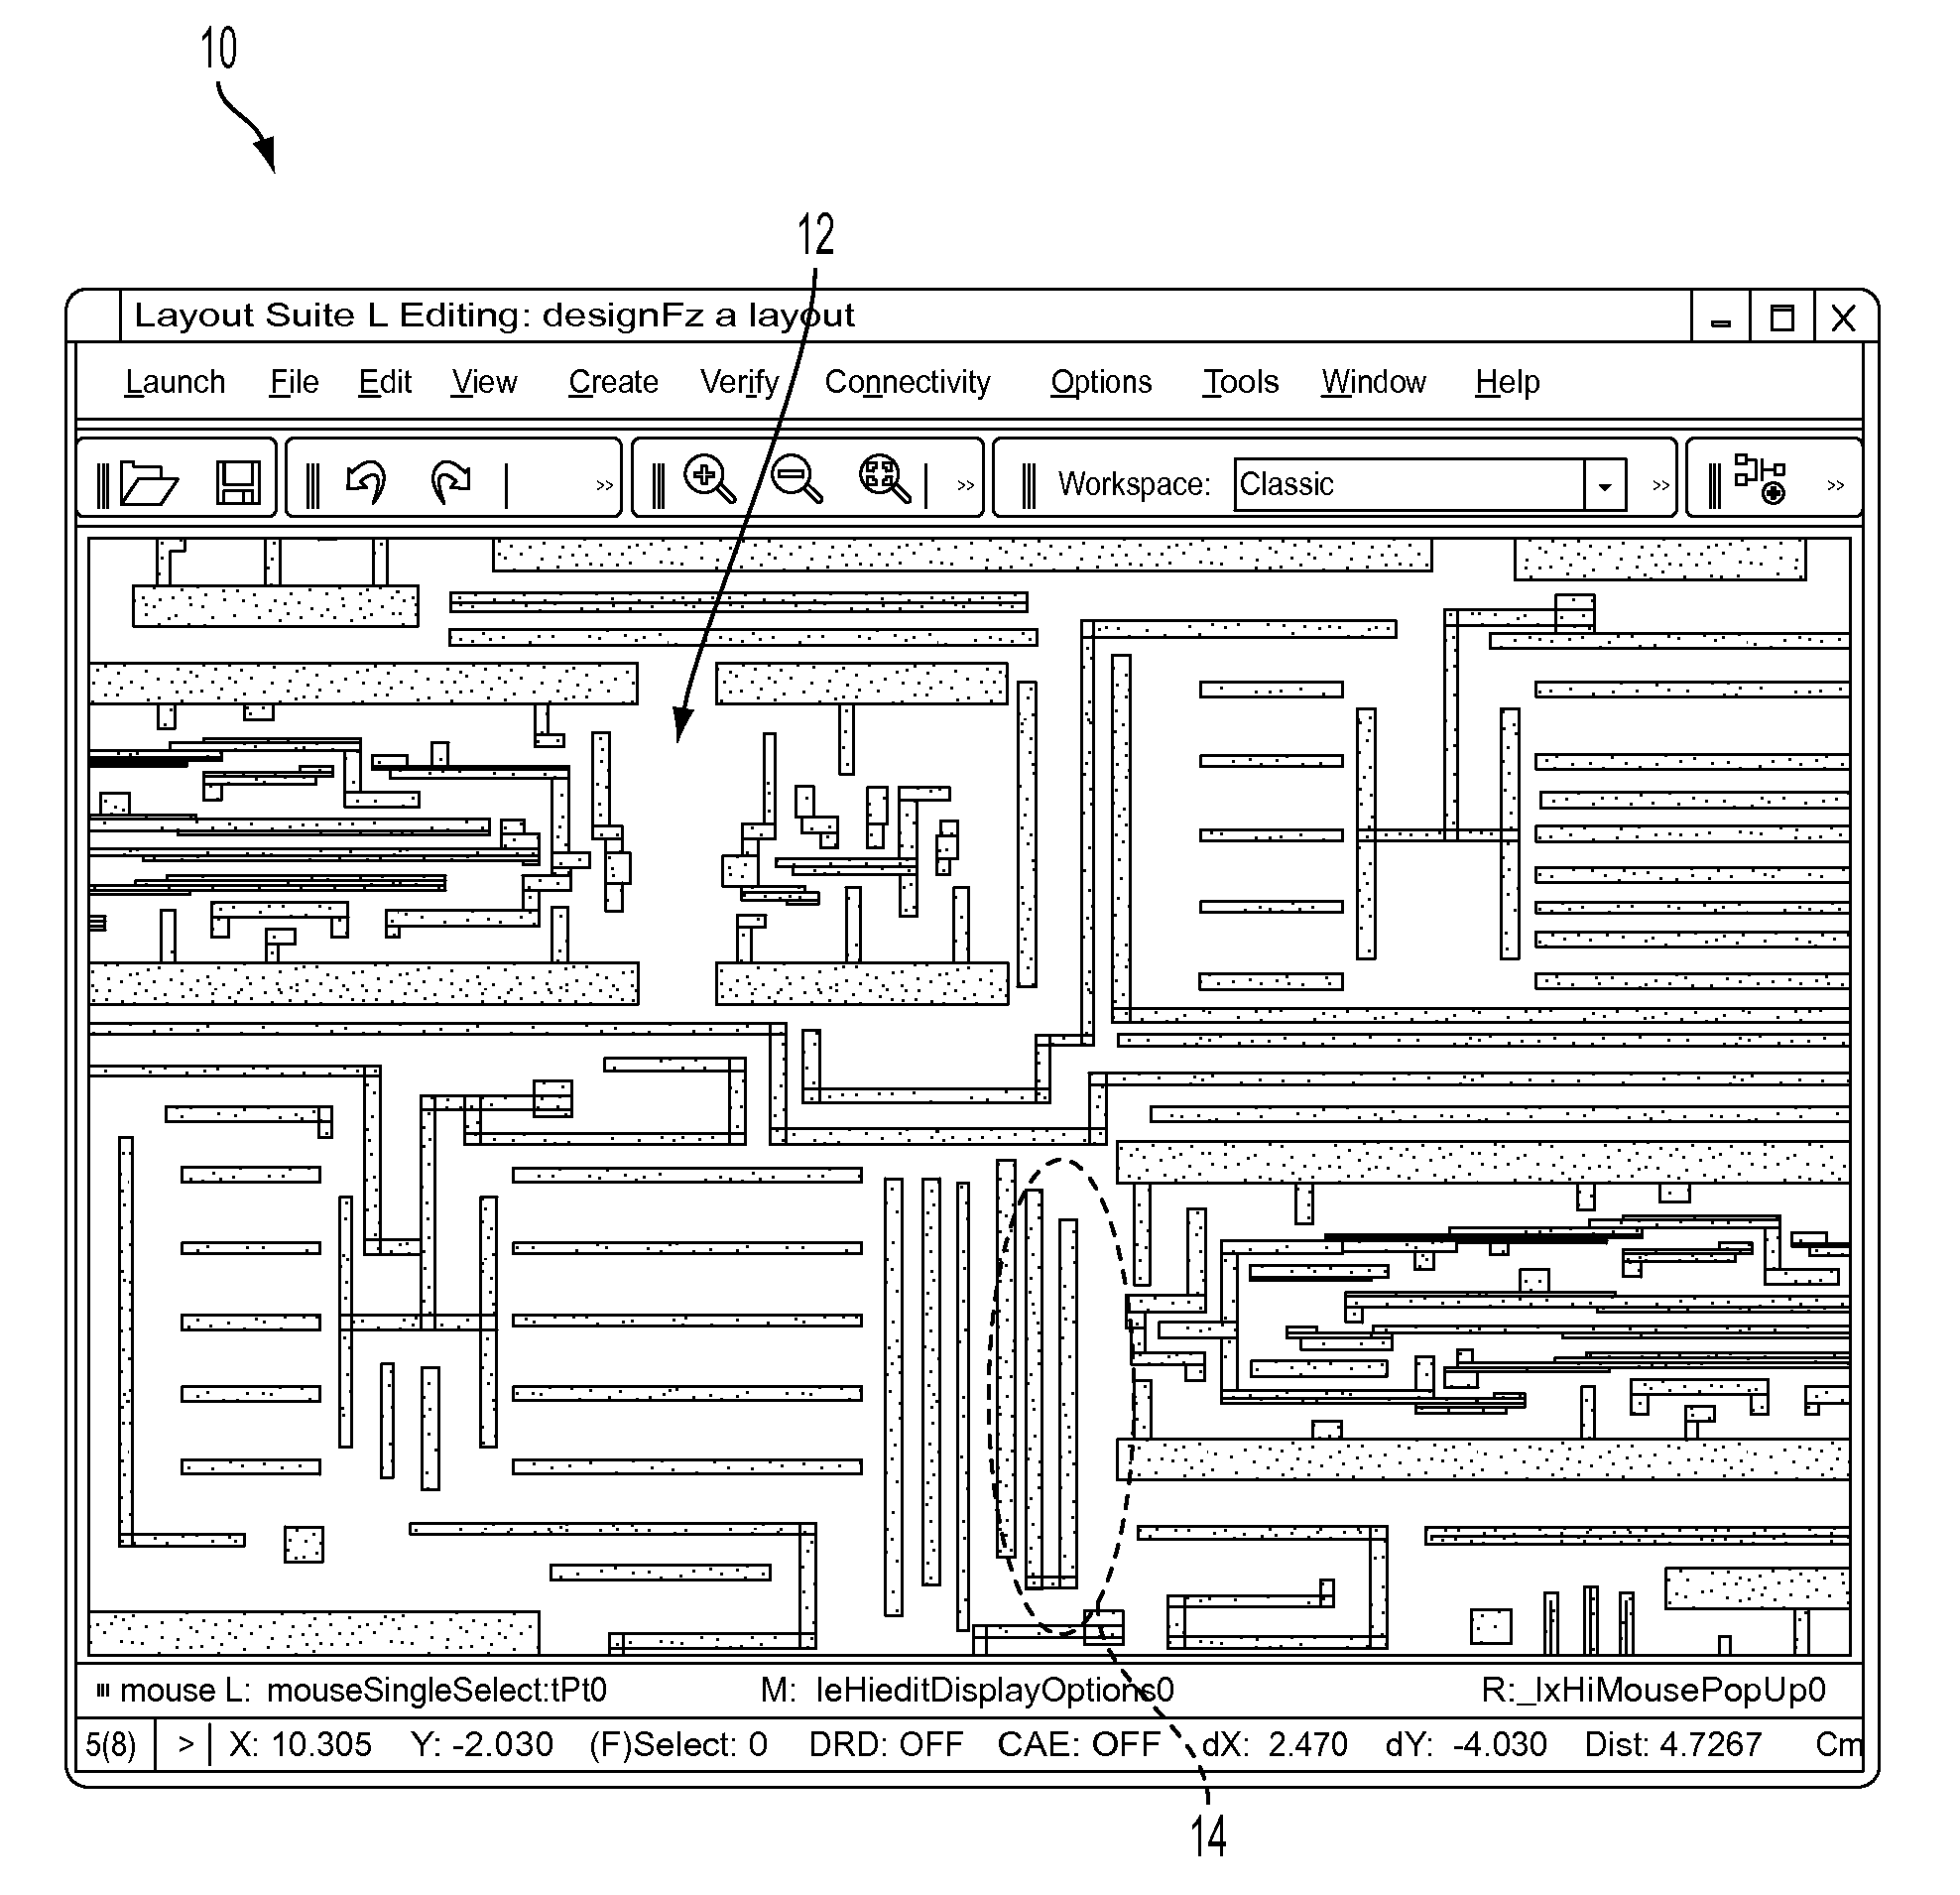
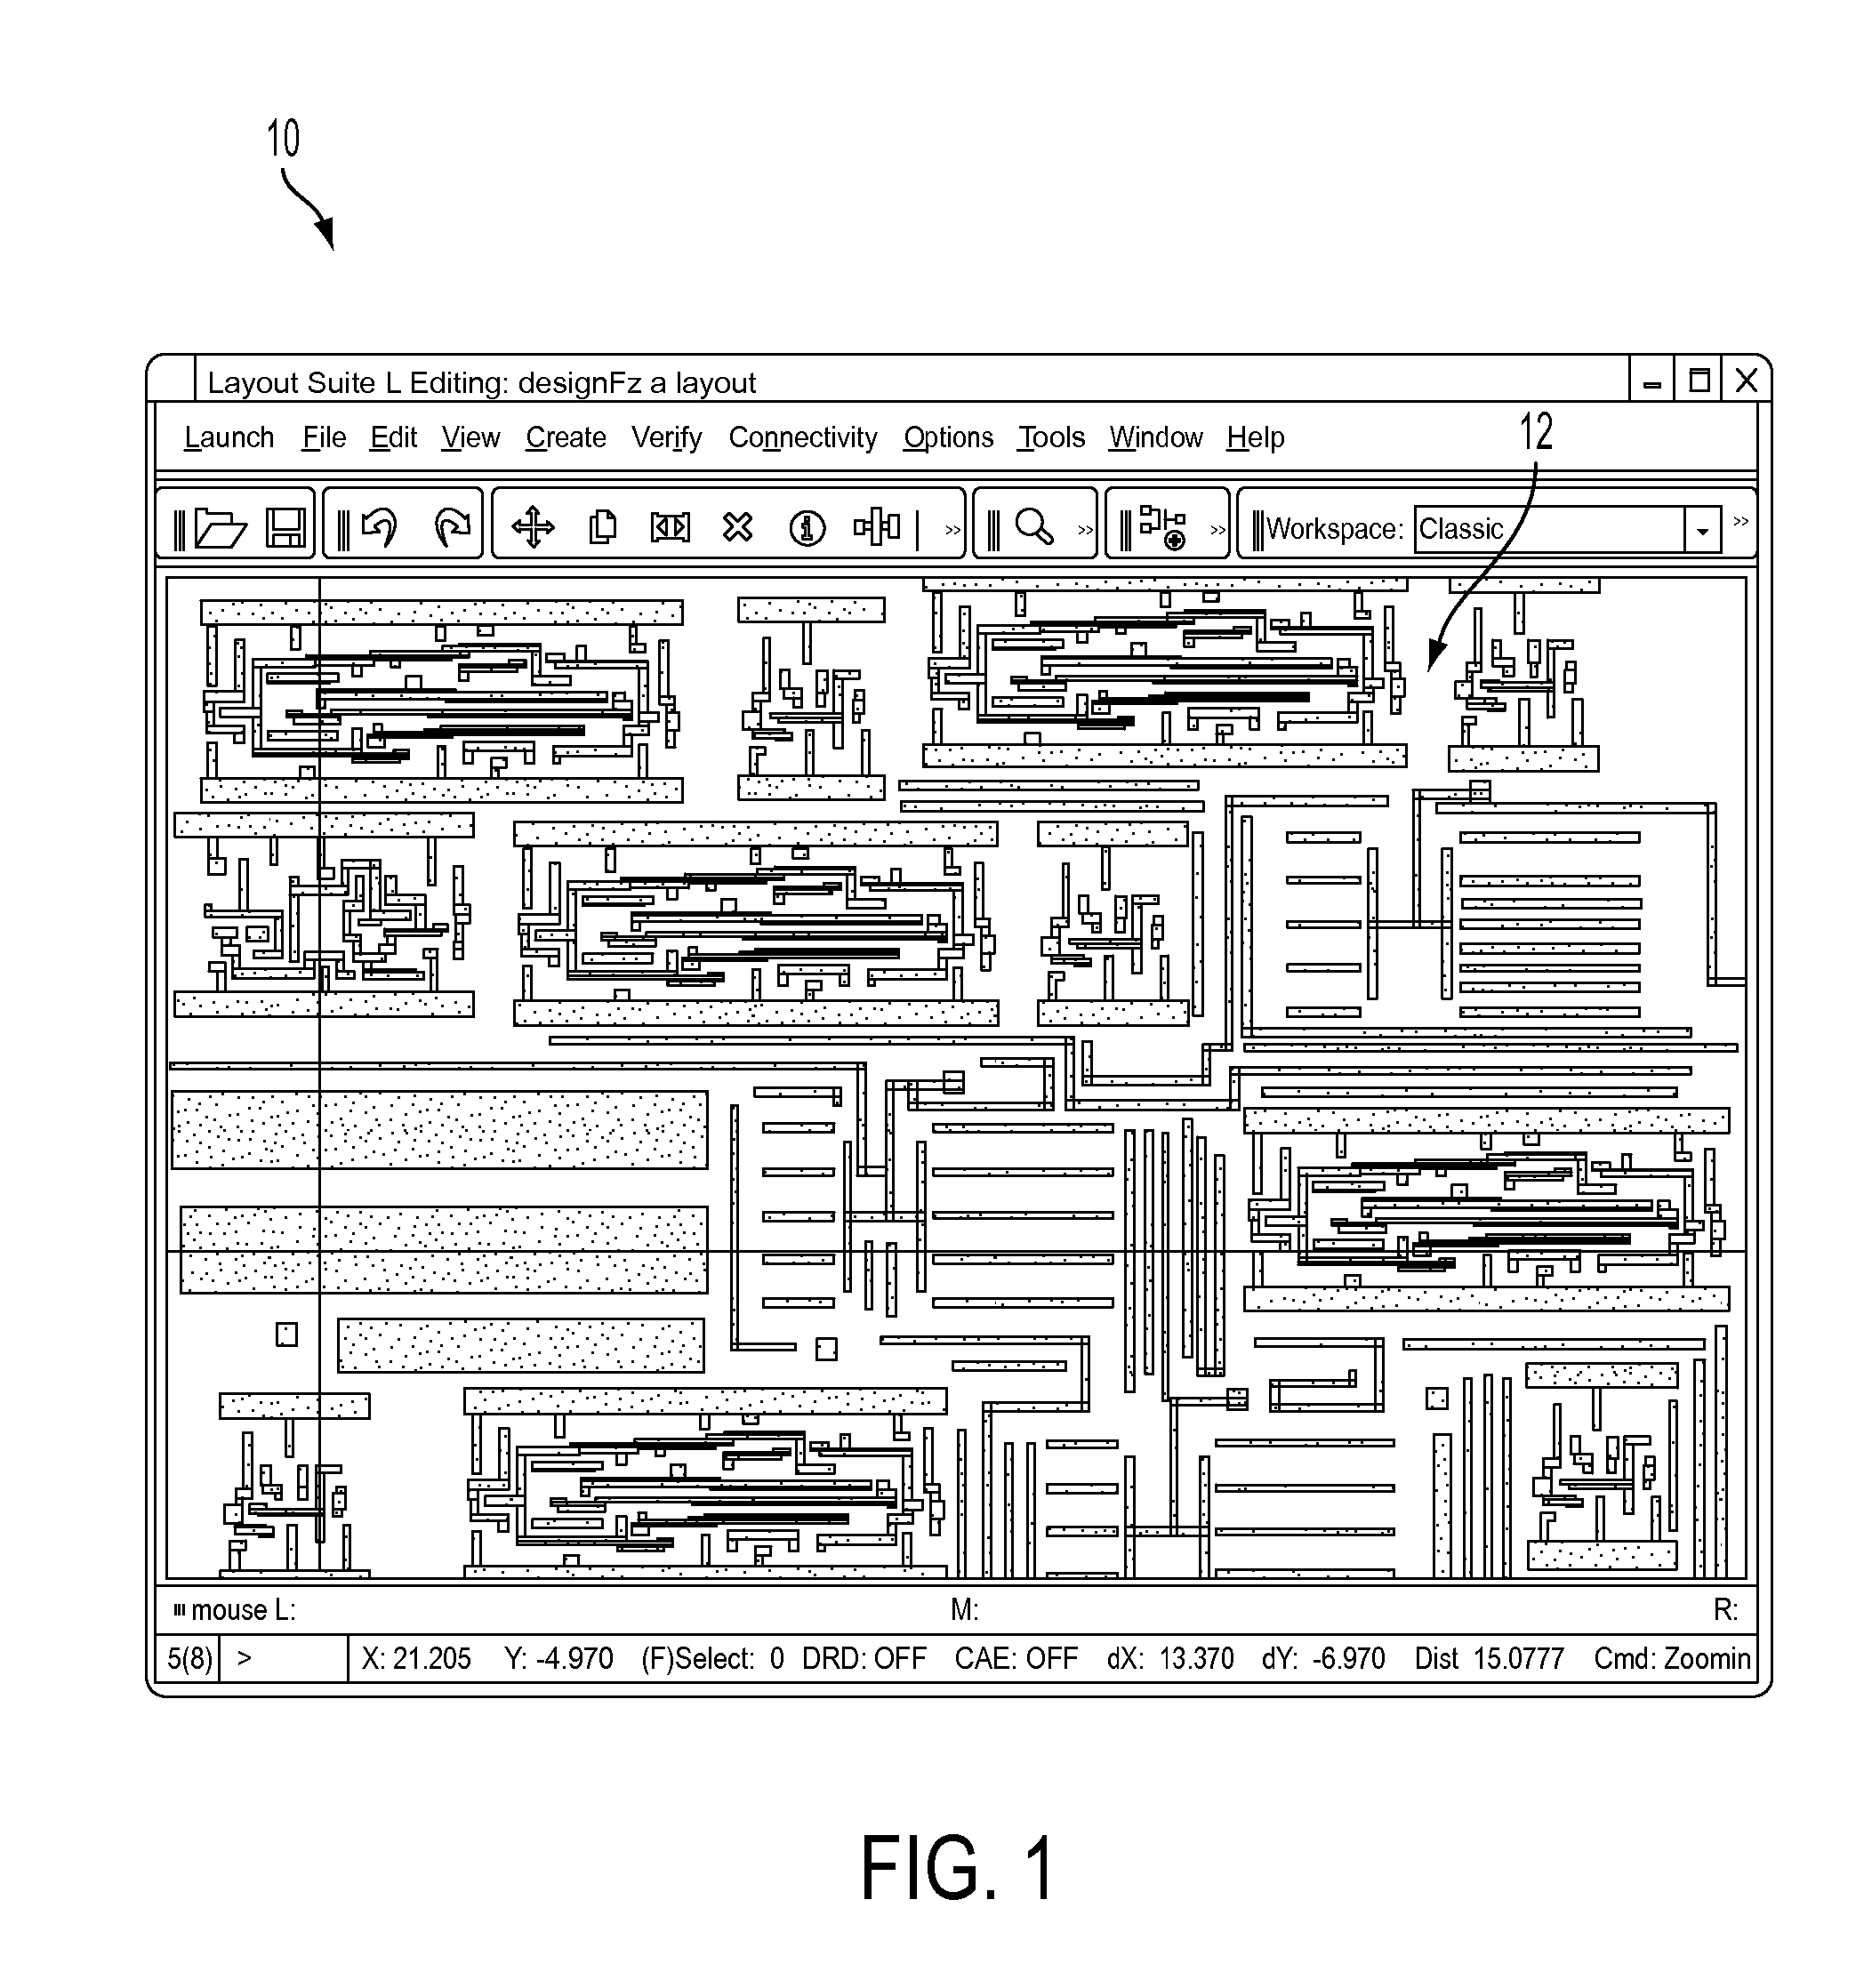
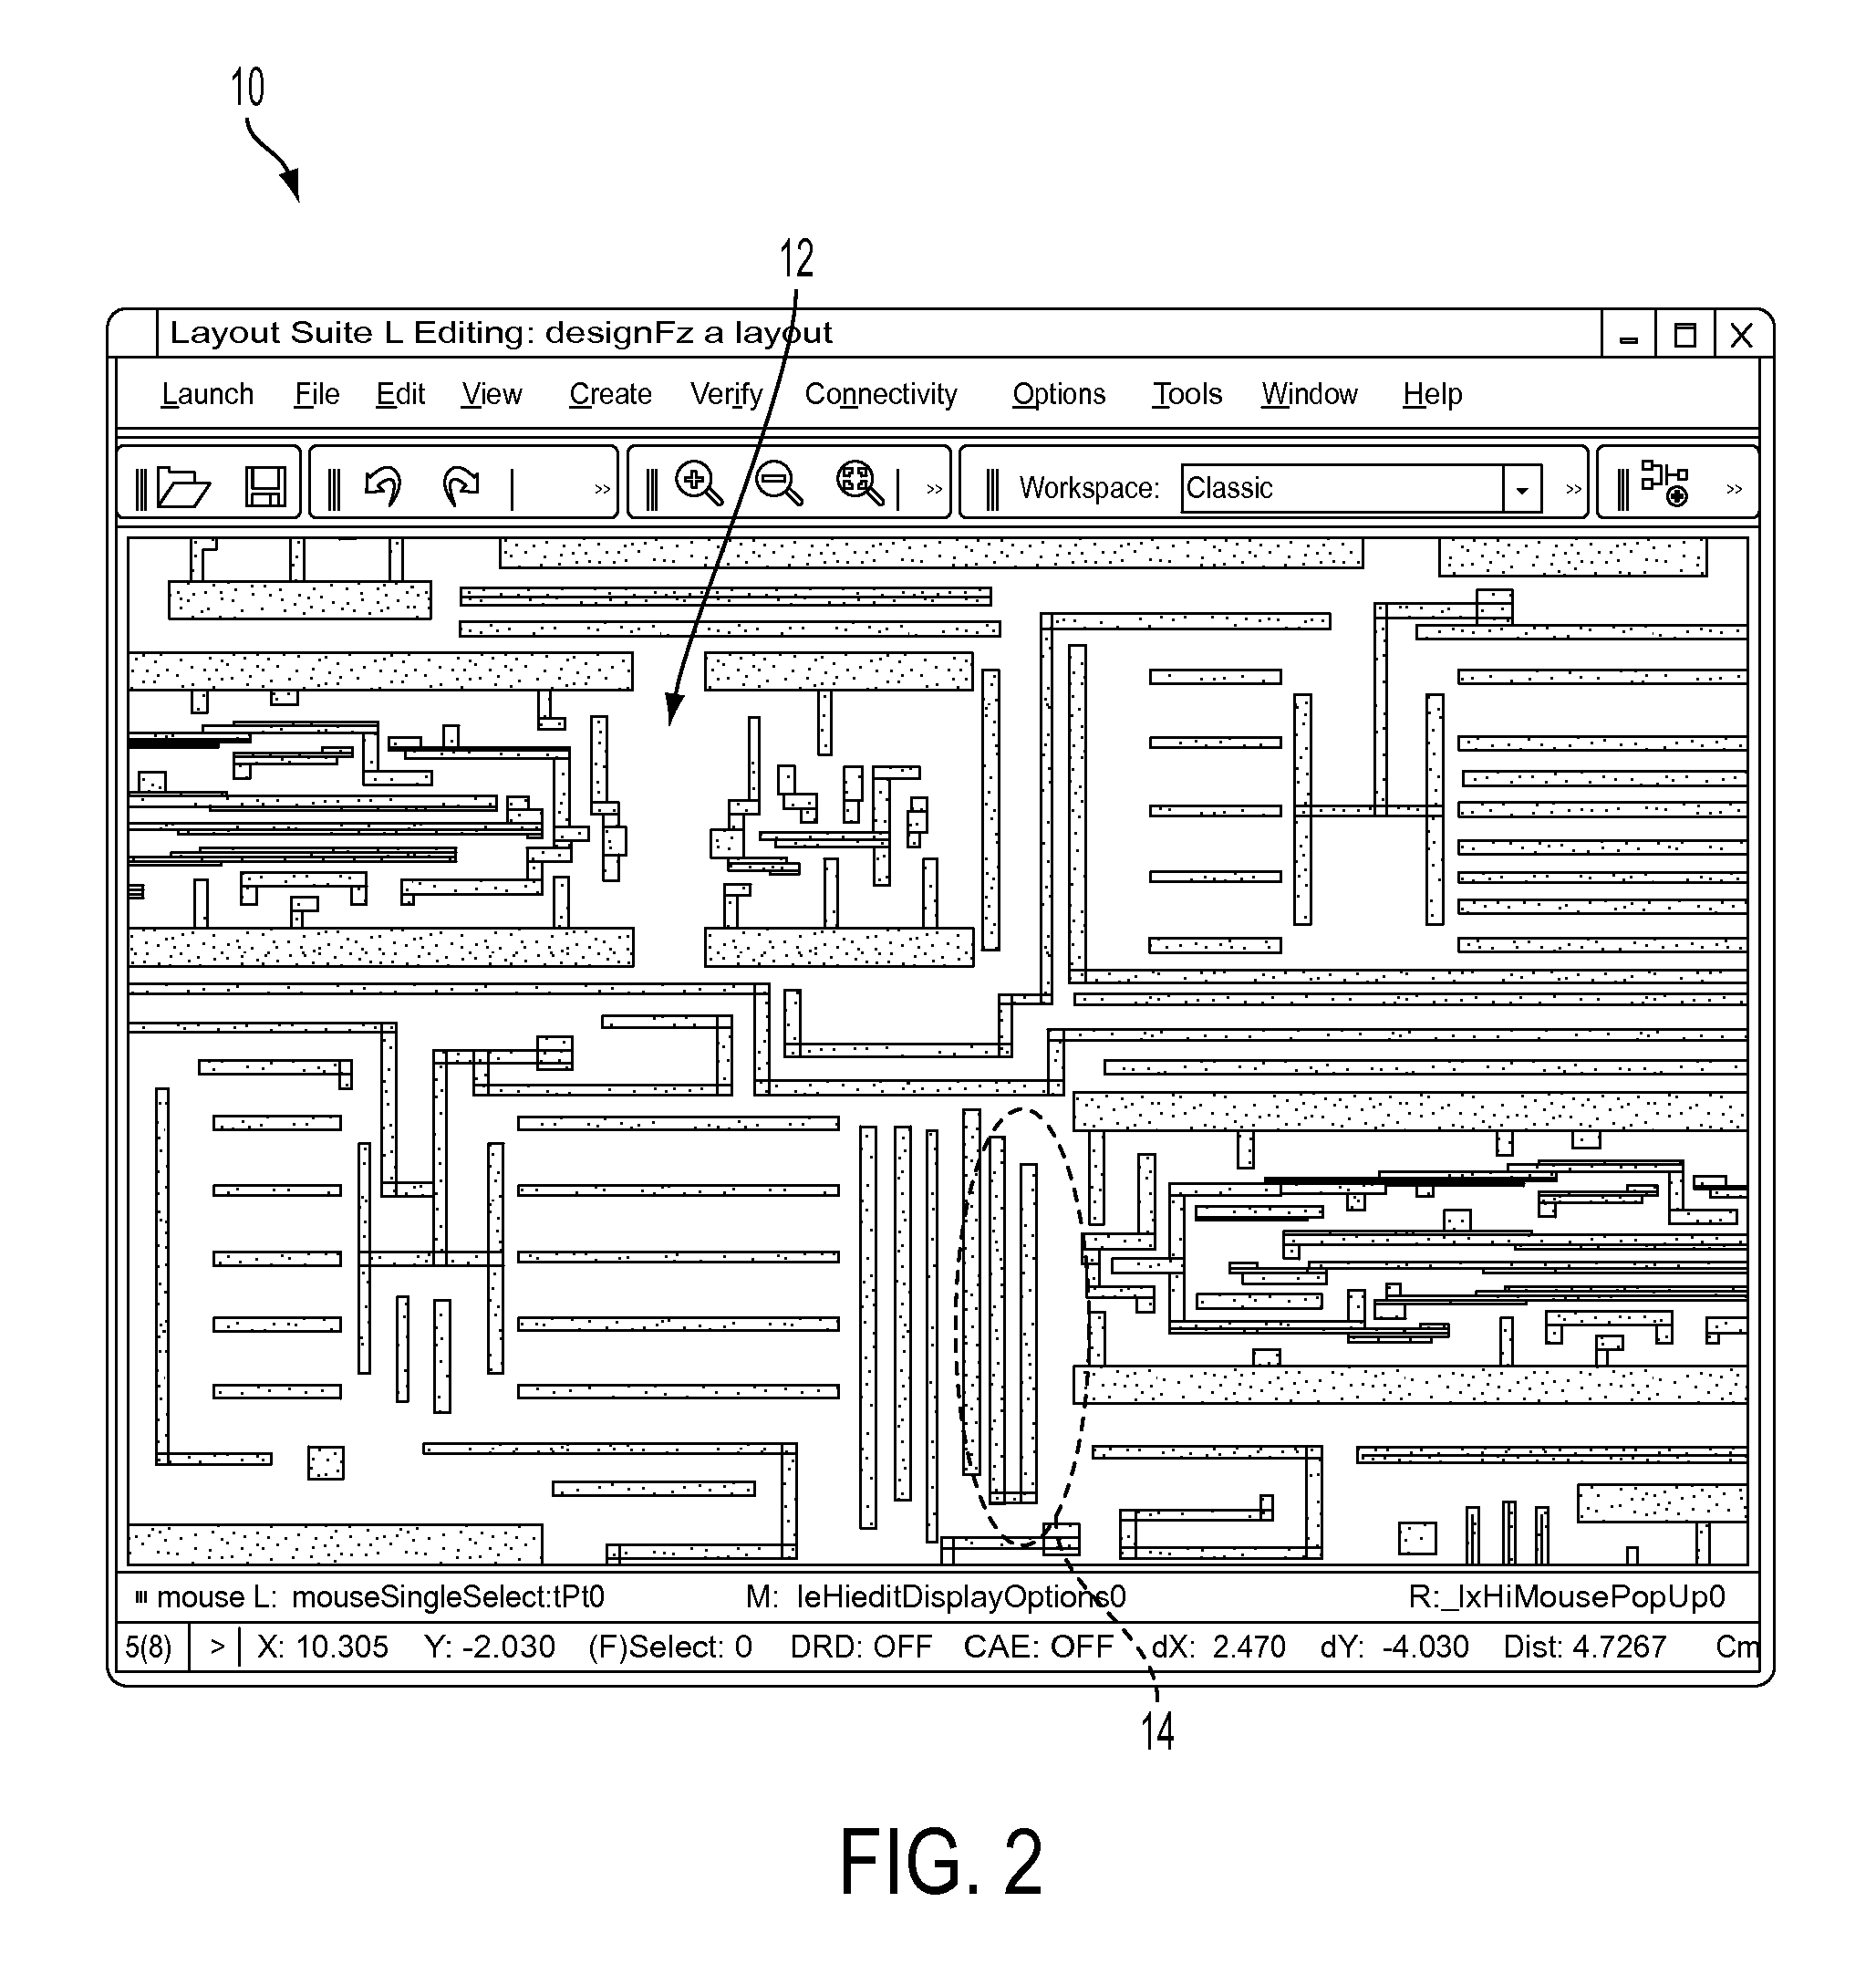
For example, when a designer performs zooming operations in or out to change the displayed magnification level of a layout portion or other image, the designer may lose context and must rely on quick identification of familiar or known shapes to regain context.
Such zoom operations are performed frequently during editing, which further causes a designer to lose track of particular locations and areas on a design canvas.
Similarly, when a designer pans a view of the layout, the same loss of context may occur.
Or, a designer may perform focused and concentrated edits in a smaller area of the layout for a long time, and may lose the connectivity context of the surrounding topology as a result.
Furthermore, when a designer is inspecting and editing a new design or another person's design, getting a grasp of the connectivity takes a long time, thereby reducing productivity.
Similarly, graphical interfaces and systems for other applications also commonly cause a user to lose context when editing and viewing different features in an image.
At this magnification level, however, the designer may become disoriented due to the different view.
This disorientation is usually even more common when working on a new design or other person's design.
In such cases, the designer may recognize landmarks or other shapes, but cannot be sure he or she is viewing the desired location due to the repeating patterns and similar shapes present all throughout the layout.
The task of regaining context is even more difficult if the layout does not include manual labels of the components, as in the example of FIG. 1.
Furthermore, when working on a new or other person's layout, it can take a long time before the designer is familiar enough with the layout and its connectivity.
All these factors lead to repetitive, tedious tasks for the user that decrease productivity substantially.
The problem with this method is that the designer is required to perform an explicit activity to find out the current context on the layout, and in every instance of re-establishing context, the query activity must be performed many times on multiple displayed shapes, which is burdensome and time-consuming for the designer.
However, the labeling task can be very time consuming and burdensome as well, especially when adding labels to many shapes on a canvas to allow context to be maintained in most situations.

Method used


Image

  • Visualization and information display for shapes in displayed graphical images based on user zone of focus
  • Visualization and information display for shapes in displayed graphical images based on user zone of focus
  • Visualization and information display for shapes in displayed graphical images based on user zone of focus

Examples


Embodiment Construction

[0028]The present inventions relate to graphical display by computer systems, and more particularly to displaying graphical and descriptive information using a computer system. The following description is presented to enable one of ordinary skill in the art to make and use the invention and is provided in the context of a patent application and its requirements. Various modifications to the preferred embodiment and the generic principles and features described herein will be readily apparent to those skilled in the art. Thus, the present invention is not intended to be limited to the embodiment shown but is to be accorded the widest scope consistent with the principles and features described herein.

[0029]The present invention is mainly described in terms of particular methods and systems provided in particular implementations. However, one of ordinary skill in the art will readily recognize that these methods and systems will operate effectively in other implementations. For exampl...


PUM


Abstract

Graphical viewing of shapes and descriptive information in displayed graphical images. In one aspect, shape information is displayed in a graphical interface using a computer system and includes causing a display of an image and one or more shapes in the image, and causing a display of a cursor on the display device. Labels are displayed on the display device, each label associated with a different displayed shape. One or more of the labels are displayed within a zone of focus of eyes of a user of the graphical interface and one or more of the labels are displayed outside the zone of focus, where the labels displayed in the zone of focus are displayed differently than the labels displayed outside the zone of focus.

Description

CROSS REFERENCE TO RELATED APPLICATIONS[0001]The present application is related to the following copending U.S. patent applications:[0002]U.S. patent application Ser. No. ______ (Attorney Docket No. 09PA008US01 / 4850P), entitled “Visualization and Information Display for Shapes in Displayed Graphical Images”, filed on even date herewith and assigned to the assignee of the present invention; and[0003]U.S. patent application Ser. No. ______ (Attorney Docket No. 09PA008US02 / 4863P), entitled “Visualization and Information Display for Shapes in Displayed Graphical Images Based on a Cursor”, filed on even date herewith and assigned to the assignee of the present invention.FIELD OF THE INVENTION[0004]The present invention relates to graphical display by computer systems, and more particularly to displaying graphical and descriptive information using a computer system.BACKGROUND OF THE INVENTION[0005]Computer-enabled graphical display and editing systems are used in a wide variety of differe...

Claims


Application Information

Patent Timeline
Patent Type & Authority Applications(United States)
IPC IPC(8): G06F3/048
CPCG06F17/5068G06F30/39
Inventor MAJUMDER, CHAYANO'RIORDAN, DONALD J.SIDDIQUE, SHAGUFTA
Owner CADENCE DESIGN SYST INC
Why Eureka
Try Eureka