Method for detection of analyte in microarray of samples and apparatus for performing such method

a microarray and analyte technology, applied in the direction of instruments, material electrochemical variables, magnetic variables, etc., can solve the problem of often unsatisfactory detection of biological analyte by optical means, and achieve the effect of convenient comparison

Active Publication Date: 2011-07-21
HAI KANG LIFE
View PDF12 Cites 3 Cited by
  • Summary
  • Abstract
  • Description
  • Claims
  • Application Information

AI Technical Summary

Benefits of technology

[0012]In one embodiment, after step (c), there is provided a step of taking an averaged value of light intensity of samples in each sample group and generating at least two averaged values associated with each of the monochromatic lights, one averaged value associated with the sample group potentially containing the analyte, and the other or one of the other averaged value(s) associated with the sample group serving as positive control or negative control. The use of an averaged value is advantageous because it can provide a more representative figure for comparison purposes and also the comparison can be made more conveniently. More specifically, there may be provided with a step of taking a differential in absolute value of the averaged values associated with the sample group potentially containing the analyte and the sample group serving as positive control or negative control, thus generating at least two differentials, each associated with the respective monochromatic light. After generating the at least two differentials, there is provided with a step of comparing the differentials with a predetermined differential.

Problems solved by technology

Despite the availability of these various methods, it has been found that detecting biological analyte by optical means is often unsatisfactory.

Method used


Image

  • Method for detection of analyte in microarray of samples and apparatus for performing such method
  • Method for detection of analyte in microarray of samples and apparatus for performing such method
  • Method for detection of analyte in microarray of samples and apparatus for performing such method

Examples


experiment 1

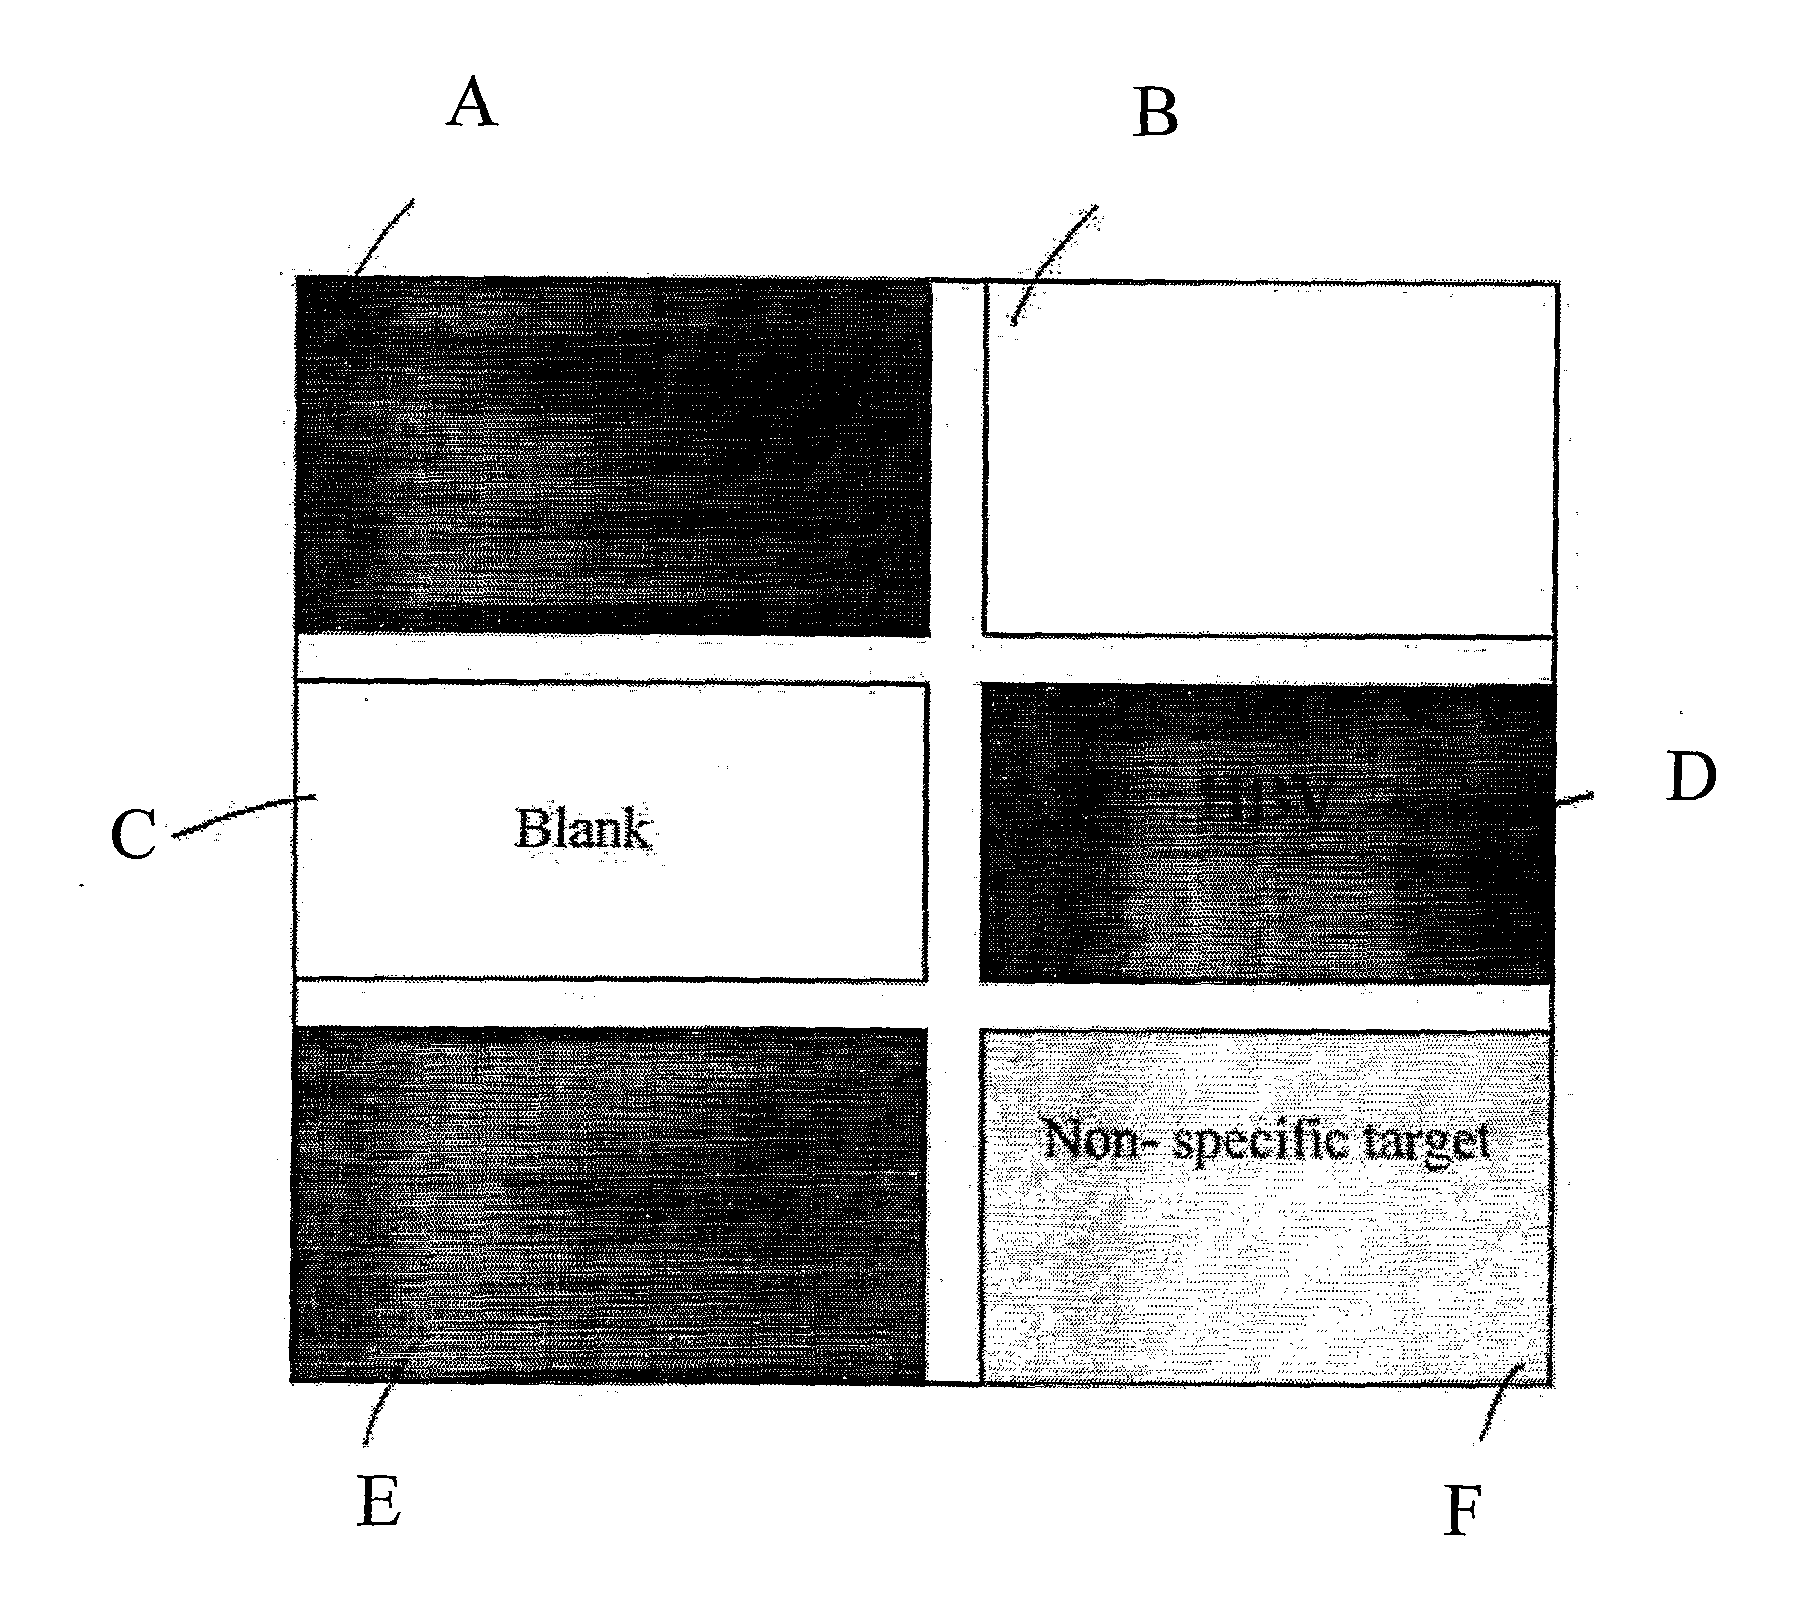
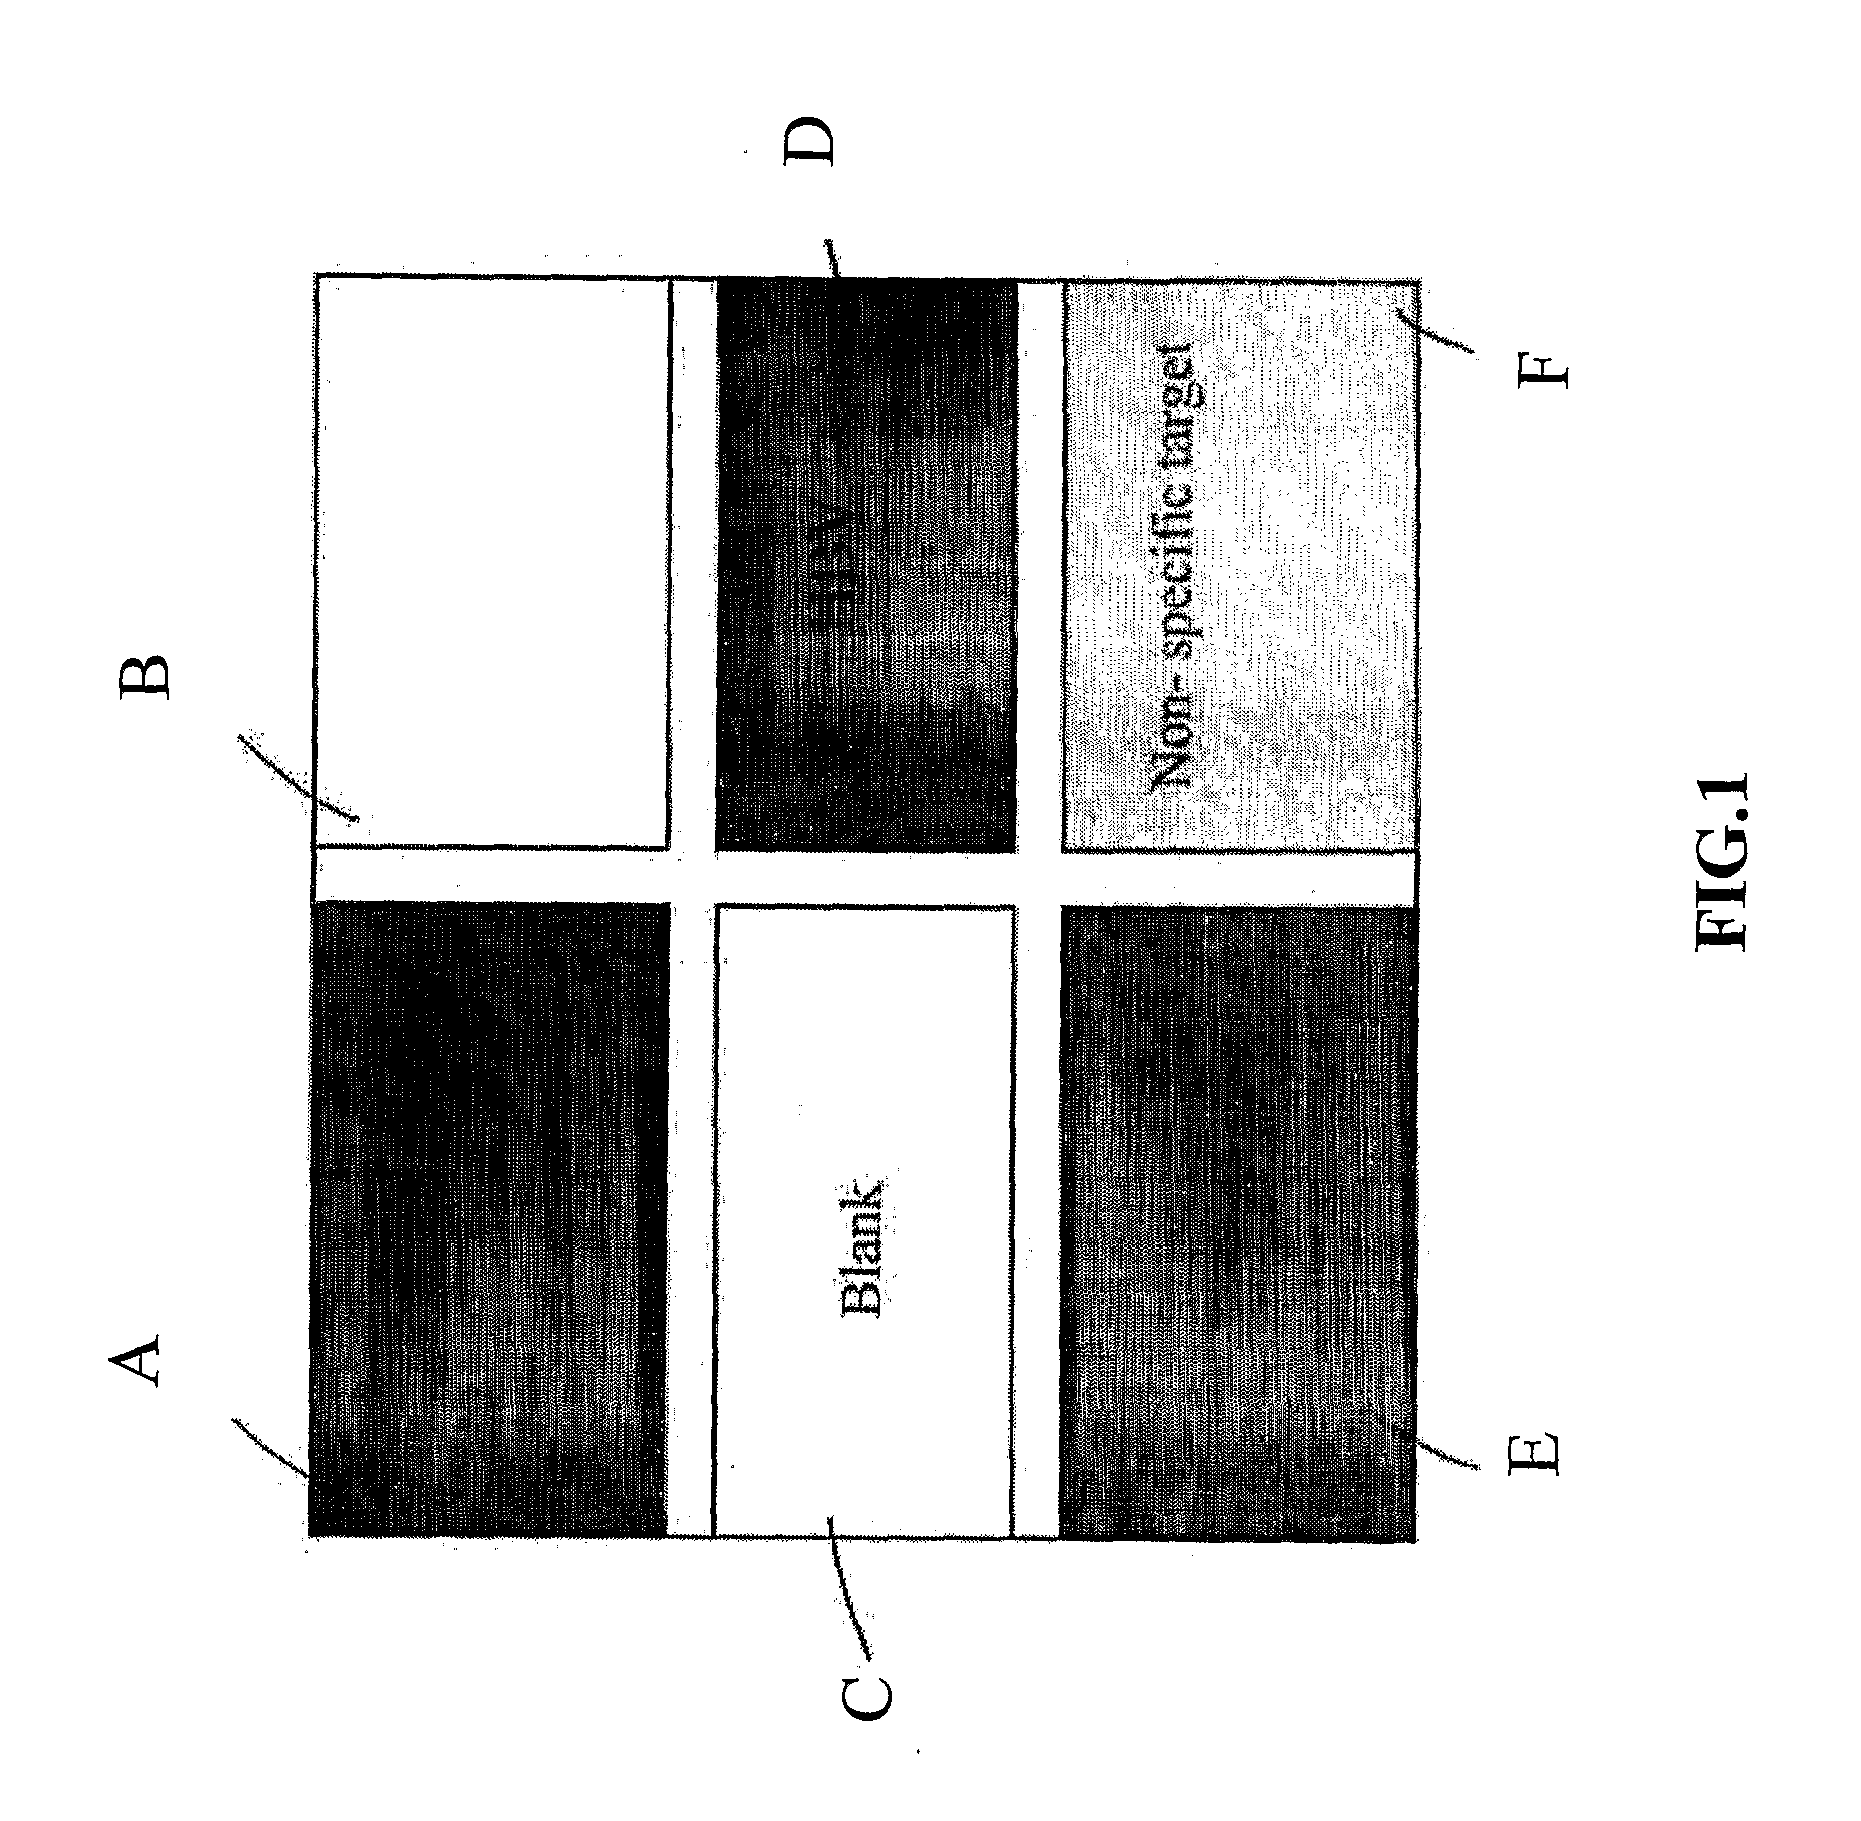
[0032]In this experiment, the target analyte was the Hepatitis B virus and the signal enhancement agent was nano-sized gold particle. Hepatitis B virus (HBV) probes tagged with nano-sized gold particle were used as positive control. Specifically, referring to FIG. 1, there is shown a schematic diagram of a microarray of samples on a chip wafer. The chip wafer was spotted according to the pattern as shown in FIG. 1. In particular, the chip wafer was divided into six sections, namely sections A to F. Sections A, D, and E are the dark areas and these areas represent the area of positive control with the Hepatitis B virus probes which have been tagged with the signal enhancement agent. The light grey area, i.e. Section F, was loaded with non-specific targets which served as negative control. The white areas, i.e. Sections B and C, did not contain any spotted sample and they served as negative control. With this configuration, positive result, or darker color, should be observed in regio...

experiment 2

[0038]FIGS. 6a to 11 show data and result of an experiment similar to that shown in FIGS. 1 to 5b and as described above. Specifically, a chip wafer was used and it was similarly divided into six sections, i.e. Sections A to F, with samples including target analyte, positive control and / or negative control loaded therein. Sections A and D were loaded with specific probes. Sections E and F were loaded with specific probes but diluted 100 times and 10 times, respectively. Section C was loaded with non-specific probes and Section B was loaded with only buffer. See FIG. 6f for key. The specific probes were similarly HBV probes. In this experiment, as compared to the experiment as shown FIGS. 1 to 5b, there are however a number of differences. First, reaction was allowed to take place on a chip wafer, and an image of the chip wafer was taken when the reaction had taken place for less than 6 minutes (see FIG. 6a), about 6 minutes (see FIG. 6b), at about 10 minutes (see FIG. 6c), at about ...


PUM

PropertyMeasurementUnit
wavelengthaaaaaaaaaa

Abstract

A method for detecting a target analyte associated with nano-sized gold- and/or silver-containing detecting labels in a microarray of samples. The labels indicate presence or absence of a target analyte in a sample. The method includes sequentially illuminating at least two sample groups with at least two different monochromatic light beams. The sample groups include (a) a first sample group containing at least one sample potentially containing the target analyte, and (b) a second sample group serving as positive control or negative control. The method also includes (ii) detecting intensity of light reflected, absorbed, or emitted from each of the sample groups when illuminated with each of the monochromatic light beams. (iii) recording groups of values associated with the intensity reflected, absorbed, or emitted light. (iv) comparing the groups of values associated with the sample groups; and (v) determining the presence of the target analyte based on the comparison.

Description

FIELD OF THE INVENTION[0001]There present invention is concerned with a method for detecting a target analyte in a sample and an apparatus for performing the method.BACKGROUND OF THE INVENTION[0002]There are a variety of technologies seeking to provide methods of detecting biological analytes in a sample. For example, U.S. Pat. No. 6,361,944, U.S. Pat. No. 6,506,564, U.S. Pat. No. 6,750,016 and U.S. Pat. No. 6,767,702 disclose a method of detecting nucleic acid by observing a change in color when oligo-nucleotides are hybridized to the nucleic acid. Yguerabide et al (Journal of Cellular Biochemistry Supplement 37:71-81 (2001)) discloses the use of resonance light scattering (RLS) particle as labels for analyte detection. Foultier et al (IEE Proc.-Nanobiotechnol., Vol. 152, No. 1, February 2005) discloses the use of fluorescent label technologies in visually detecting the presence or absence of a target analyte in a sample. Despite the availability of these various methods, it has be...

Claims


Application Information

Patent Timeline
Patent Type & Authority Applications(United States)
IPC IPC(8): G01N21/00G01N21/59B82Y15/00
CPCG01N21/554G01N33/587G01N2021/258G01N21/253G01N2201/06146G01N21/00G01N2021/3185G01N21/17G01N21/31G01N21/47G01N27/26G01N27/72G01N33/52G01N33/58
Inventor YU, CHEUNG HOI ALBERTLAU, LOK TING
Owner HAI KANG LIFE
Why Eureka
Try Eureka