
Method and computer program product for finding statistical bounds, corresponding parameter corners, and a probability density function of a performance target for a circuit

a technology of probability density function and computer program product, which is applied in the field of computer program product for finding statistical bounds, corresponding parameter corners, and probability density functions of performance targets for circuits, can solve the problems of not being as accurate as required, unable to solve the constrained optimization problem directly, and a large number of simulation runs must be performed

Inactive Publication Date: 2011-09-01
IBM CORP
View PDF3 Cites 13 Cited by
  • Summary
  • Abstract
  • Description
  • Claims
  • Application Information

AI Technical Summary

Benefits of technology

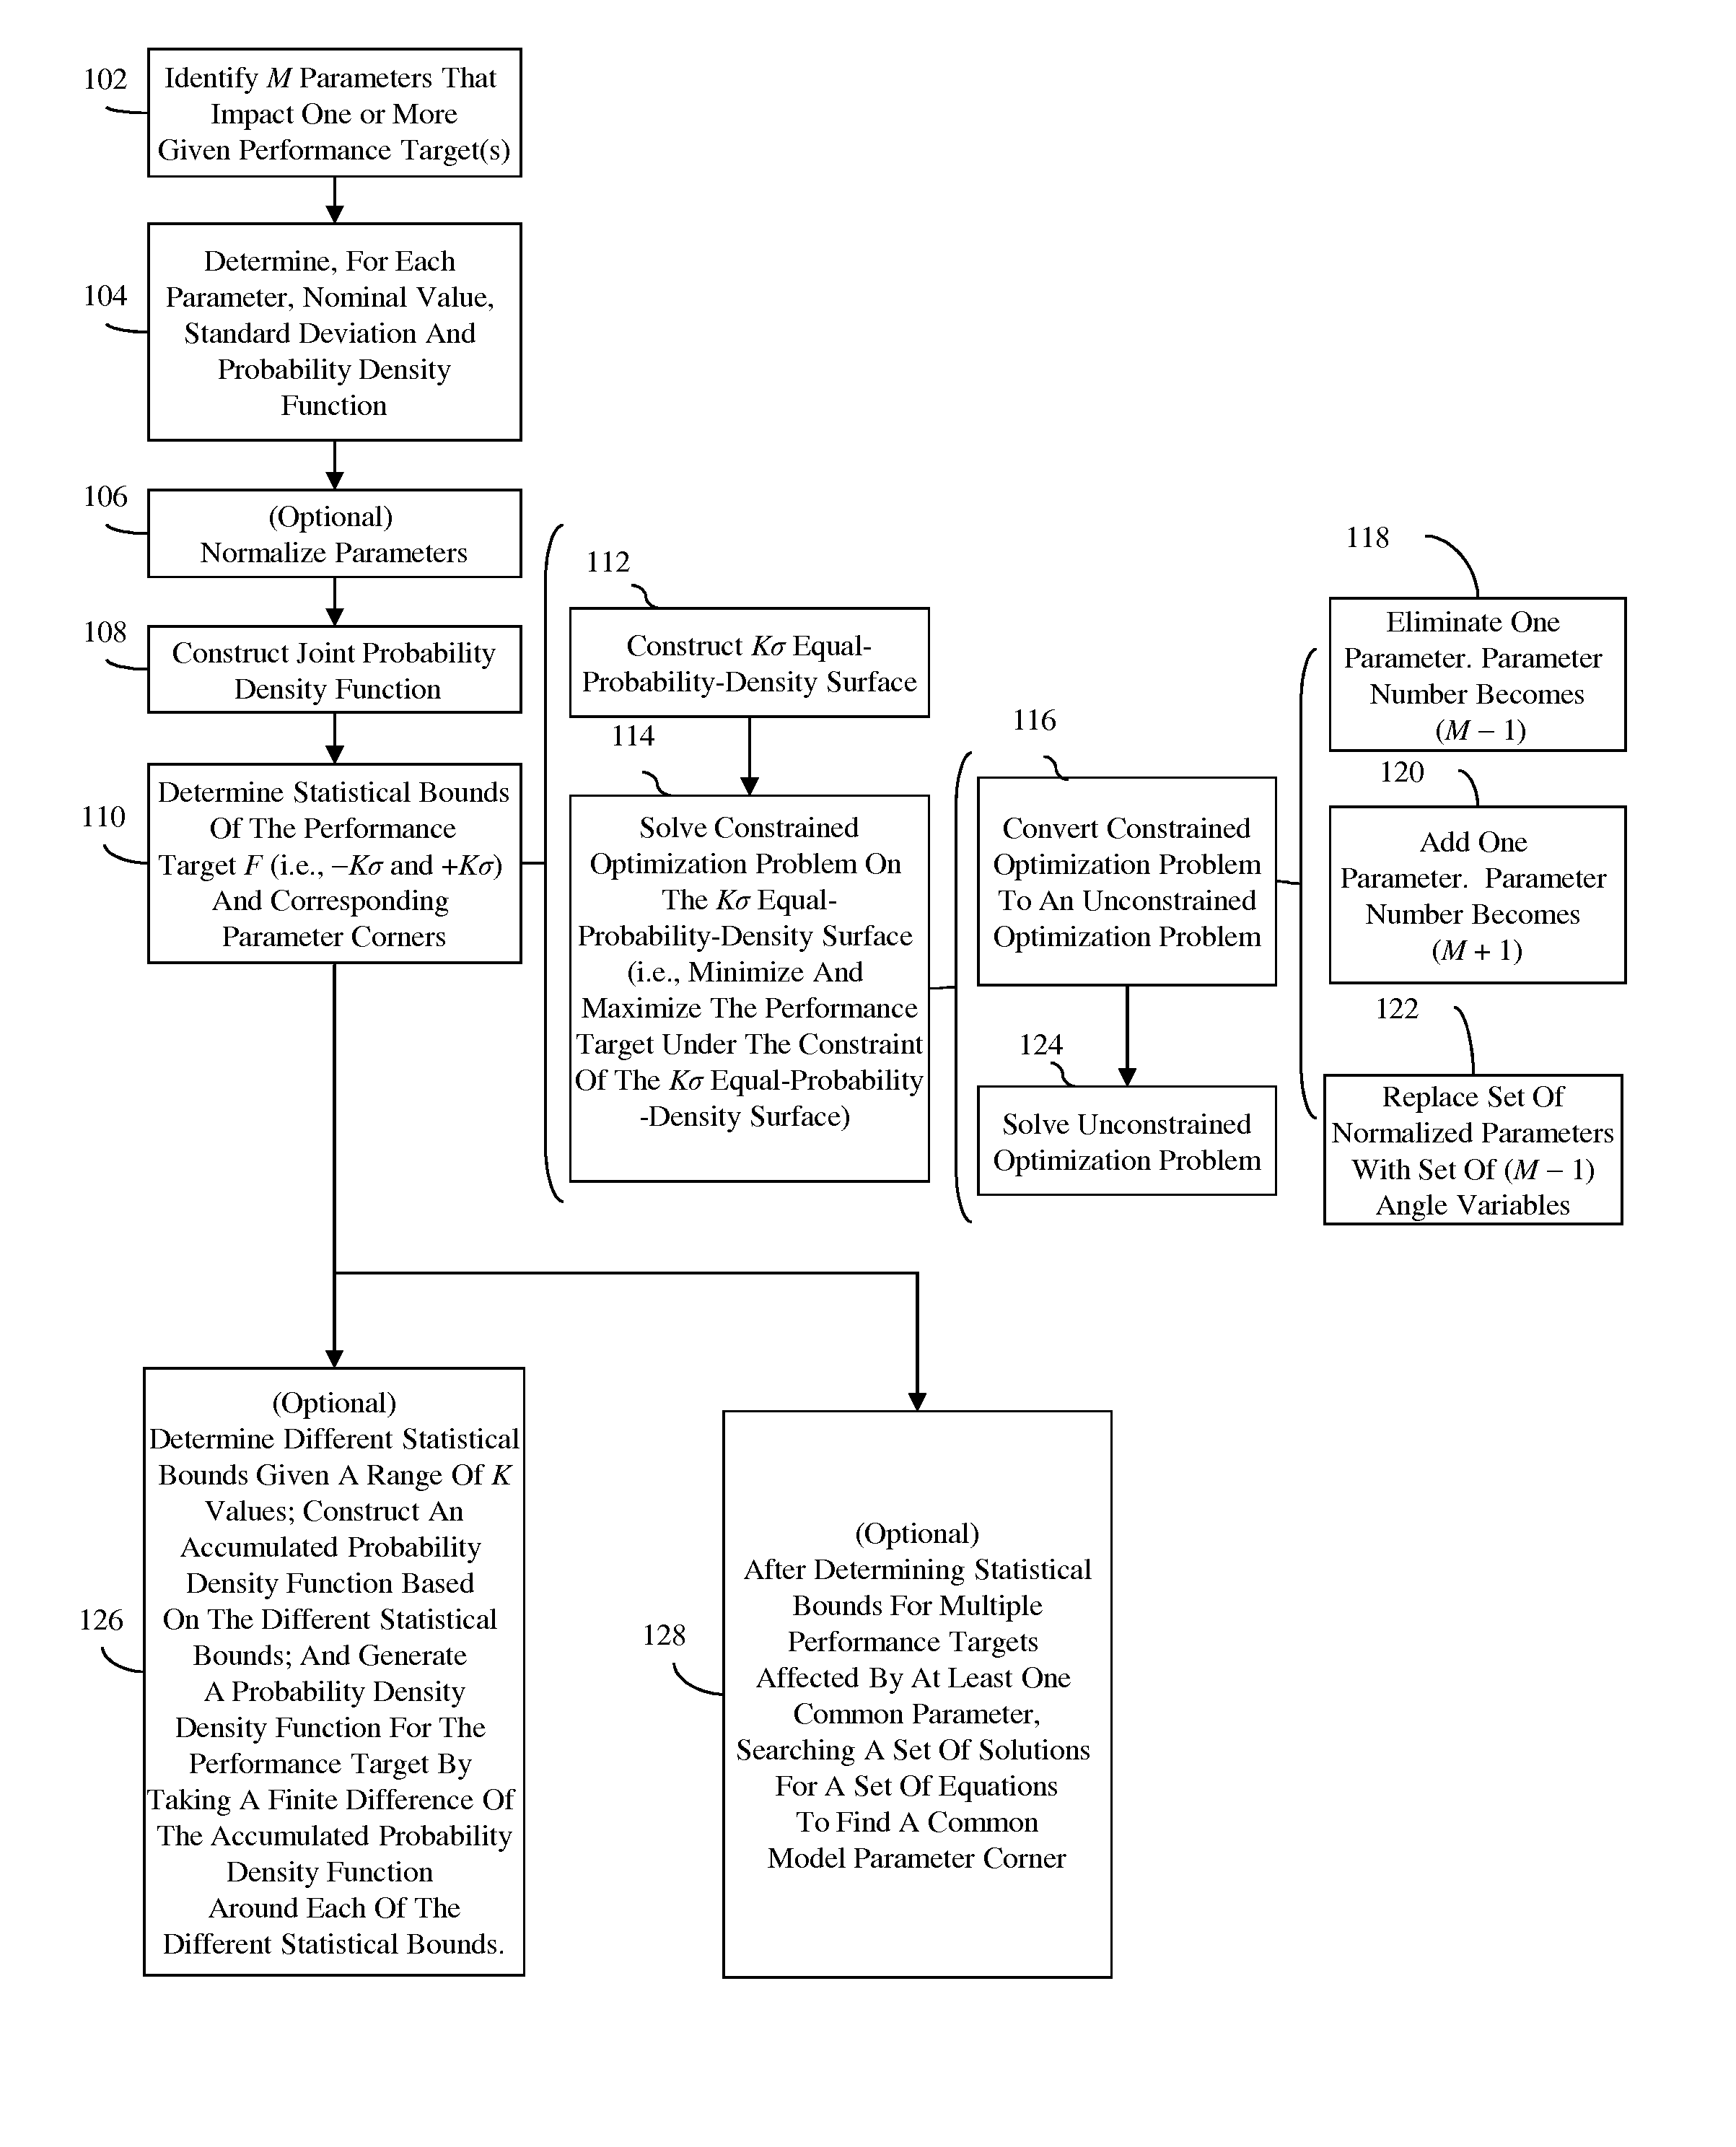
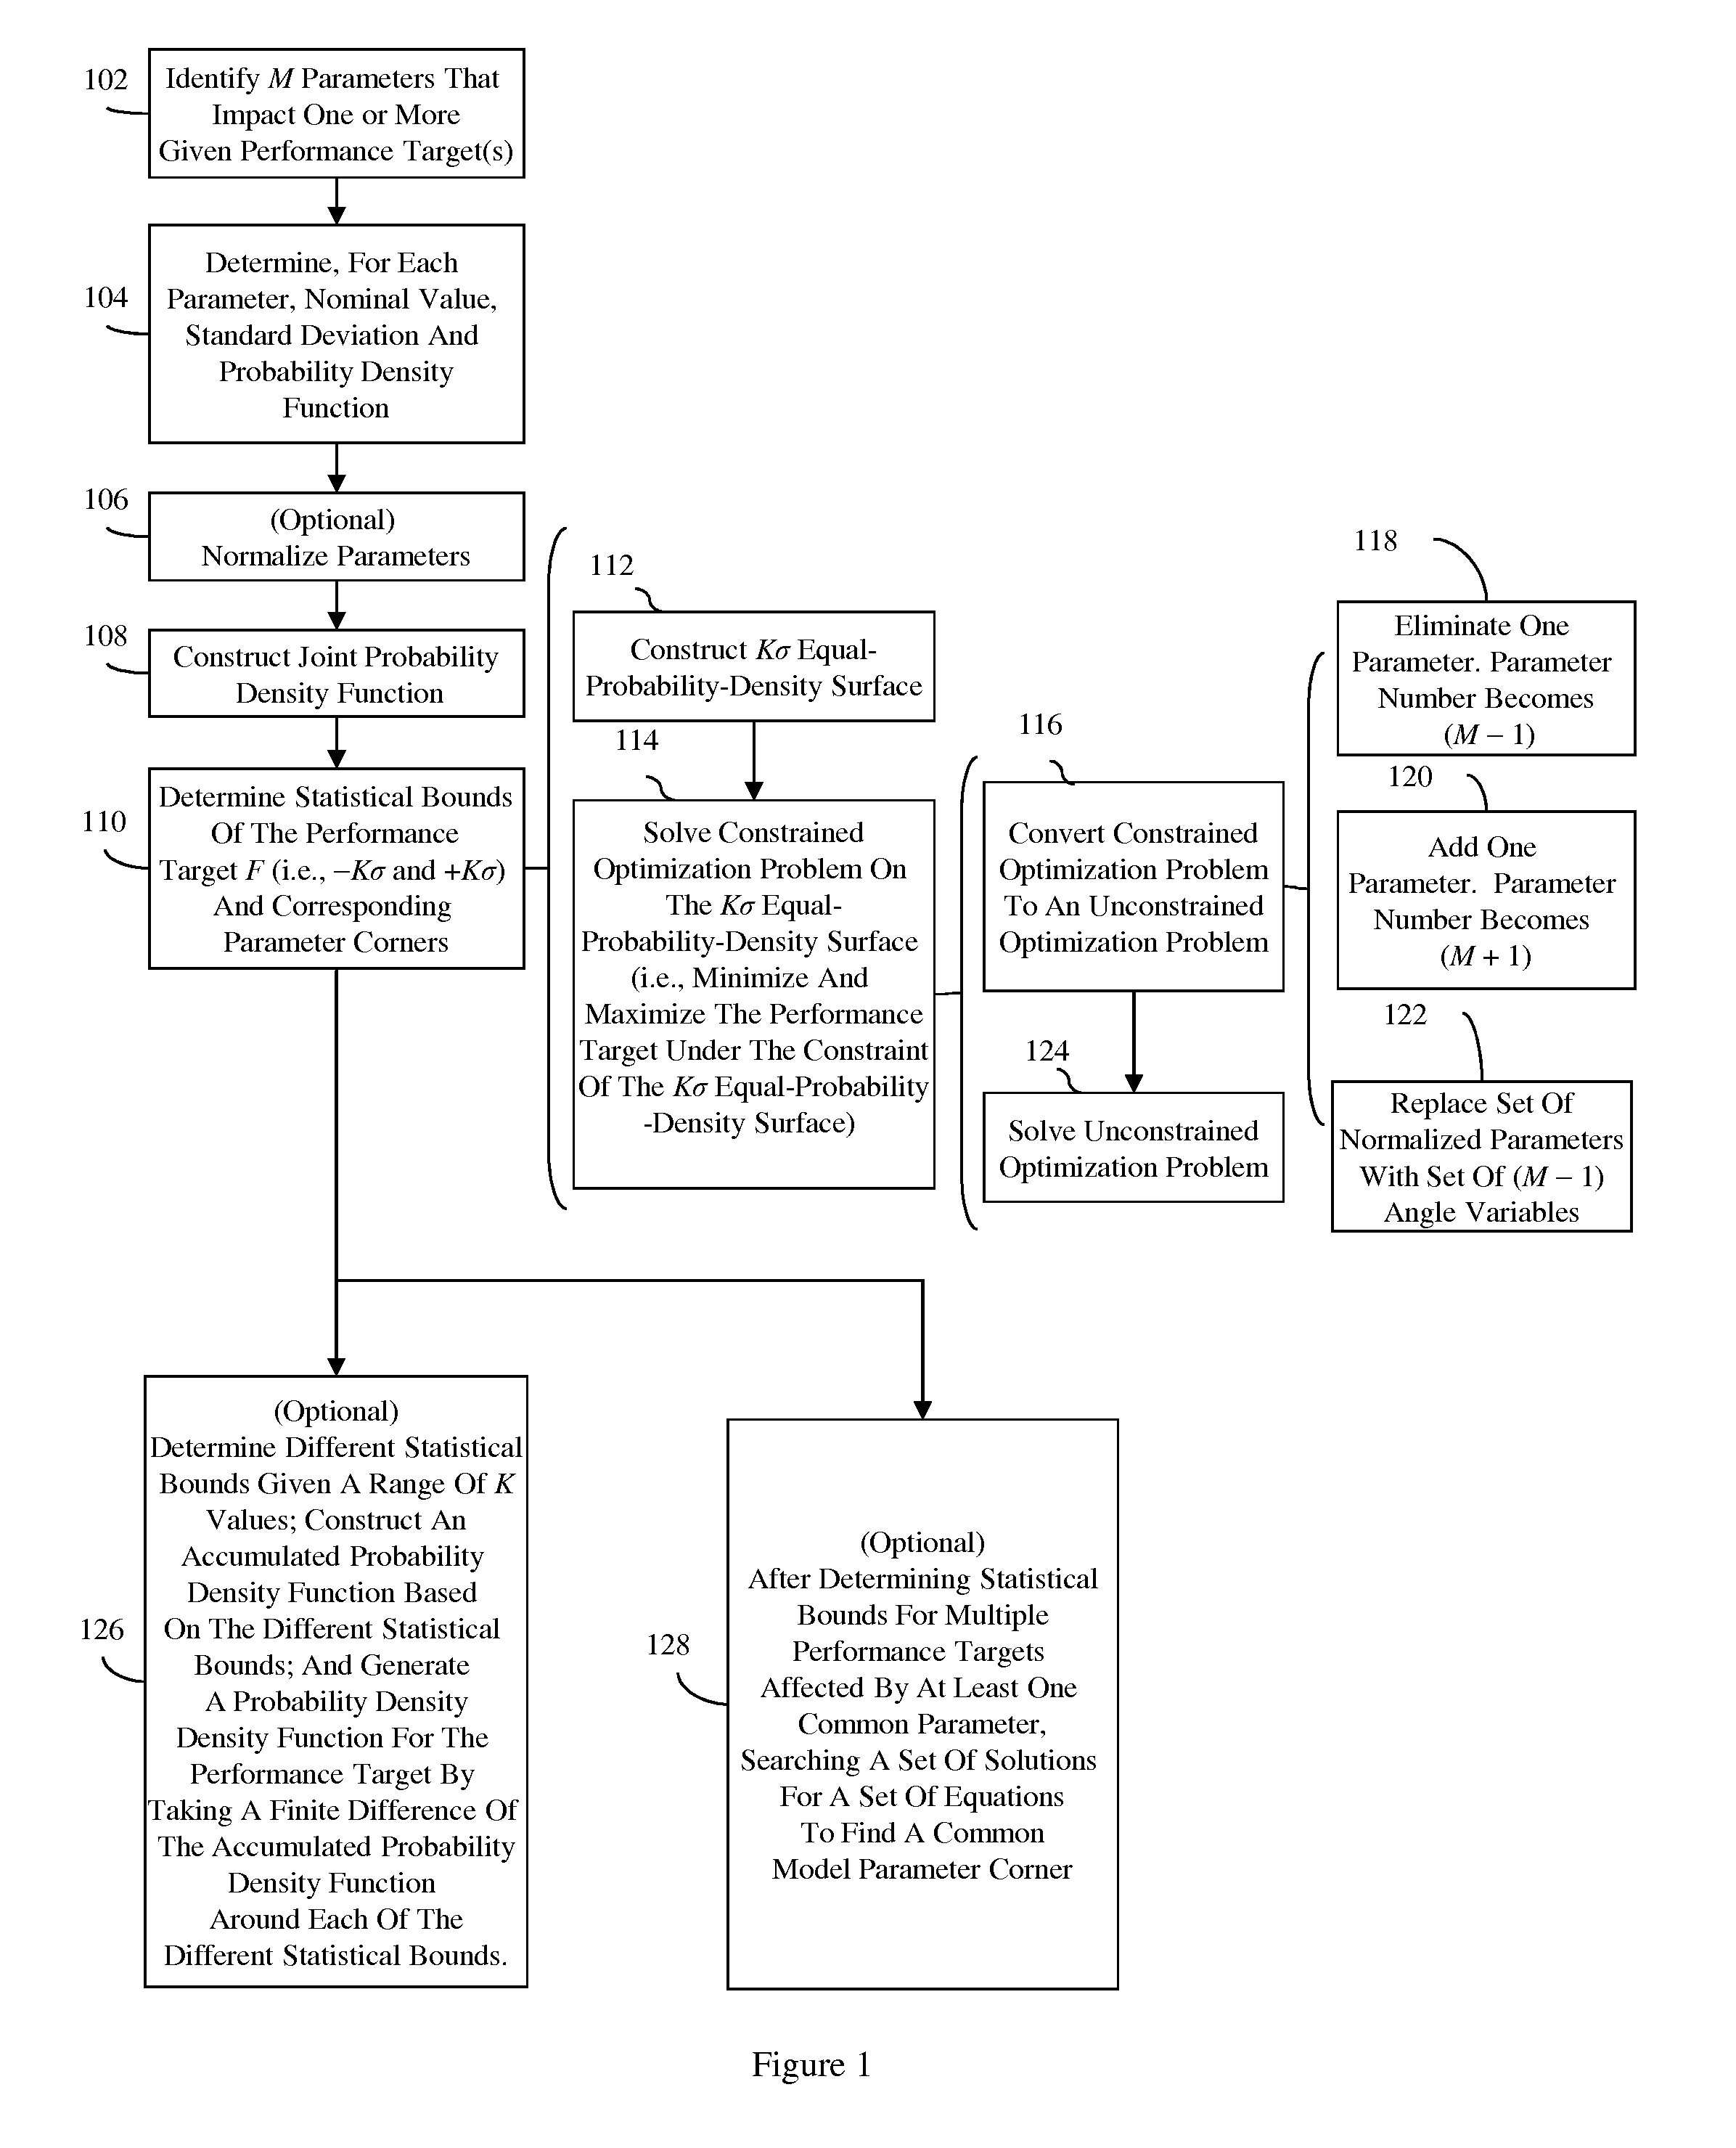
[0009]In another embodiment, the method can similarly comprise determining (e.g., by a computer) a nominal value xj0, a standard deviation σj, and a probability density function {tilde over (p)}(xj; xj0, σj) for each parameter xj, where j=1, 2, . . . , M. However, in this embodiment subsequent steps are simplified by first normalizing (e.g., by the computer) the M independent statistical model parameters (x1, x2, . . . , xM) to create M normalized parameters (u1, u2, . . . , uM). Next, a joint probability density function P(u1, u2, . . . , uM) can be constructed (e.g., by the computer) for all of the M normalized parameters (u1, u2, . . . , uM), where
[0010]Those skilled in the art will recognize that, in each of the above-described method embodiments, solving the constrained optimization problem directly can be quite complex. To avoid this complexity, the constrained optimization problem can first be converted into an unconstrained optimization problem. Different techniques can be used for this conversion process (e.g., by eliminating a parameter, or by adding a parameter, etc.). Then, the unconstrained optimization problem can be solved to determine the lower statistical bound −Kσ and the upper statistical bound +Kσ. Once the lower and upper statistical bounds are determined, the corresponding parameter corners for the performance target can also be determined.

Problems solved by technology

Unfortunately, when Monte Carlo simulations are used to determine the probability density function, the statistical bounds and the corresponding parameter corners of a performance target, a very large number of simulation runs must be performed and the results may not be as accurate as required.
Those skilled in the art will recognize that, in each of the above-described method embodiments, solving the constrained optimization problem directly can be quite complex.

Method used


Image

  • Method and computer program product for finding statistical bounds, corresponding parameter corners, and a probability density function of a performance target for a circuit
  • Method and computer program product for finding statistical bounds, corresponding parameter corners, and a probability density function of a performance target for a circuit
  • Method and computer program product for finding statistical bounds, corresponding parameter corners, and a probability density function of a performance target for a circuit

Examples


Embodiment Construction

[0026]The embodiments of the invention and the various features and advantageous details thereof are explained more fully with reference to the non-limiting embodiments that are illustrated in the accompanying drawings and detailed in the following description.

[0027]Parameters of circuits of the same design, including parameters of the specific components of the circuit (e.g., of integrated circuits, of semiconductor devices, of interconnect structures, etc.) will often differ in random ways (e.g., due to random process variations). Thus, circuit performance will also differ. To ensure that a circuit will achieve a given performance target when manufactured, designers often use a simulator to determine the statistical / probability distribution and the statistical bounds (i.e., the lower and upper statistical bounds) and corresponding parameter corners for the performance target. Typical simulators (e.g., Simulation Program with Integrated Circuit Emphasis (SPICE) simulators), associa...


PUM


Abstract

Disclosed are embodiments of a method and an associated computer program product for finding the statistical bounds, the corresponding parameter corners and the probability density function of one or more performance targets for a circuit without requiring Monte Carlo simulation runs. To accomplish this, a joint probability density function for independent parameters that affect the performance target can be constructed. Then, based on the joint probability density function, the statistical bounds of the performance target can be found by constructing an equal-probability-density surface of the joint probability density function and solving a constrained optimization problem on that equal-probability-density surface. Once the statistical bounds are determined, the corresponding parameter corners for the performance target can also be determined. After obtaining multiple statistical bounds corresponding to different accumulated probability density, the probability density function of the performance target can also be obtained.

Description

BACKGROUND[0001]1. Field of the Invention[0002]The present invention relates generally to device design and, more particularly, to a method and computer program product for efficiently and accurately finding the statistical bounds, the corresponding parameter corners, and the probability density function of one or more performance targets for a circuit.[0003]2. Description of the Related Art[0004]Parameters of circuits of the same design, including parameters of specific components of the circuit (e.g., of integrated circuits, of semiconductor devices, of interconnect structures, etc.), will often differ in random ways (e.g., due to random process variations). Thus, circuit performance will also differ. To ensure that a circuit will achieve a given performance target when manufactured, designers often use a simulator to determine the statistical distribution (e.g., a histogram distribution plot) and the statistical bounds (i.e., the lower and upper statistical bounds) and correspond...

Claims


Application Information

Patent Timeline
Patent Type & Authority Applications(United States)
IPC IPC(8): G06F17/18
CPCG06F17/18G06F2217/10G06F17/504G06F2111/08G06F30/3323G06N5/01G06N7/01
Inventor LU, NING
Owner IBM CORP
Learn More