
Method and system for it resources performance analysis

a technology of performance analysis and computer resources, applied in the field of data processing, can solve problems such as unsatisfactory performance, unavailability or performance degradation of services, and the use of image compression techniques which are not convenient, and achieve the effects of reducing the amount of data to be analysed, increasing the computational efficiency of “anti-pattern” discovery, and reducing the amount of data

Active Publication Date: 2012-06-21
KYNDRYL INC
View PDF14 Cites 6 Cited by
  • Summary
  • Abstract
  • Description
  • Claims
  • Application Information

AI Technical Summary

Benefits of technology

The invention provides a method and system for monitoring an infrastructure of multiple managed units by analyzing performance indicators of components in real-time. The system uses a combination of historical data analysis and machine learning to identify and rank components that are likely to have problems. The method is less invasive on the middleware / application runtime and can be applied to every platform / middleware application. The invention also allows for the identification of abnormal basic statistic functions and reduces the amount of data needed for analysis. Overall, the invention improves the ability of IT service providers to identify and prioritize problems in their infrastructure.

Problems solved by technology

These organizations are facing technical challenges to perform properly the two key IT management processes: problem management and service measurement.
In some situations there are problems on a specific application with clear root causes that need an analysis on a limited number of IT infrastructure components (for example servers or subsystems).
This causes service unavailability or performance degradation.
The past measurement data indicate a problem of the managed system.
The approach uses image compression techniques which are not convenient (computational power is required, artificial bias, etc).
This comparison with well-performing systems is not satisfactory.
The considered algorithm measures the “angle of the subspaces” to calculate the differences between the data stream and the footprint; this approach also presents drawbacks.

Method used


Image

  • Method and system for it resources performance analysis
  • Method and system for it resources performance analysis
  • Method and system for it resources performance analysis

Examples


Embodiment Construction

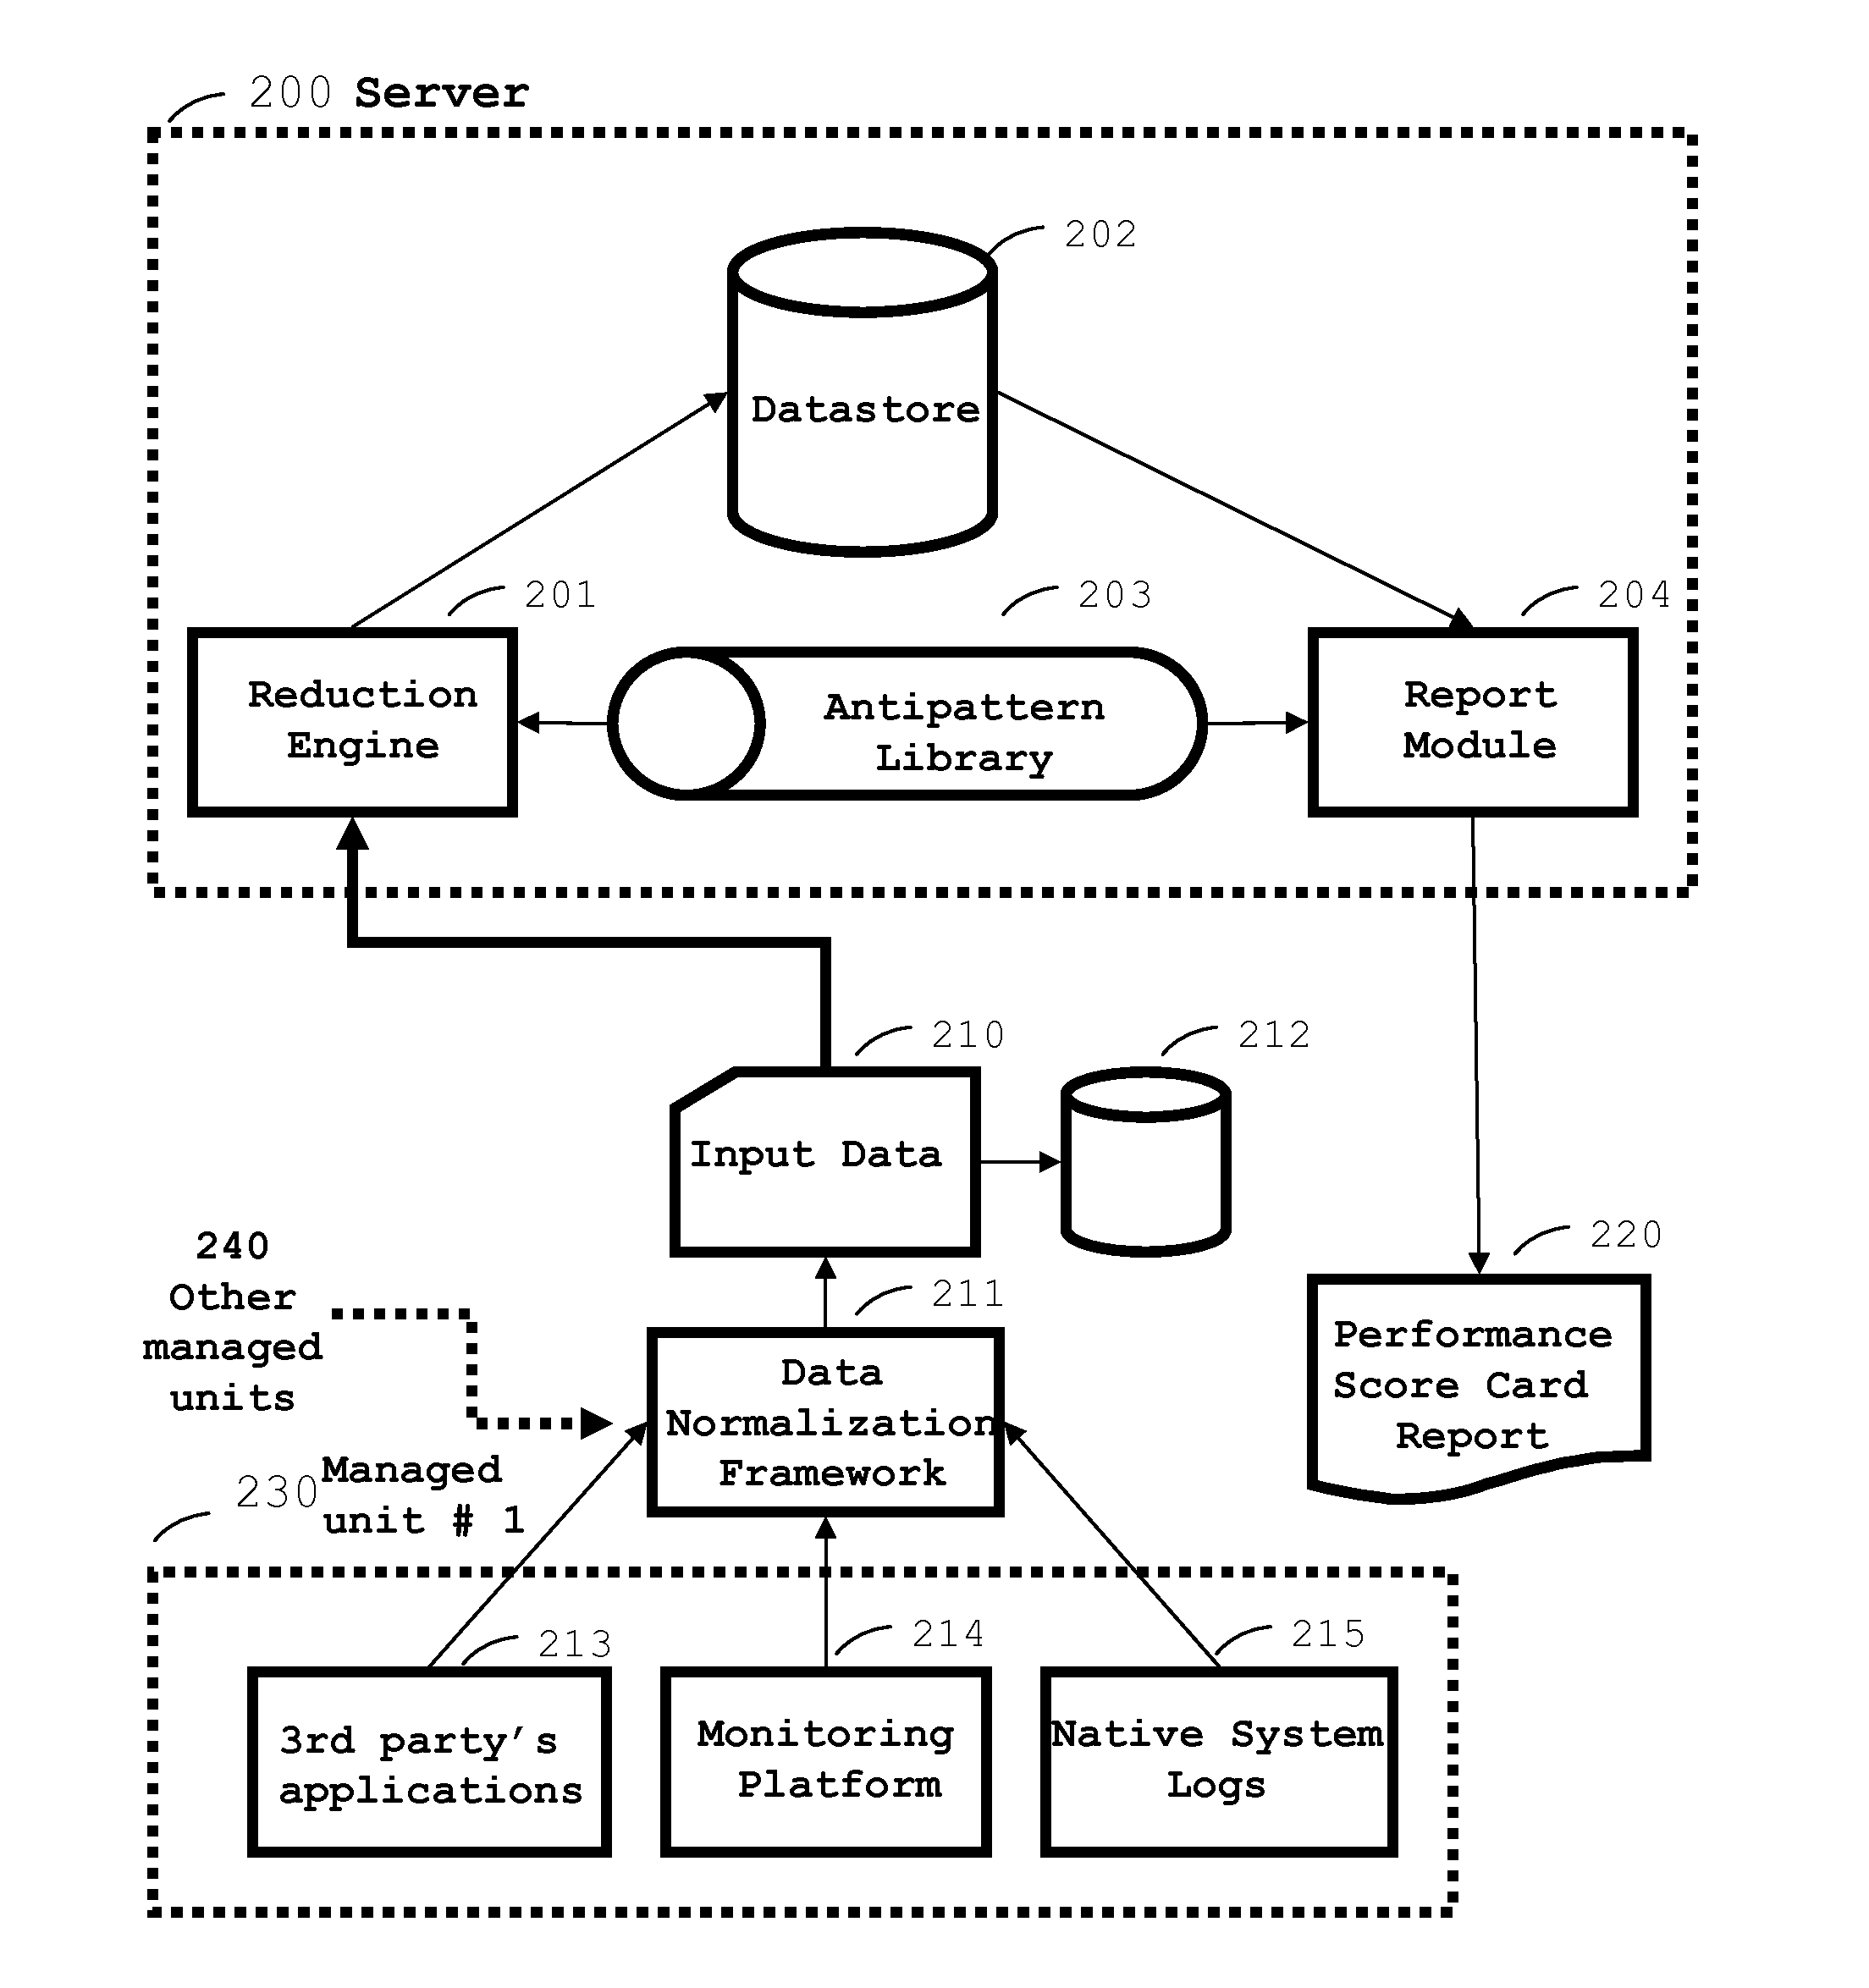
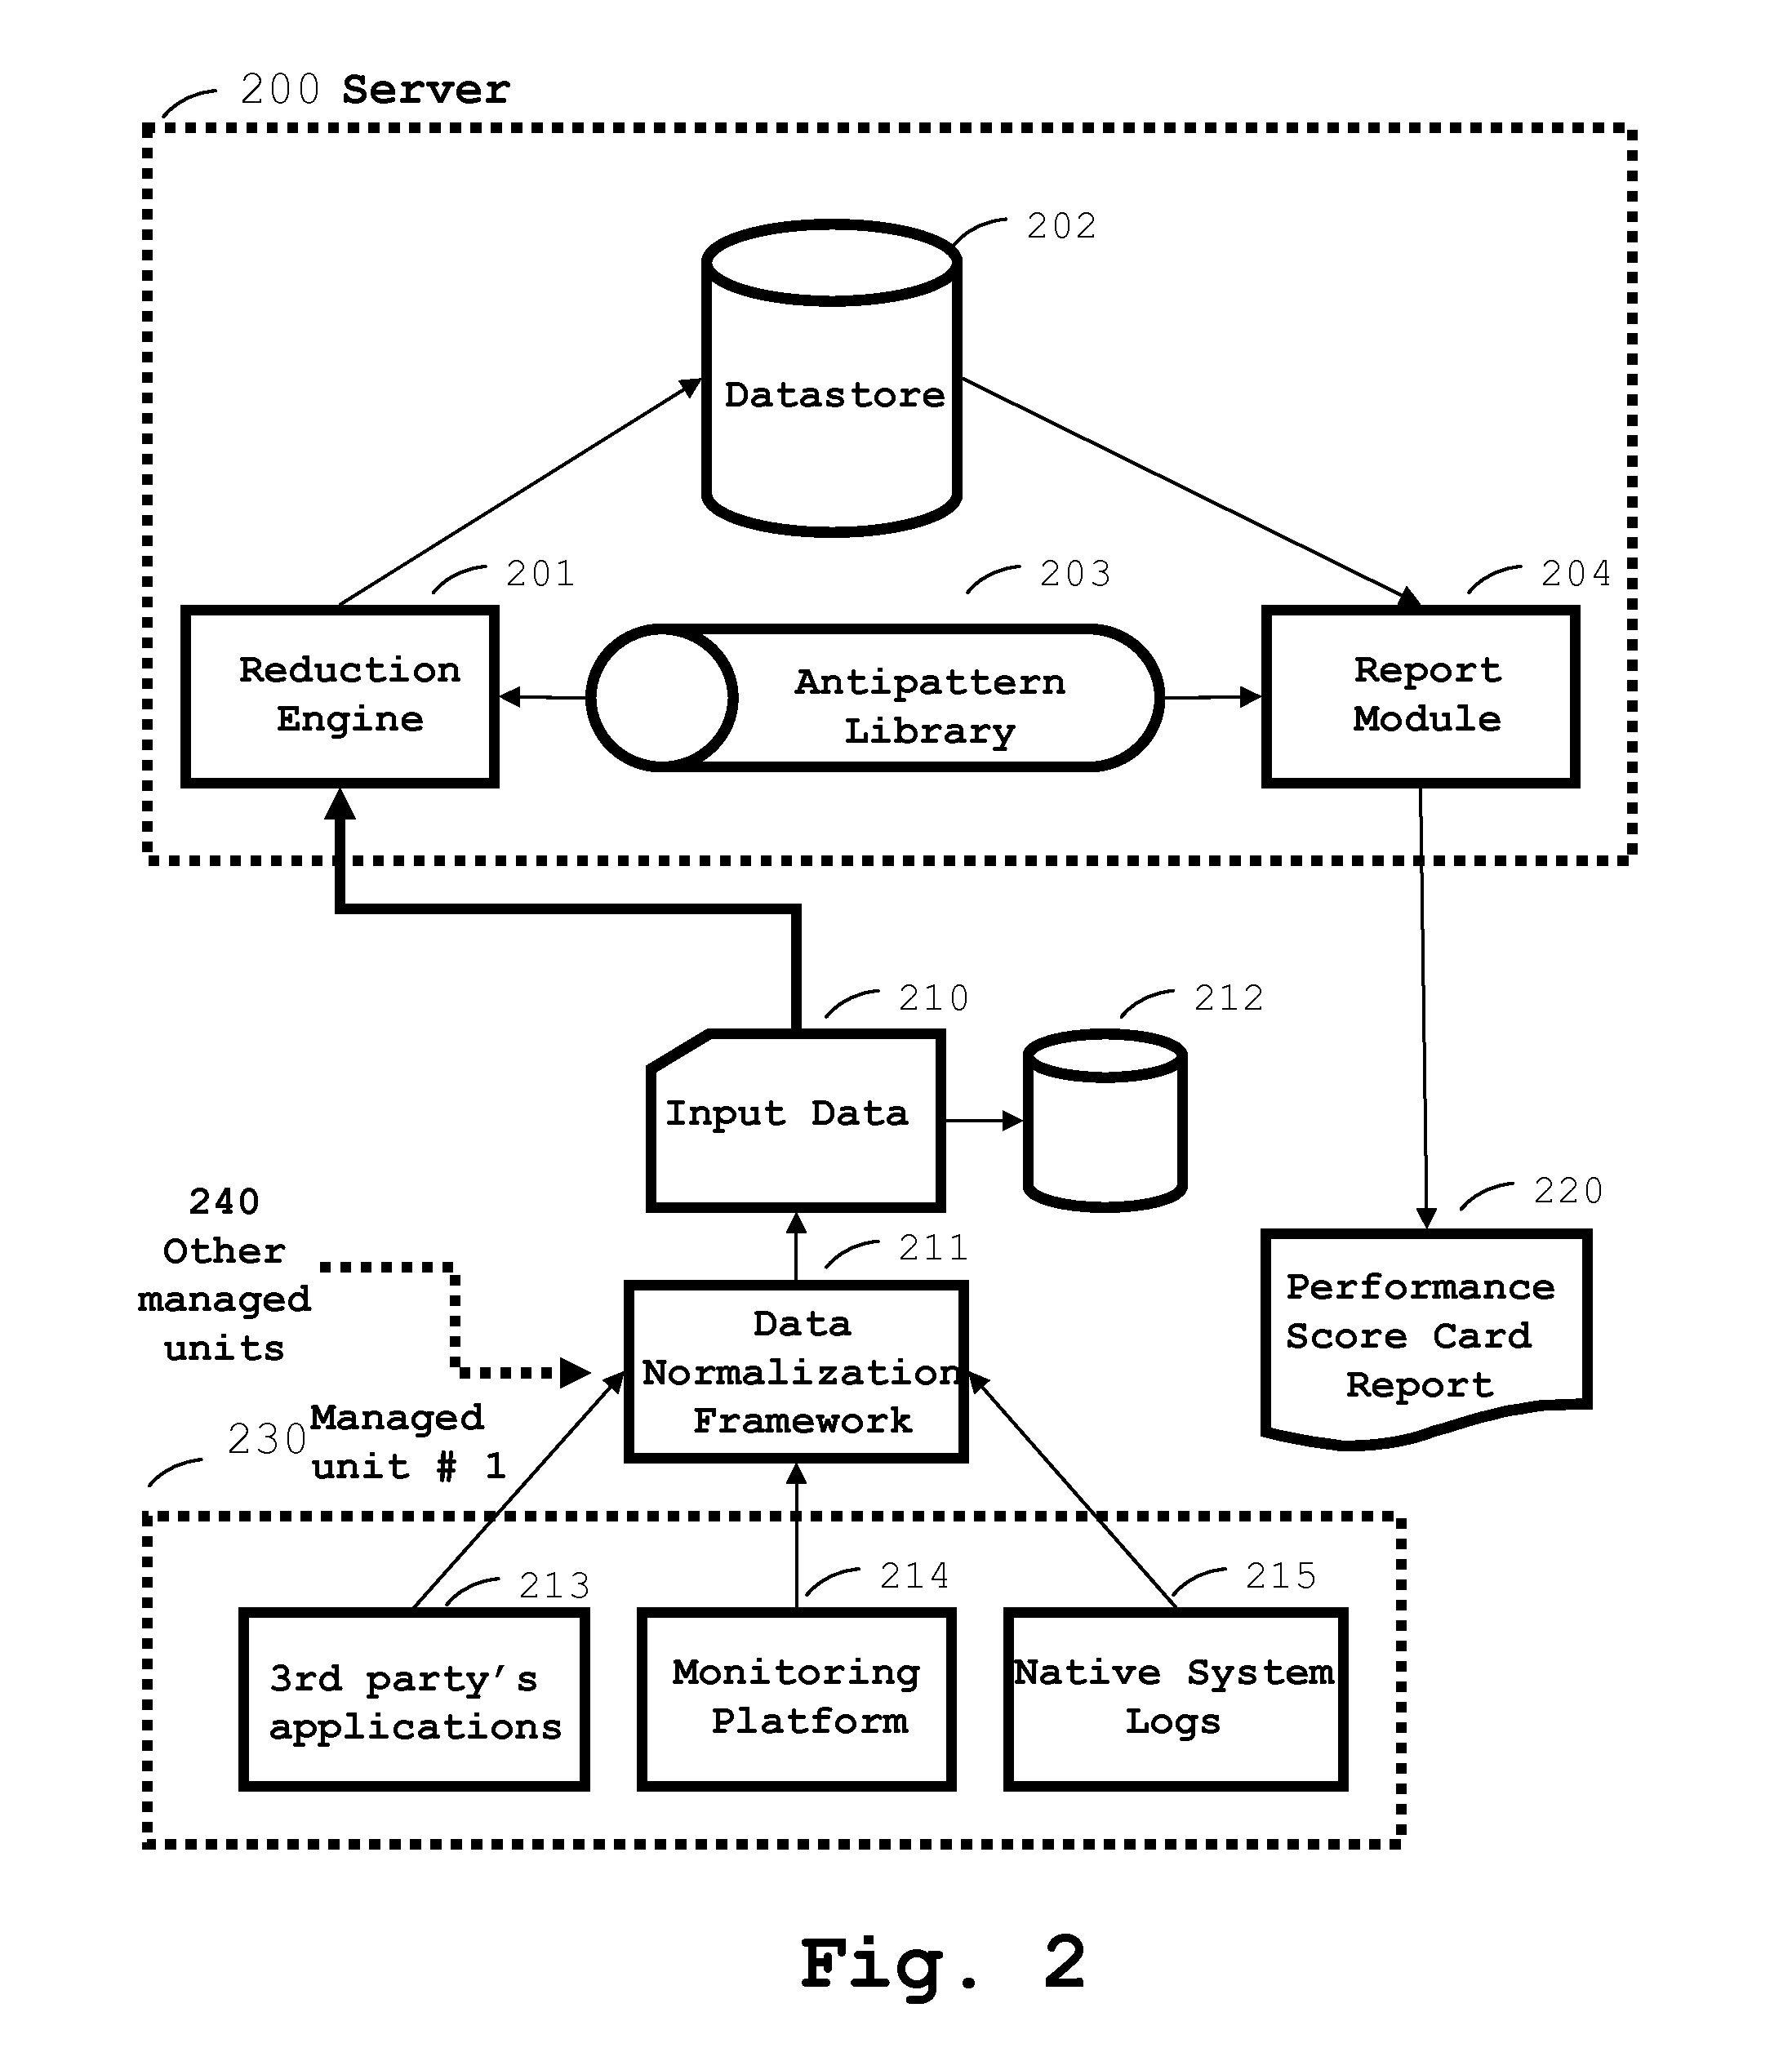
[0044]To facilitate description, any numeral identifying an element in one figure will represent the same element in any other figure.

[0045]The following text presents embodiments in the context of computer performance analysis but it is to be understood that it is not limited to this specific context or type of hardware; it extends equally to any type of IT resources or objects. It provides useful teachings to domains such as data center management or cloud computing resources (utility computing).

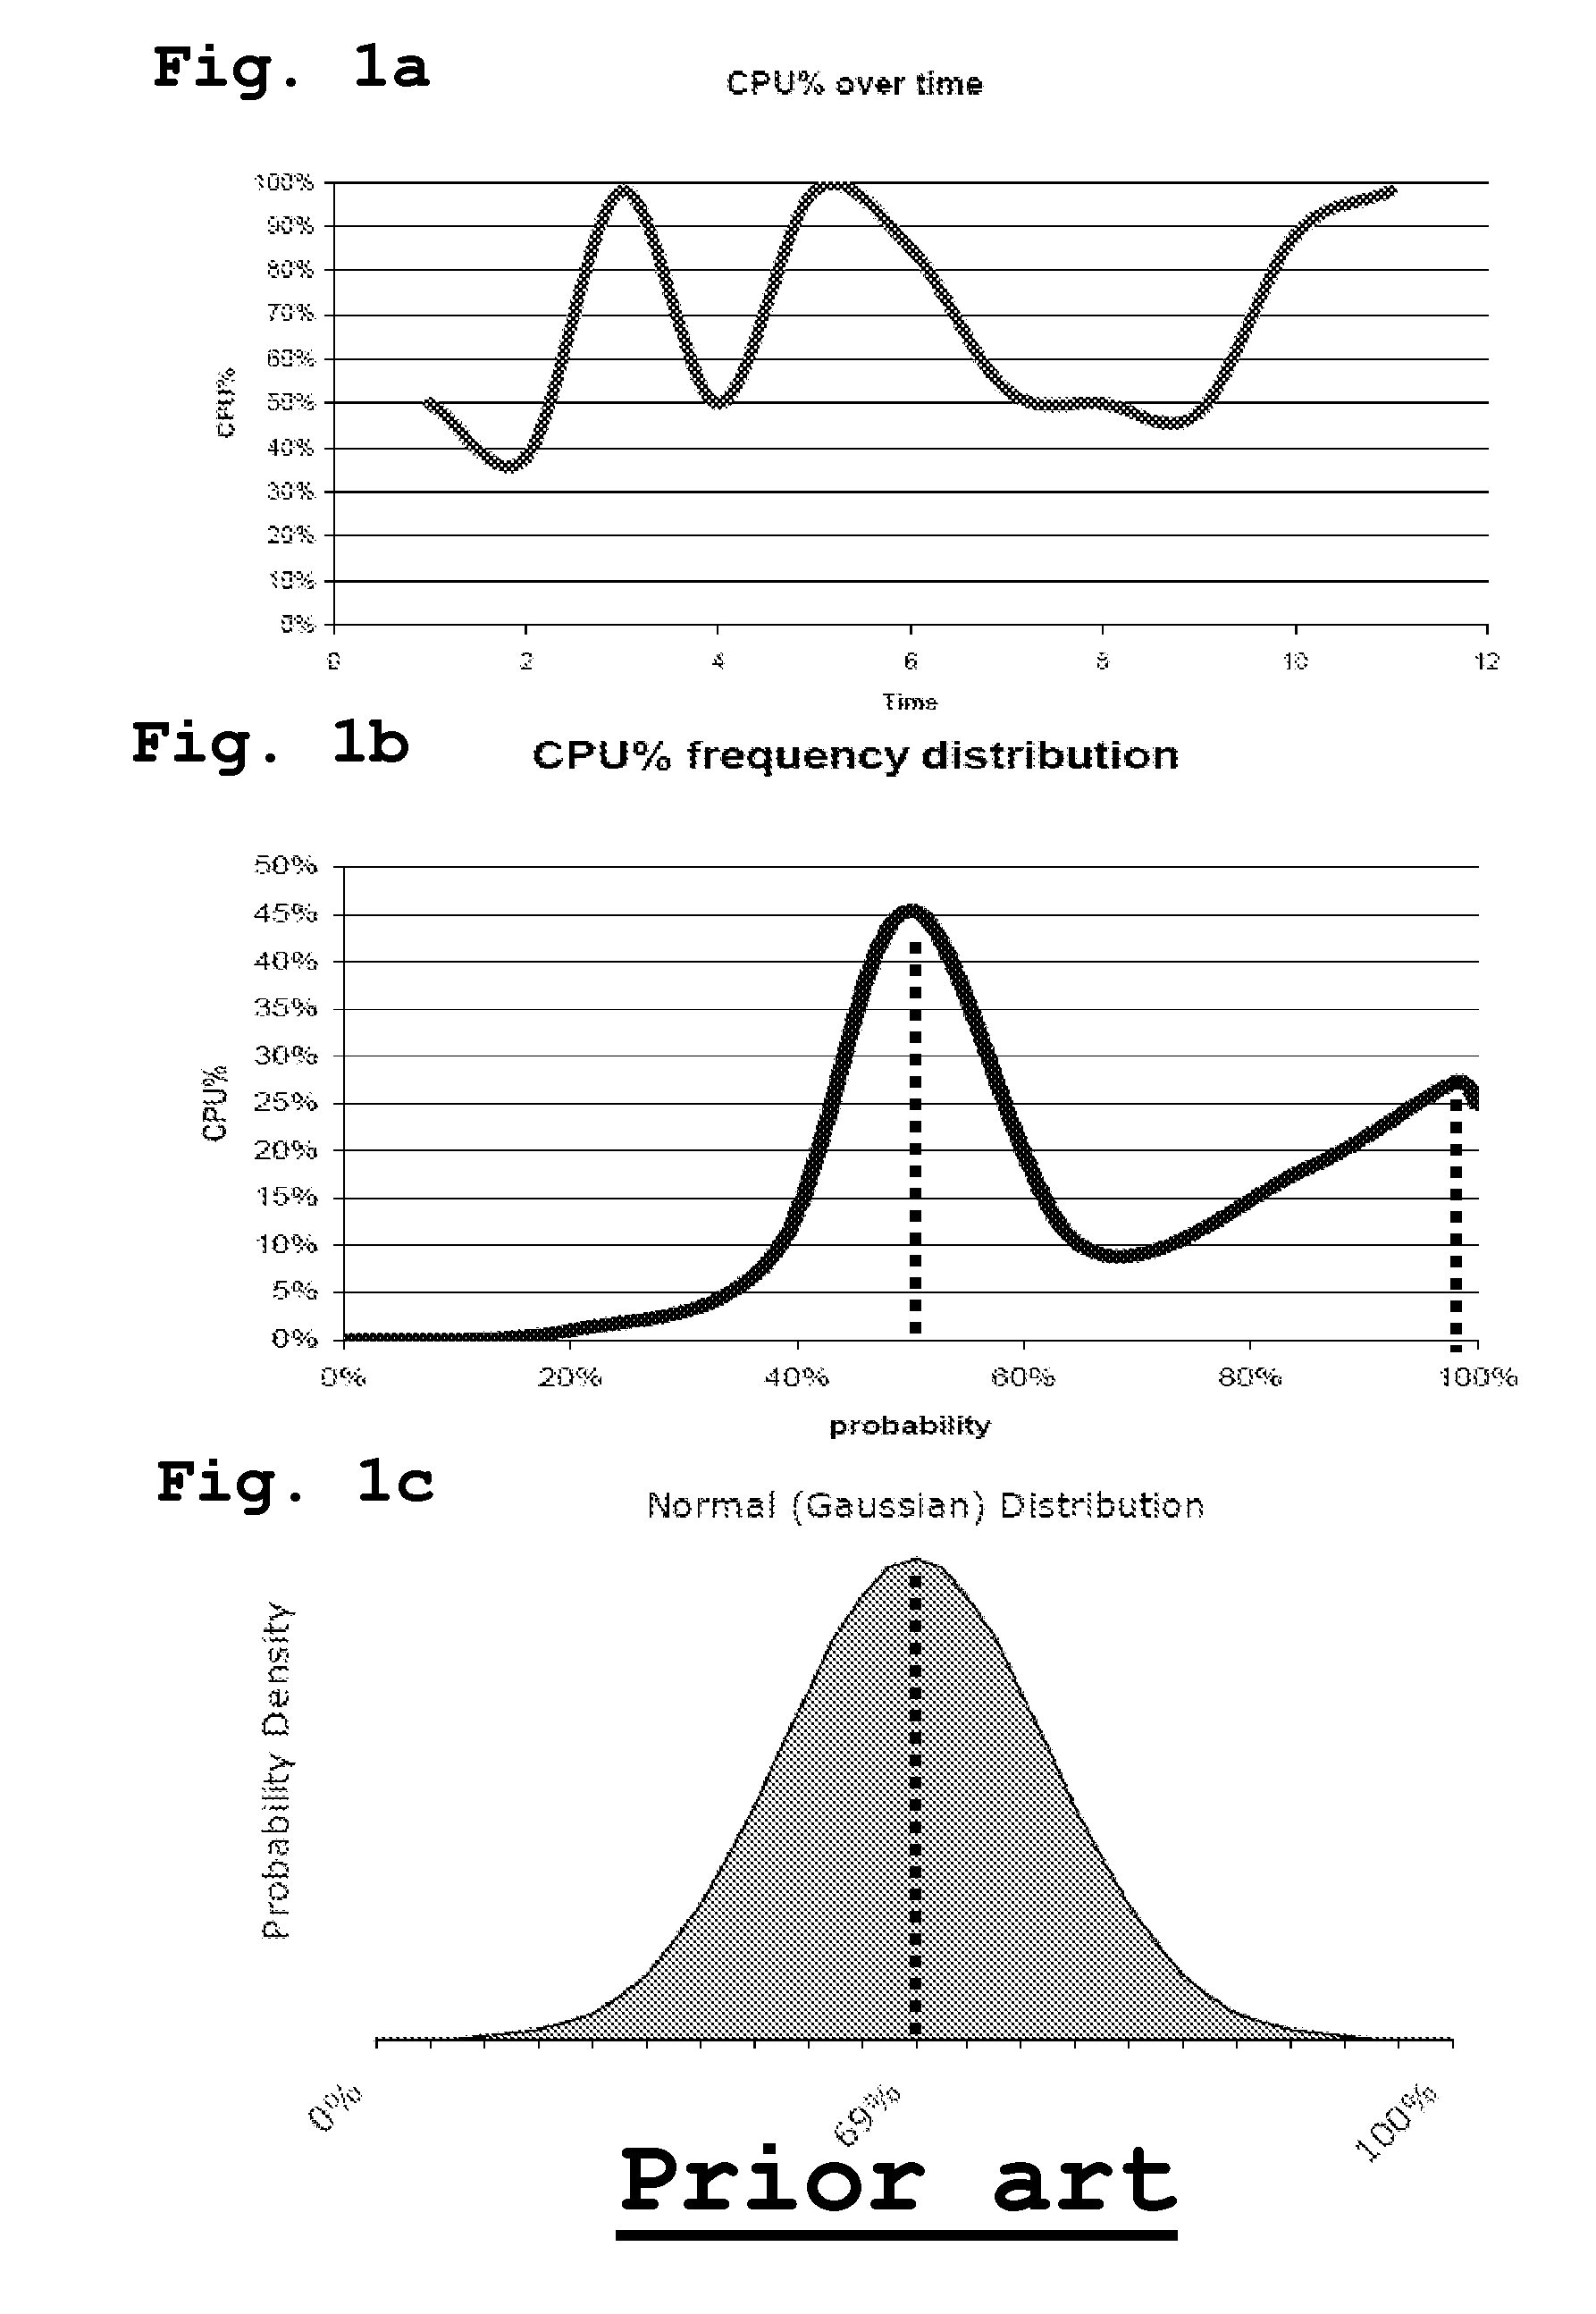
[0046]FIG. 1 illustrates approaches of the prior art.

[0047]In the technical domain of the monitoring and the analysis of IT systems, the following types of alternative approaches are to be found:

Type 1: the most simple approach is to analyze and get a human review of a given performance indicator (performance indicator in short) over time. These performance indicators are usually plotted on a graph for further analysis or compared to thresholds. This is mostly achieved on a case by case ba...


PUM


Abstract

There is disclosed a method of monitoring an infrastructure comprising managed units, the method comprising the steps of: acquiring data associated with a first performance indicator from a first managed unit; determining a first quantized distribution function of at least a subset of pieces of data of the acquired data of the first managed unit; determining if the first quantized distribution function verifies one or a plurality of predefined rules describing particular distribution functions of performance indicators.

Description

CROSS-REFERENCE TO RELATED APPLICATIONS[0001]This application claims priority under 35 U.S.C. §119(a) to European Patent Application Serial Number 09171727.2, filed Sep. 30, 2009, entitled “METHOD AND SYSTEM FOR IT RESOURCES PERFORMANCE ANALYSIS”, the entirety of which is incorporated herein by reference.FIELD OF THE INVENTION[0002]The present invention relates generally to data processing, and more particularly to systems and methods for computer performance analysis.BACKGROUND ART[0003]IT service providers need to carefully monitor performance and trends of the IT environment, to maintain its utilization under control. These organizations are facing technical challenges to perform properly the two key IT management processes: problem management and service measurement.[0004]In some situations there are problems on a specific application with clear root causes that need an analysis on a limited number of IT infrastructure components (for example servers or subsystems). In other sit...

Claims


Application Information

Patent Timeline
Patent Type & Authority Applications(United States)
IPC IPC(8): G06F11/30
CPCG06F11/3409G06F11/3476G06F11/3452G06F11/3442G06N20/00
Inventor LUCHI, DUCCIOMELLA, DARIOZAMPIERI, STEFANO
Owner KYNDRYL INC
Learn More