

Method for the diagnosis of non-alcoholic steatohepatitis based on a metabolomic profile
a metabolomic profile and non-alcoholic steatohepatitis technology, applied in the field of diagnostic methods, can solve the problems of liver failure, liver failure to support normal functions, liver failure to complete,
- Summary
- Abstract
- Description
- Claims
- Application Information
AI Technical Summary
Benefits of technology
Problems solved by technology
Method used
Image

Examples
example 1
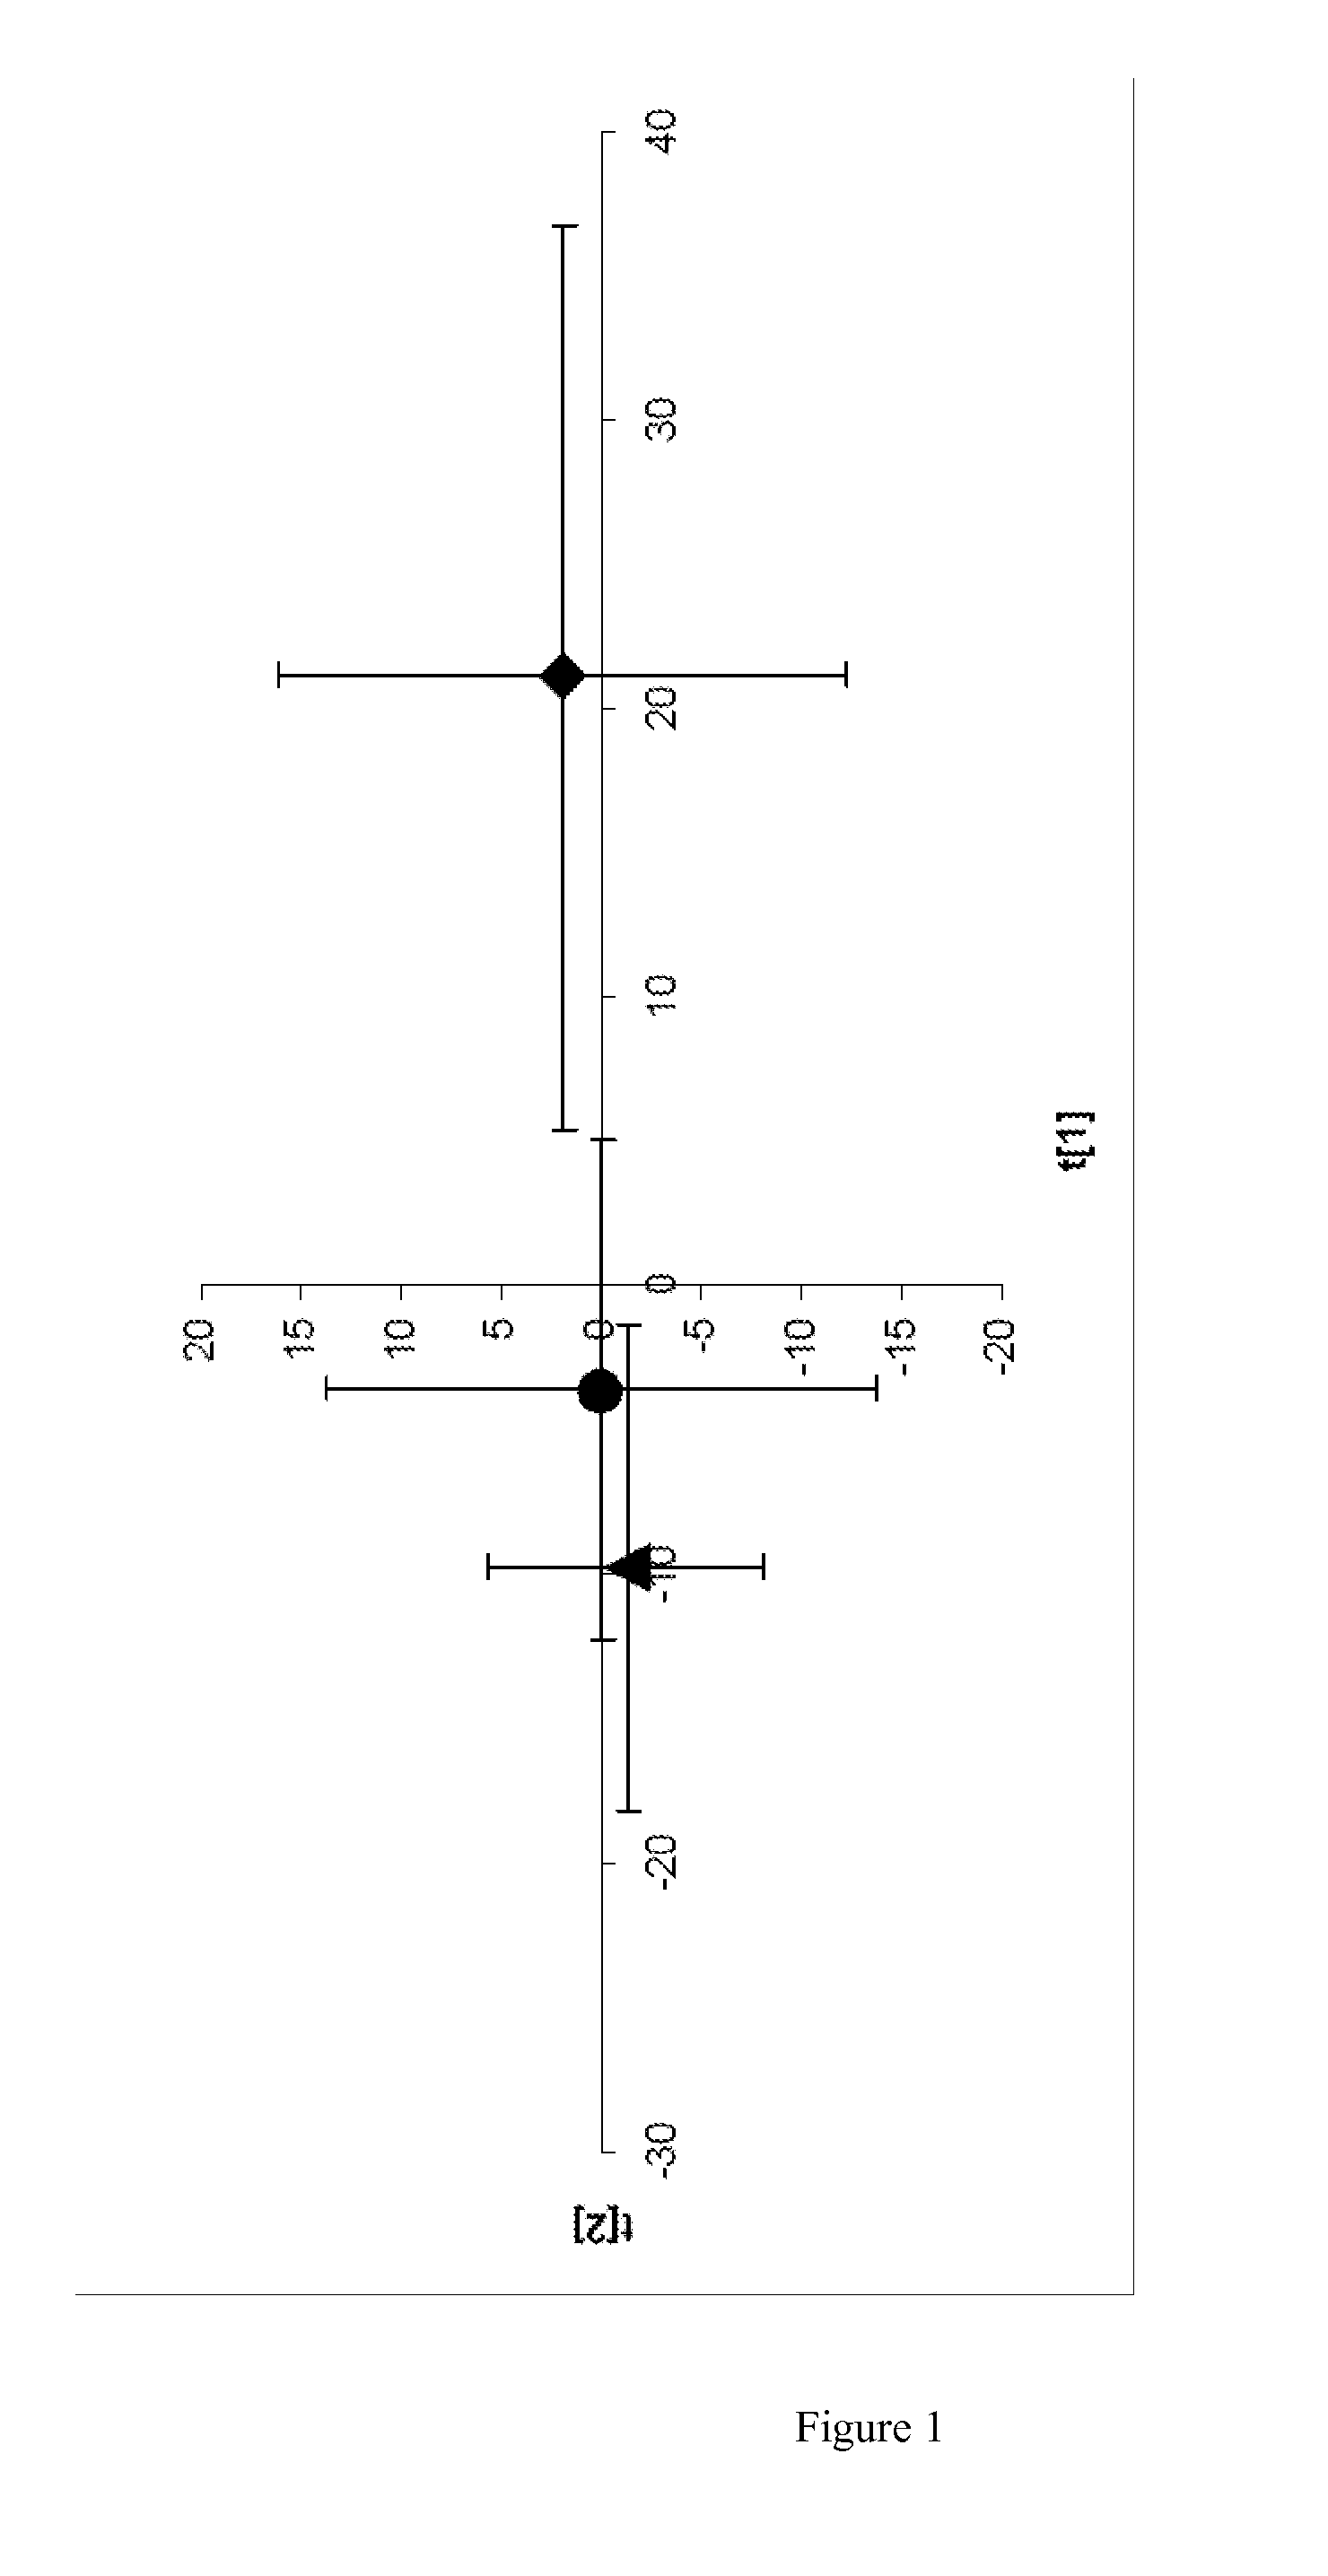
[0094]Metabolic profiling of serum samples taken from obese patients with normal liver, steatosis, or NASH. Since it is not known as to what extent obese individuals with normal liver, steatosis or NASH may be considered as discrete metabolic clusters, 15 age, sex and BMI matched serum samples were analyzed by UPLC®-MS (5 with a normal liver histology, 5 with steatosis grade S3, and 5 with NASH grade 1). PCA was used to produce a two-dimensional visual summary of the observed variation in the serum metabolic profiles of these samples (FIG. 1). The results indicate that obese subjects with a normal liver histology and obese NAFLD patients do not cluster together, with normal liver patients having a higher, positive score in the first principal component, t[1]. A less prominent differentiation between the steatosis and NASH patients is also apparent, perhaps suggesting that these conditions may also have distinct metabolic profiles.
example 2
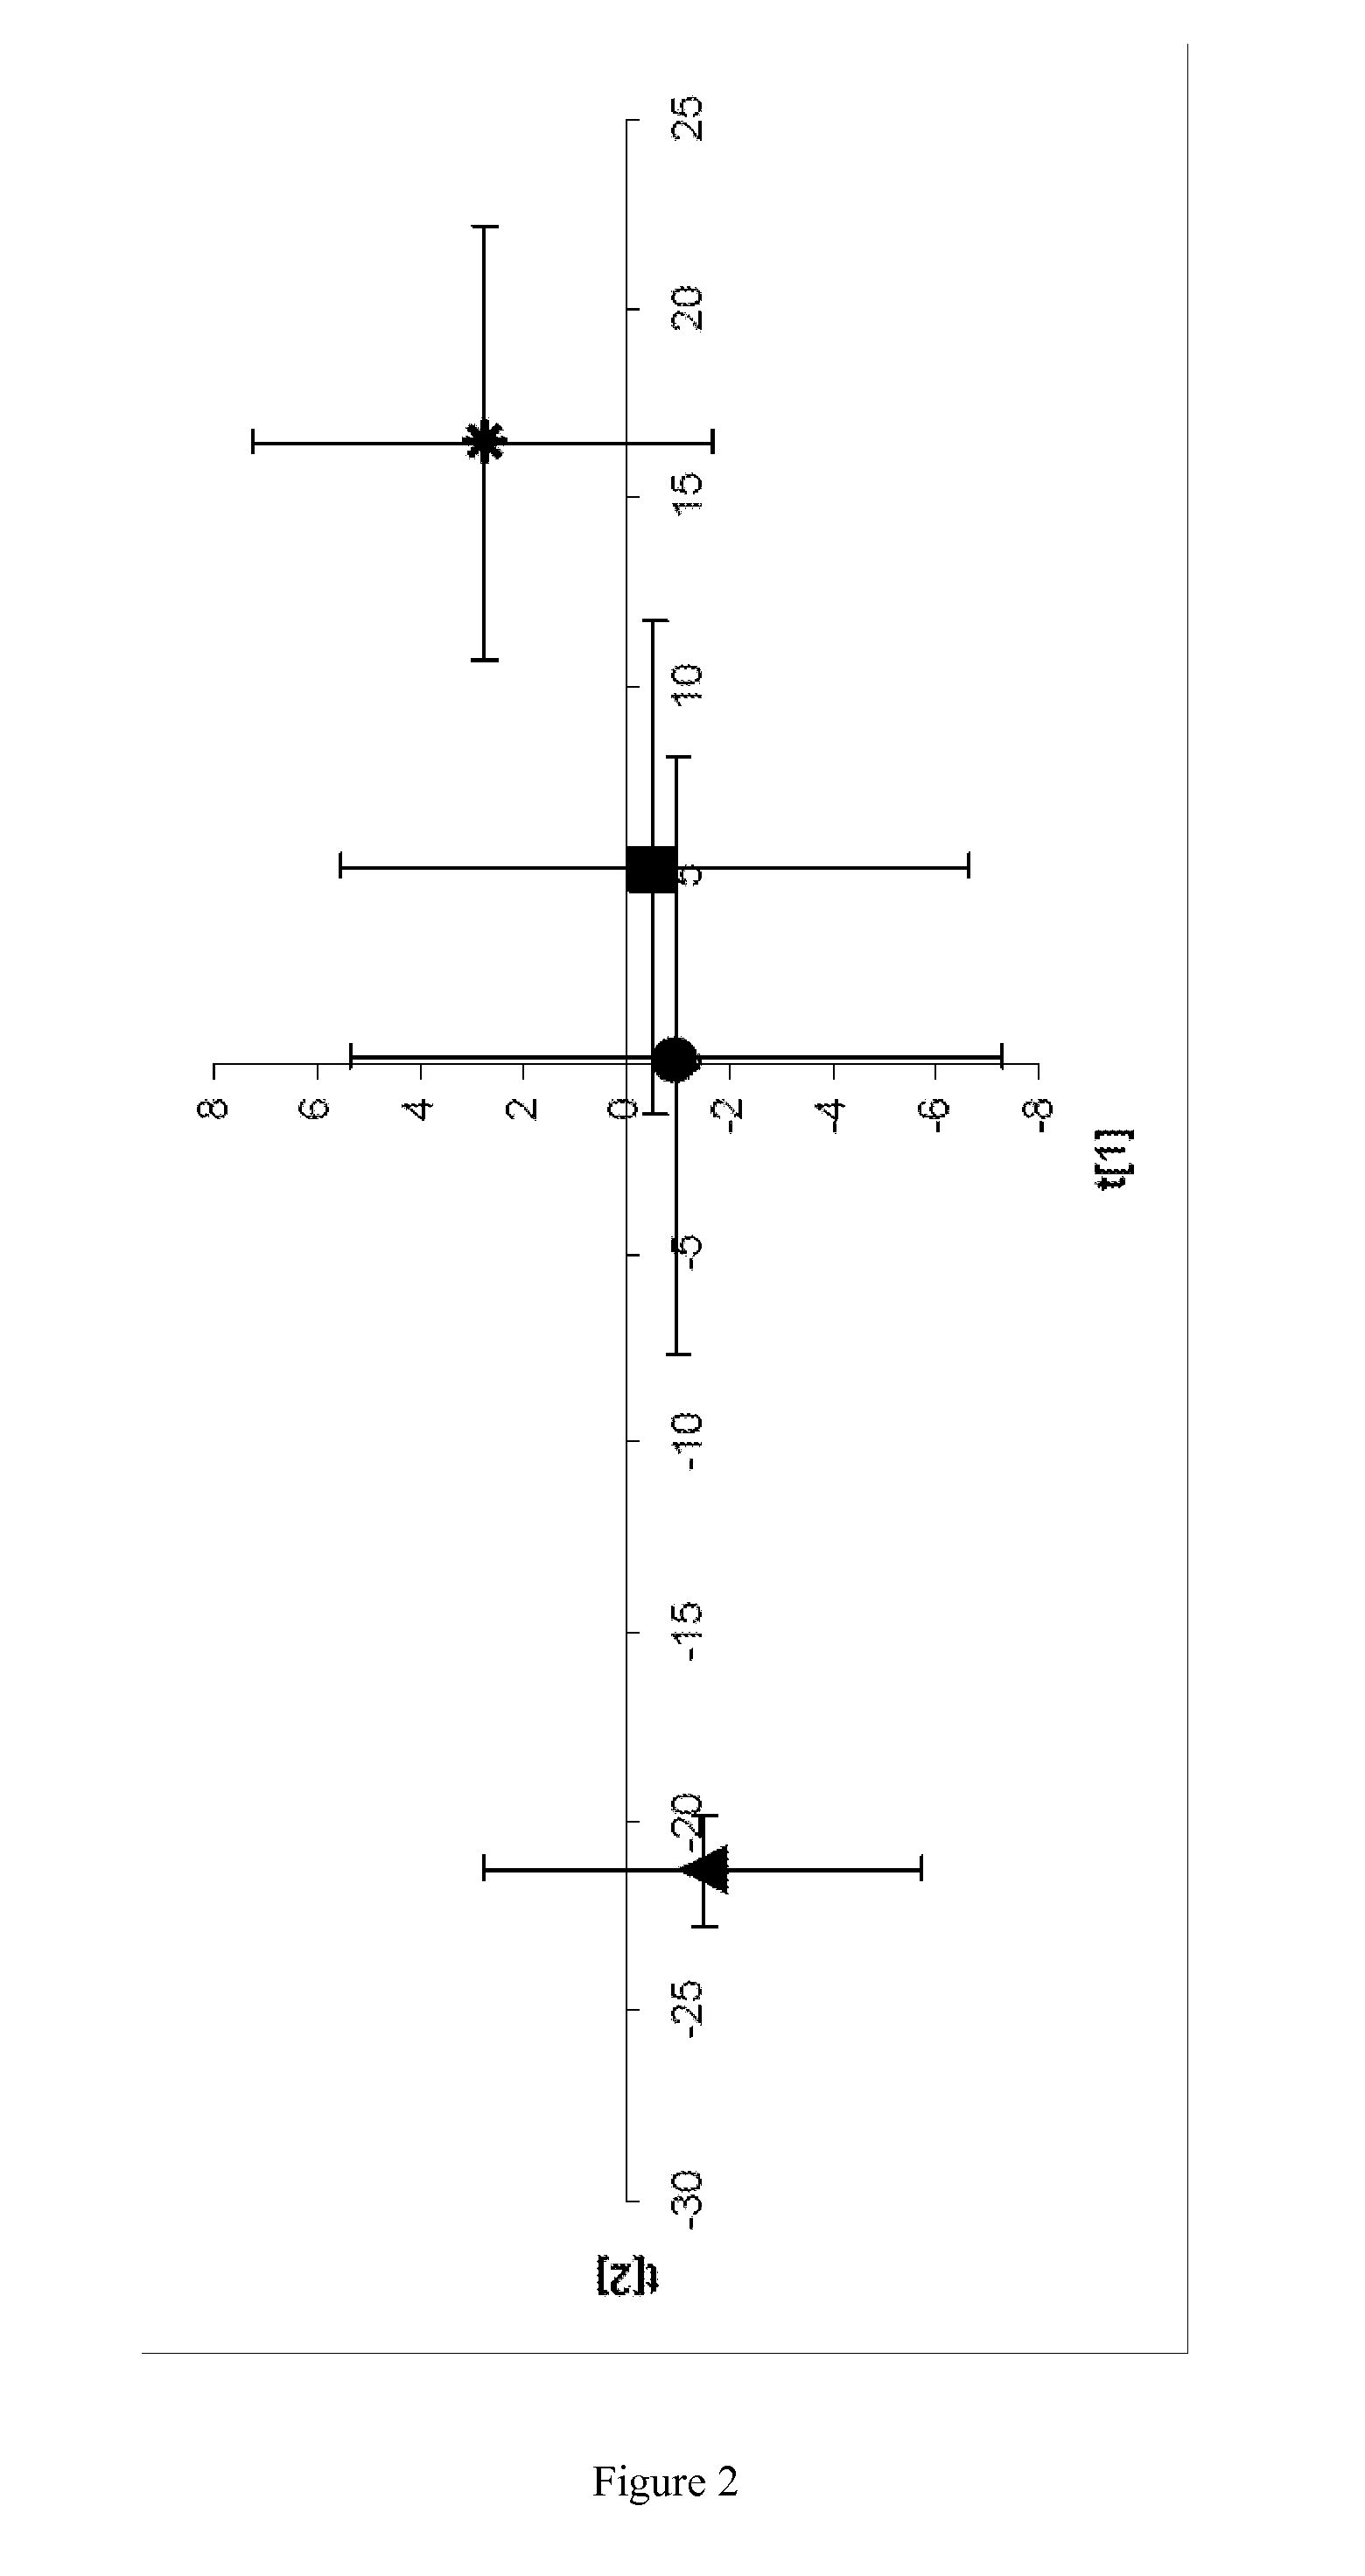
[0095]Extended metabolic profiling study of serum samples collected from patients with a histological diagnosis of steatosis or NASH. In order to further investigate the apparent NAFLD metabolic correlation observed in the obese patients, a larger set of serum samples was analyzed. A total of 74 samples were collected from NAFLD patients: 54 with a histological diagnosis of steatosis (20 with steatosis grade S1, 18 with steatosis grade S2, and 16 with steatosis grade S3), and 20 with a histological diagnosis of NASH grade 1 (Table 1). Analysis of the PCA scores plot corresponding to these samples (FIG. 2) reveals a notable separation between the NASH and steatosis patients, where the steatosis patients have a higher, positive score in the first principal component t[1]. This figure also shows a clear trajectory of the different stages of steatosis (S1-S3) along the first principal component—lower grades have a higher, positive score—indicating a metabolic correlation with steatosis ...
example 3
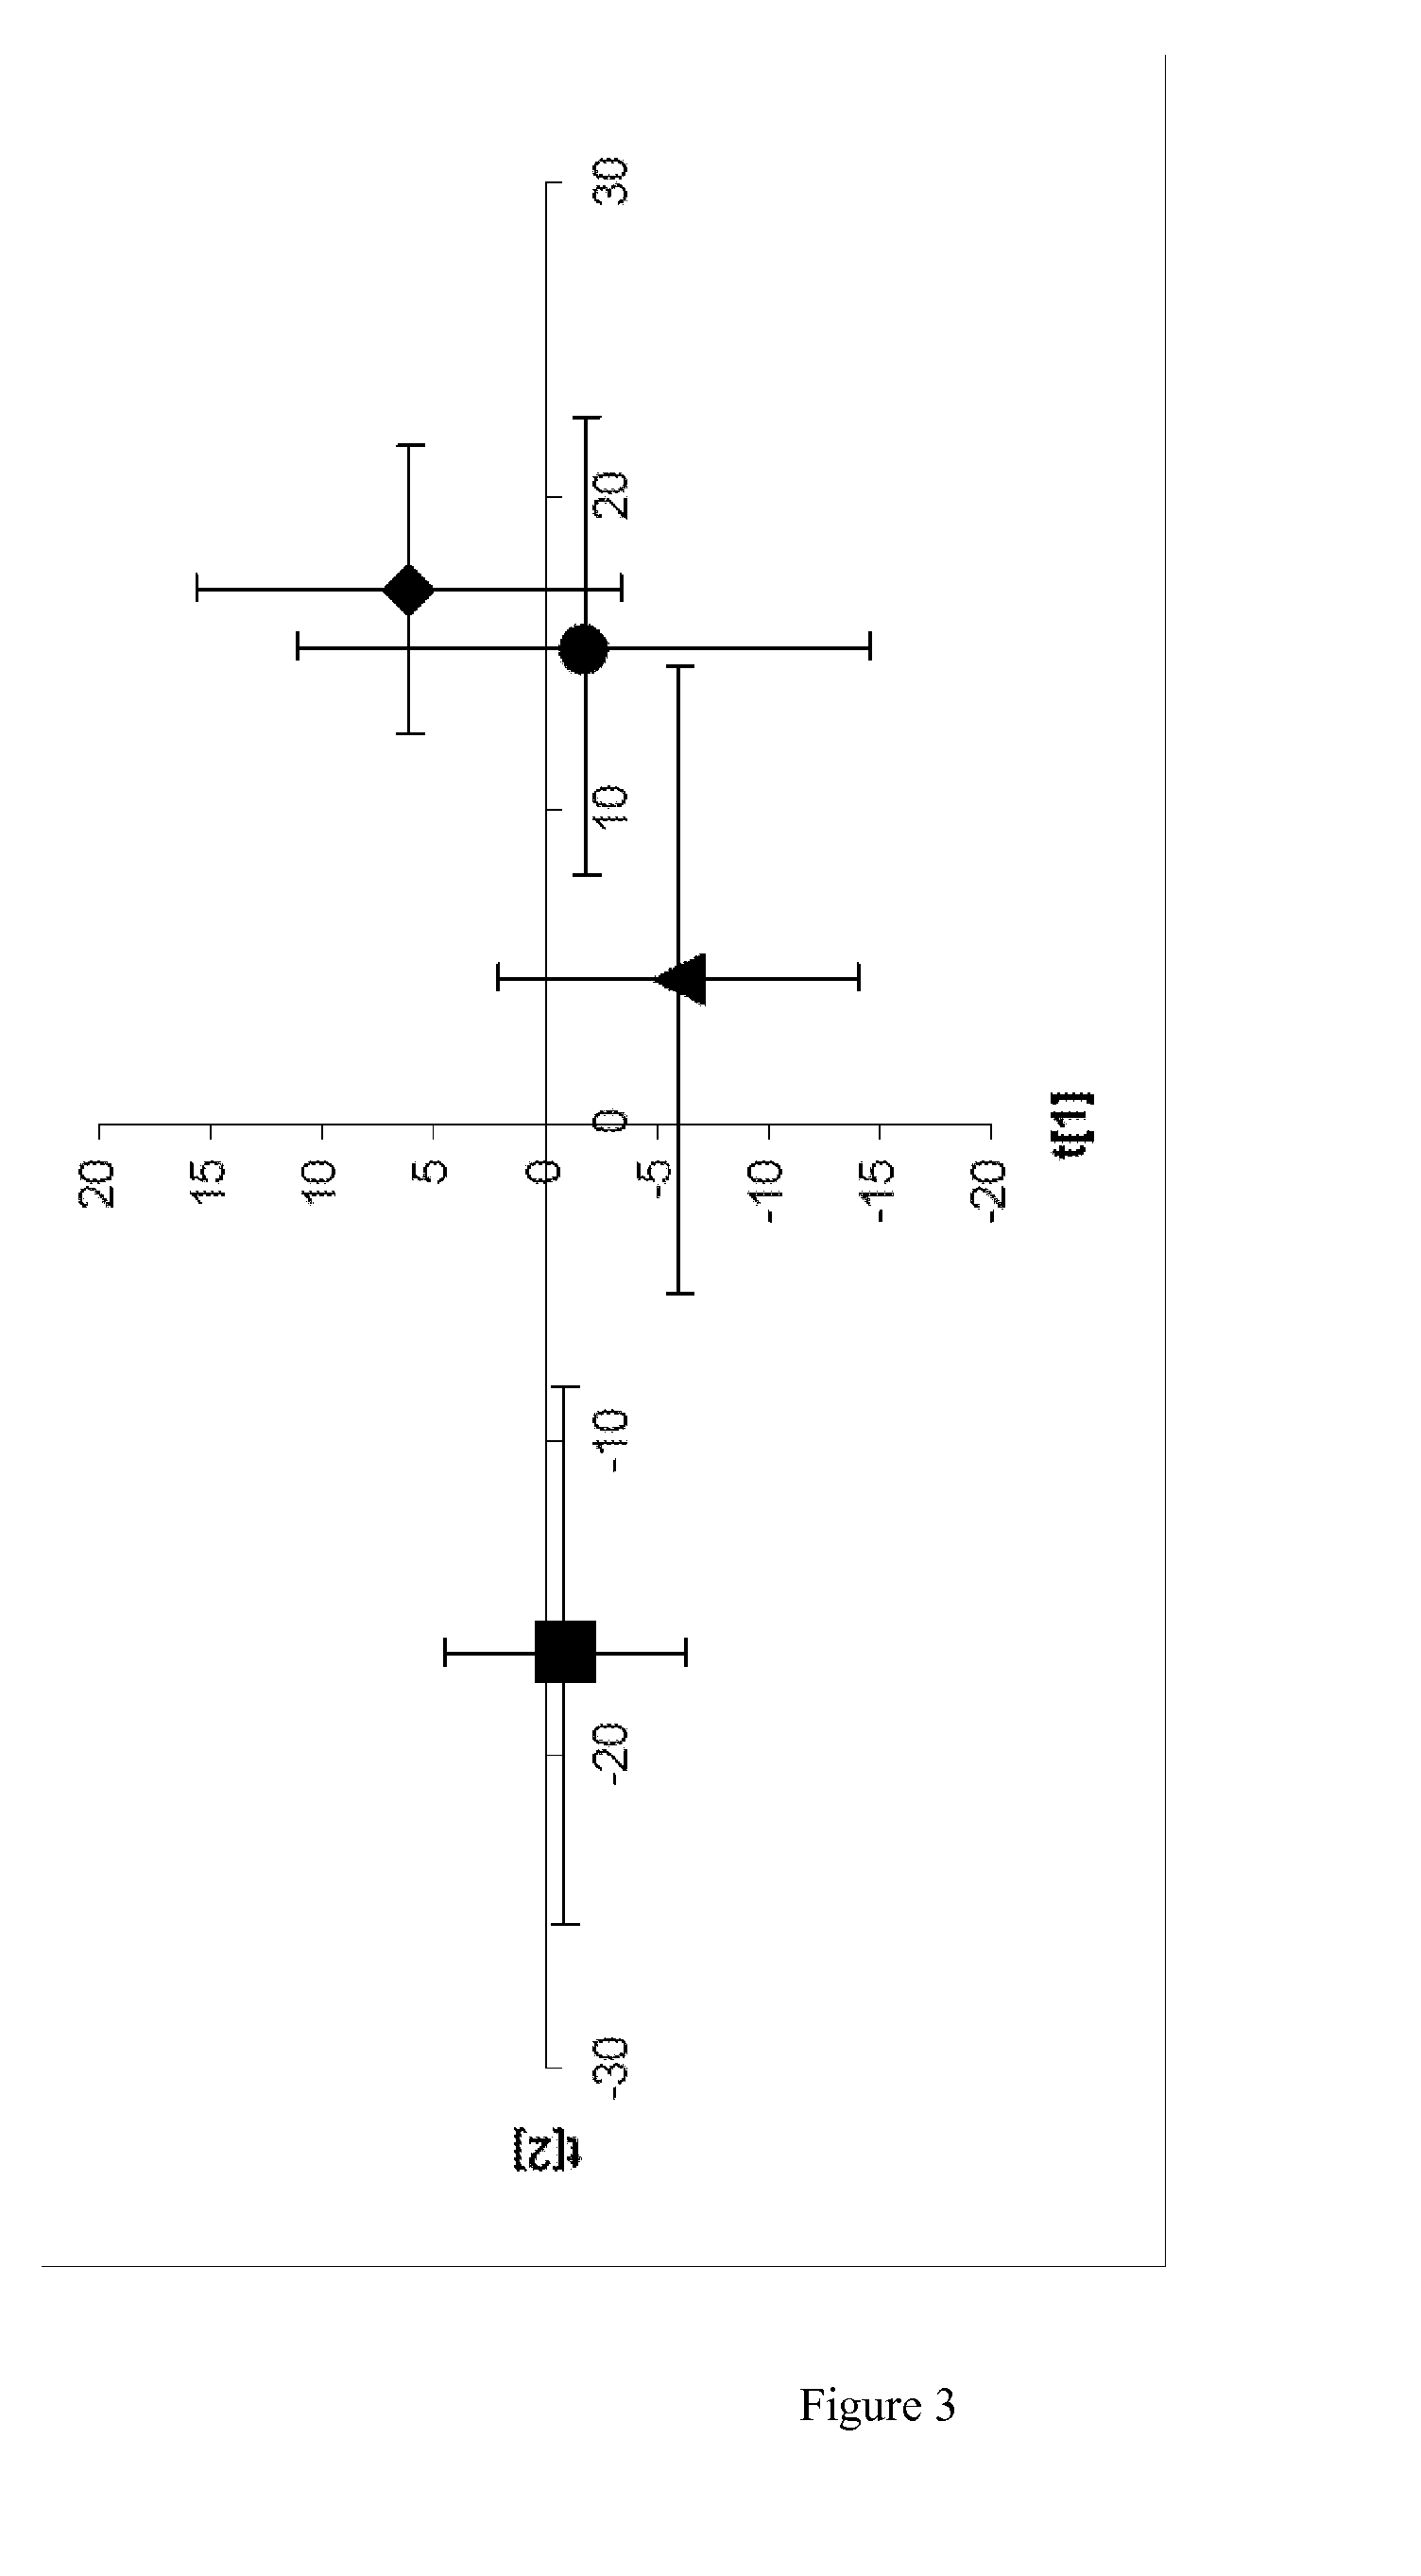
[0096]Metabolic profiling of plasma samples taken from obese patients with a histological diagnosis of steatosis or NASH. To determine if the metabolic profile trends observed in serum also hold for plasma, a third set of samples was analyzed, corresponding to plasma taken from 30 NAFLD patients: 16 steatosis and 14 NASH (Table 3). This set of samples was important since, in contrast to the situation in the serum samples, there was no significant difference in BMI between the plasma steatosis and NASH samples. The PCA scores plot corresponding to the plasma samples (FIG. 3) reveals very similar trends to those observed in serum; i.e. a quite clear NAFLD metabolic trajectory along the first principal component is observed.
TABLE 3Clinical details of the patients used for the plasma sample study.GroupFemaleMaleAge (years)BMI (kg / m2)Steatosis grade 16052.2 ± 2.437.3 ± 1.2Steatosis grade 25246.3 ± 2.737.6 ± 3.1Steatosis grade 32150.0 ± 3.542.3 ± 3.2NASH13141.0 ± 2.537.1 ± 1.6Diagnosis of...
PUM
 Abstract
Description
Claims
Application Information